| Param | Original file | Final file |
|---|---|---|
| Filename | modeM0/AS1A09_012T03_9000003782_26189cztM0_level2.evt | modeM0/AS1A09_012T03_9000003782_26189cztM0_level2_quad_clean.evt |
| Size (bytes) | 183,718,080 | 53,631,360 |
| Size | 175.2 MB | 51.1 MB |
| Events in quadrant A | 1,236,508 | 353,988 |
| Events in quadrant B | 1,348,183 | 358,537 |
| Events in quadrant C | 1,268,999 | 357,877 |
| Events in quadrant D | 1,516,136 | 351,910 |
| Mode M0 | |||
|---|---|---|---|
| Quadrant | BADHDUFLAG | Total packets | Discarded packets |
| A | 0 | 5650 | 0 |
| B | 0 | 5801 | 0 |
| C | 0 | 5675 | 0 |
| D | 0 | 6374 | 0 |
| Quadrant | Total seconds | Saturated seconds | Saturation percentage |
|---|---|---|---|
| A | 2822 | 5 | 0.177179% |
| B | 2823 | 4 | 0.141693% |
| C | 2823 | 6 | 0.212540% |
| D | 2823 | 30 | 1.062699% |
Noise dominated data is calculated using 1-second bins in cleaned event files. If a bin has >2000 counts, and if more than 50% of those come from <1% of pixels, then it is considered to be noise-dominated and hence unusable.
| Quadrant | # 1 sec bins | Bins with >0 counts | Bins with >2000 counts | High rate bins dominated by noise | Noise dominated (total time) | Noise dominated (detector-on time) | Marked lightcurve |
|---|---|---|---|---|---|---|---|
| A | 2822 | 2822 | 0 | 0 | 0.00% | 0.00% | 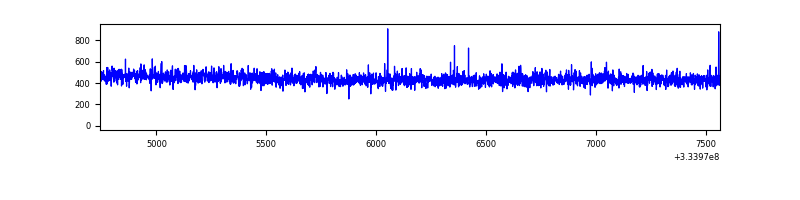 |
| B | 2823 | 2823 | 0 | 0 | 0.00% | 0.00% | 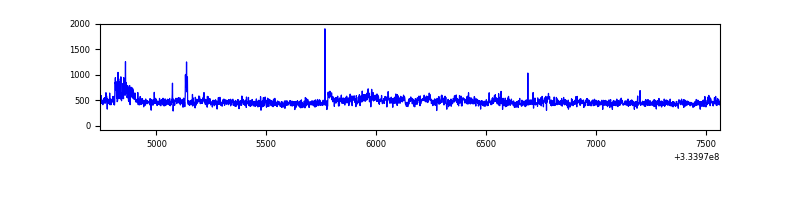 |
| C | 2823 | 2823 | 0 | 0 | 0.00% | 0.00% | 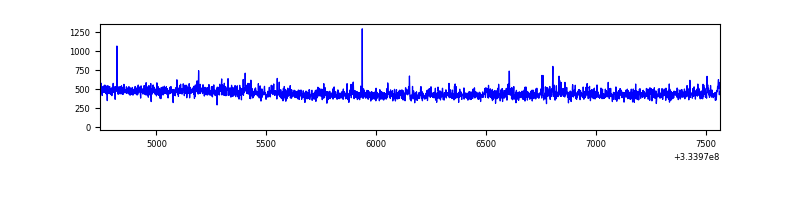 |
| D | 2823 | 2823 | 23 | 23 | 0.81% | 0.81% | 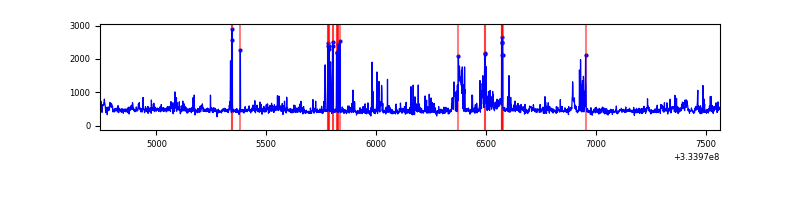 |
Top three noisy pixels from each quadrant. If the there are fewer than three noisy pixels in the level2.evt file, extra rows are filled as -1
| Pixel properties | Quadrant properties | ||||||
|---|---|---|---|---|---|---|---|
| Quadrant | DetID | PixID | Counts | Sigma | Mean | Median | Sigma |
| A | 13 | 254 | 4666 | 67.23 | 319 | 313 | 64.8 |
| A | 3 | 137 | 2985 | 41.26 | 319 | 313 | 64.8 |
| A | 0 | 226 | 2798 | 38.38 | 319 | 313 | 64.8 |
| B | 0 | 230 | 75250 | 1246.28 | 316 | 308 | 60.1 |
| B | 0 | 245 | 20675 | 338.7 | 316 | 308 | 60.1 |
| B | 0 | 190 | 16697 | 272.55 | 316 | 308 | 60.1 |
| C | 14 | 238 | 49976 | 689.96 | 305 | 307 | 72.0 |
| C | 2 | 16 | 15793 | 215.12 | 305 | 307 | 72.0 |
| C | 3 | 233 | 14152 | 192.32 | 305 | 307 | 72.0 |
| D | 1 | 52 | 302789 | 4081.68 | 308 | 301 | 74.1 |
| D | 12 | 233 | 30401 | 406.16 | 308 | 301 | 74.1 |
| D | 2 | 234 | 13008 | 171.46 | 308 | 301 | 74.1 |
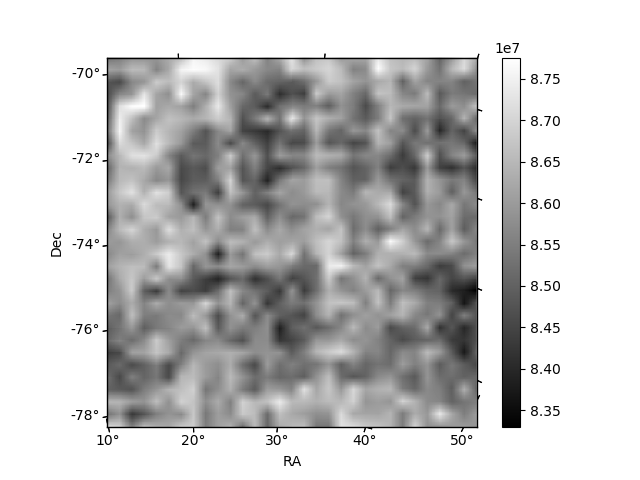
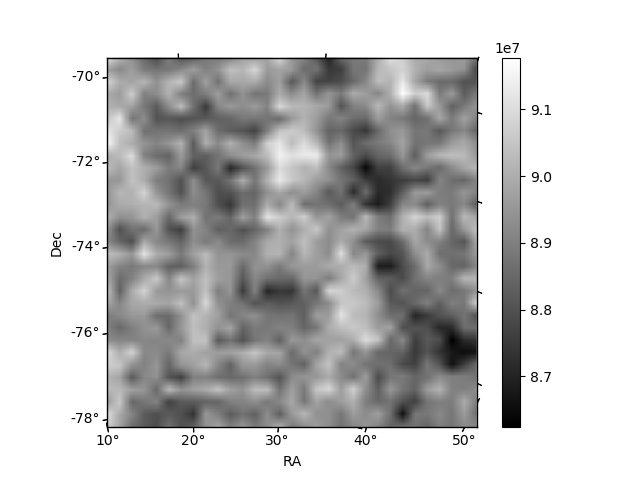
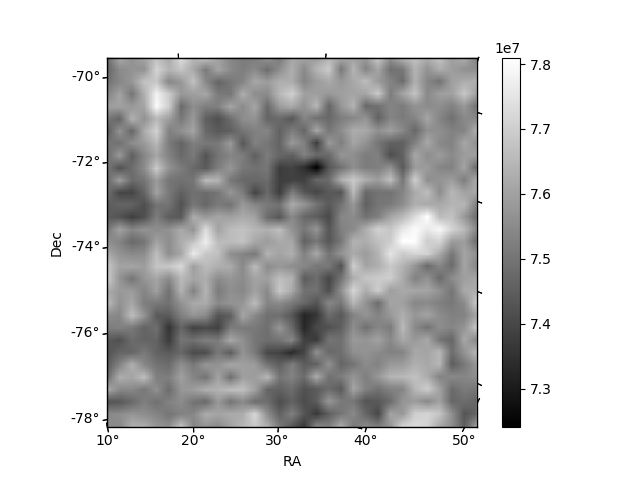
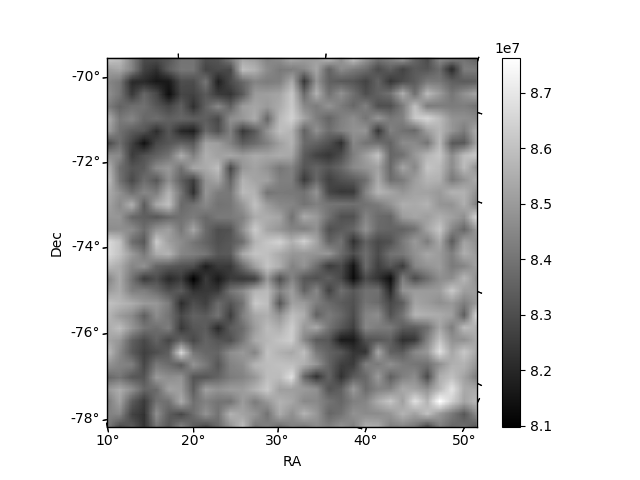
Histogram calculated using DETX and DETY for each event in the final _common_clean file
| Quadrant A | 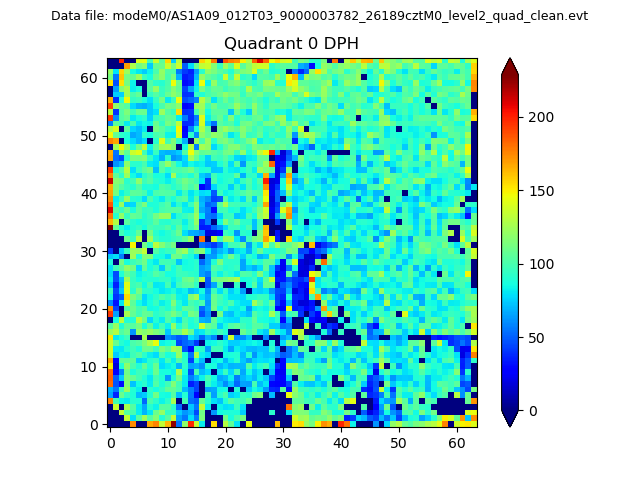 |
 |
Quadrant B |
|---|---|---|---|
| Quadrant D |  |
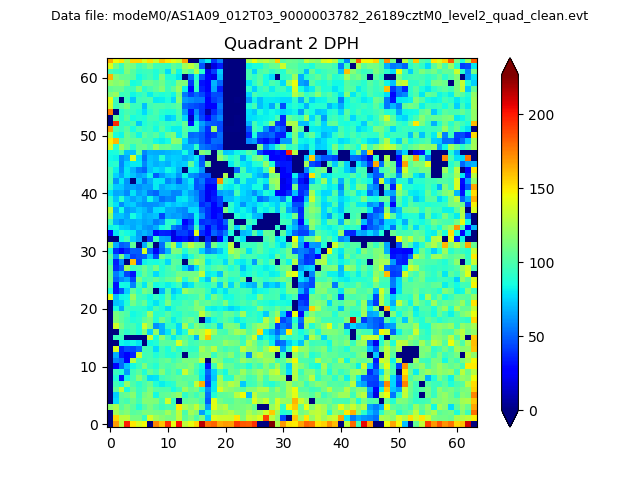 |
Quadrant C |
| Plot type | Count rate plots | Images |
|---|---|---|
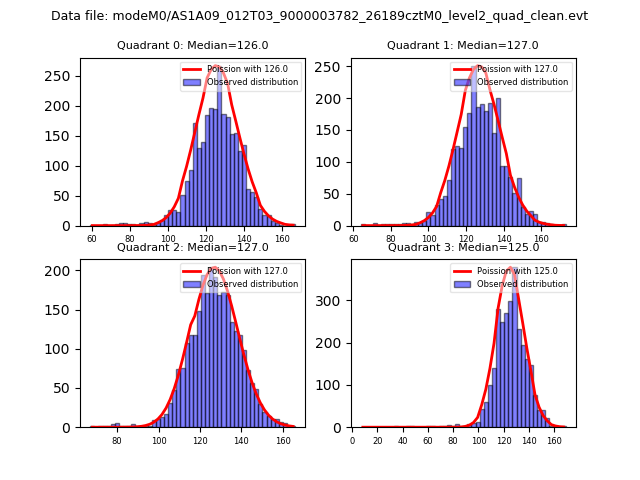
| Comparison with Poisson distribution Blue bars denote a histogram of data divided into 1 sec bins. Red curve is a Poisson curve with rate = median count rate of data. |
 |
 |
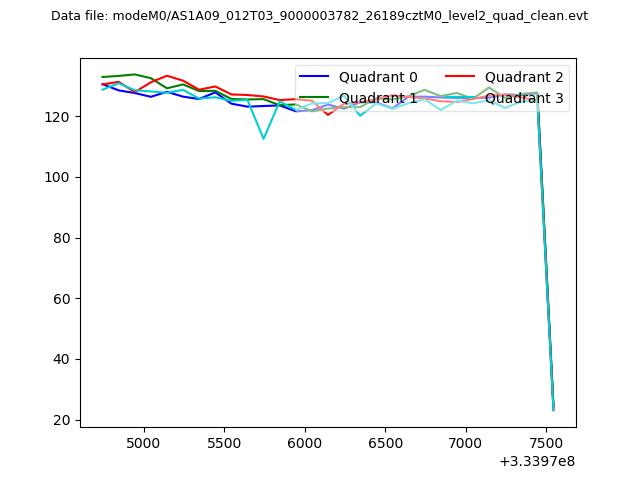
| Quadrant-wise count rates Data is divided into 100 sec bins |
 |
|
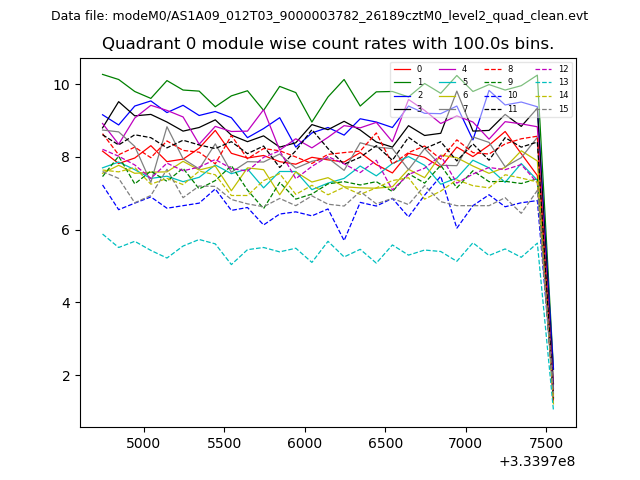
| Module-wise count rates for Quadrant A Data is divided into 100 sec bins |
 |
 |
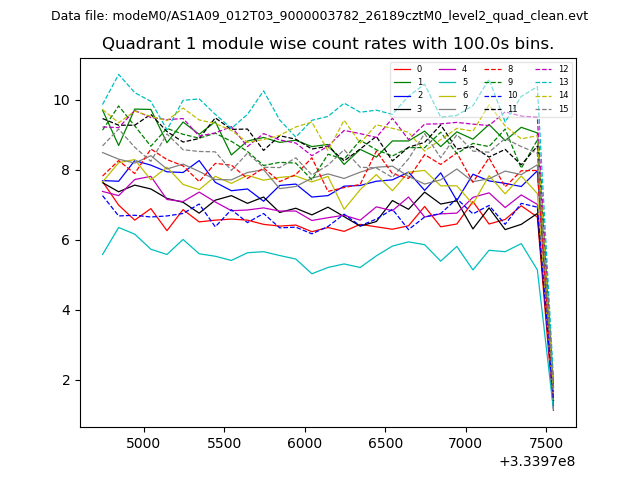
| Module-wise count rates for Quadrant B Data is divided into 100 sec bins |
 |
 |
| Module-wise count rates for Quadrant C Data is divided into 100 sec bins |
 |
 |
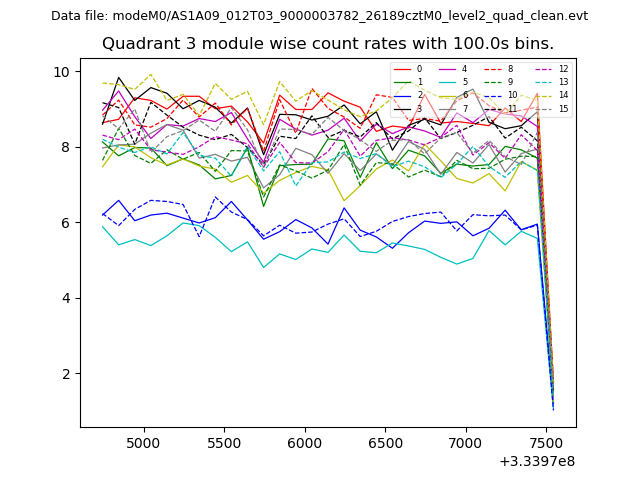
| Module-wise count rates for Quadrant D Data is divided into 100 sec bins |
 |
 |
| Parameter | Plot |
|---|---|
| CZT HV Monitor | 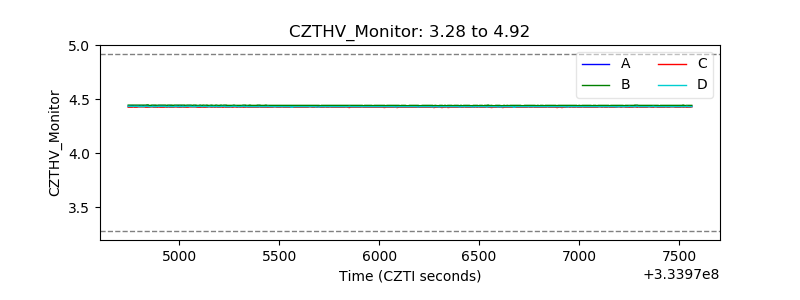 |
| D_VDD | 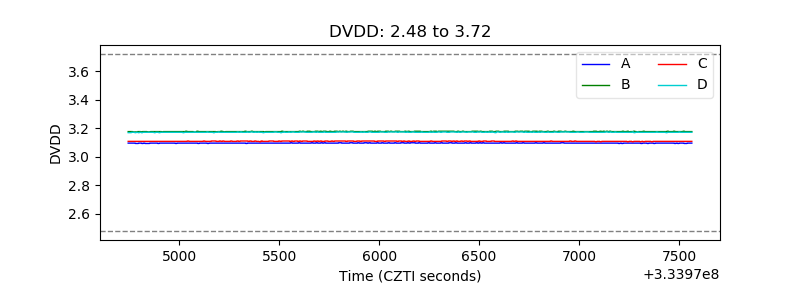 |
| Temperature 1 | 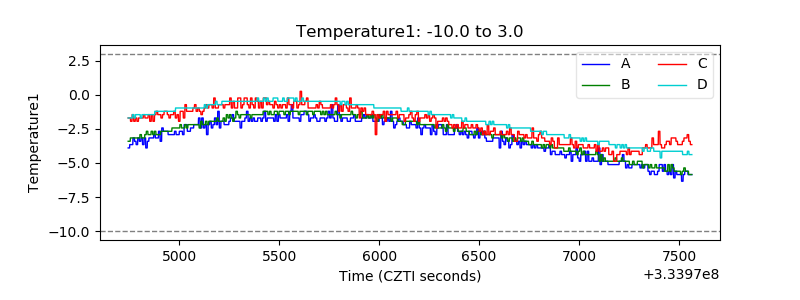 |
| Veto HV Monitor | 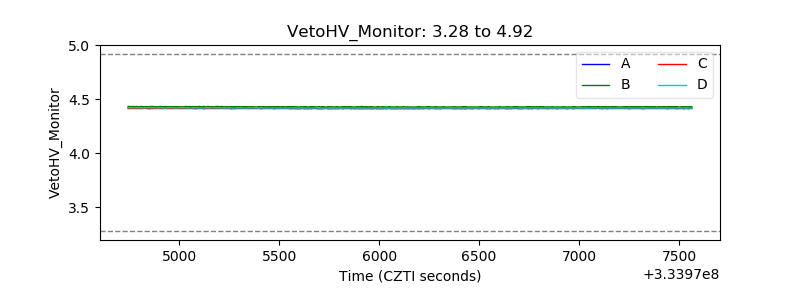 |
| Veto LLD | 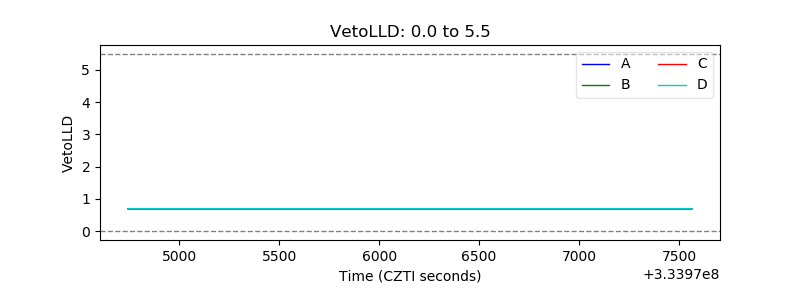 |
| Alpha Counter | 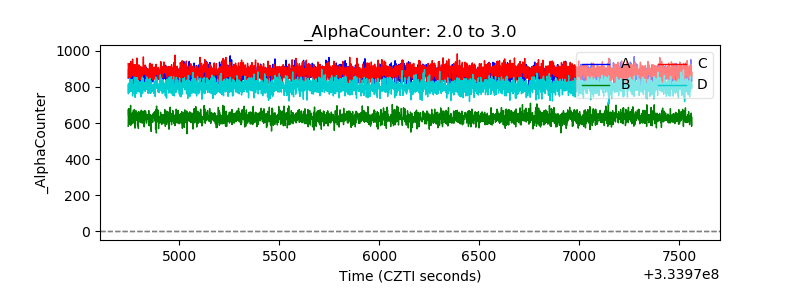 |
| _CPM_Rate | 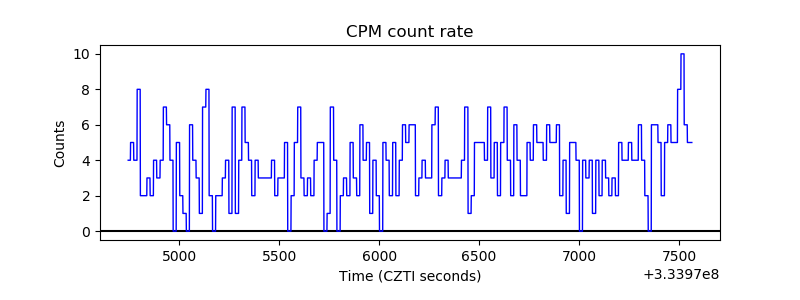 |
| CZT Counter | 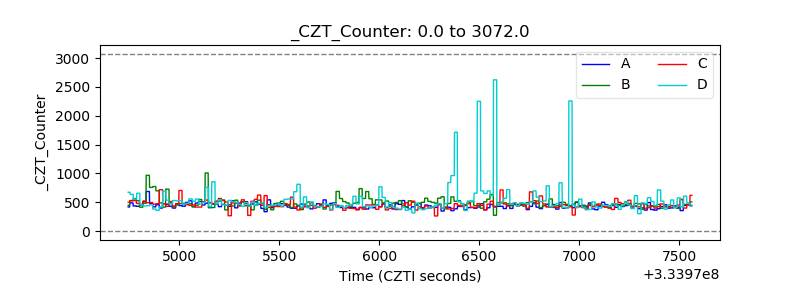 |
| +2.5 Volts monitor |  |
| +5 Volts monitor |  |
| _ROLL_ROT | 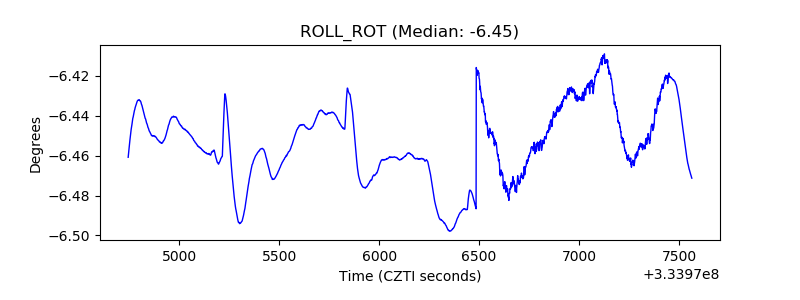 |
| _Roll_DEC | 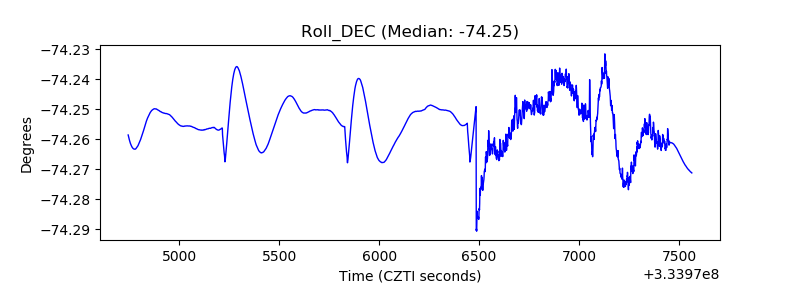 |
| _Roll_RA | 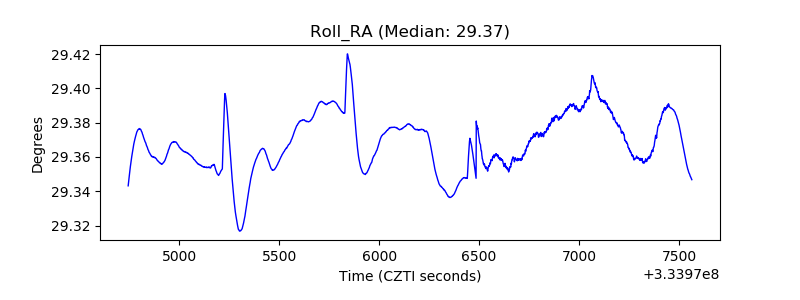 |
| Veto Counter | 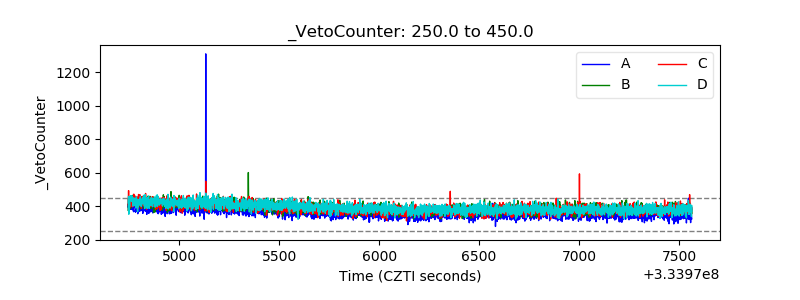 |