| Param | Original file | Final file |
|---|---|---|
| Filename | modeM0/AS1A09_012T04_9000003784cztM0_level2.fits | modeM0/AS1A09_012T04_9000003784cztM0_level2_quad_clean.evt |
| Size (bytes) | 102,983,040 | 126,383,040 |
| Size | 98.2 MB | 120.5 MB |
| Events in quadrant A | 620,268 | 790,223 |
| Events in quadrant B | 601,584 | 797,010 |
| Events in quadrant C | 615,148 | 778,637 |
| Events in quadrant D | 534,528 | 714,530 |
| Mode M9 | |||
|---|---|---|---|
| Quadrant | BADHDUFLAG | Total packets | Discarded packets |
| A | 0 | 5 | 0 |
| B | 0 | 5 | 0 |
| C | 0 | 5 | 0 |
| D | 0 | 5 | 0 |
| Mode SS | |||
|---|---|---|---|
| Quadrant | BADHDUFLAG | Total packets | Discarded packets |
| A | 0 | 220 | 0 |
| B | 0 | 220 | 0 |
| C | 0 | 220 | 0 |
| D | 0 | 220 | 0 |
| Mode M0 | |||
|---|---|---|---|
| Quadrant | BADHDUFLAG | Total packets | Discarded packets |
| A | 0 | 24244 | 0 |
| B | 0 | 22645 | 0 |
| C | 0 | 23645 | 0 |
| D | 0 | 31168 | 0 |
| Quadrant | Total seconds | Saturated seconds | Saturation percentage |
|---|---|---|---|
| A | 10787 | 353 | 3.272458% |
| B | 10787 | 303 | 2.808937% |
| C | 10787 | 316 | 2.929452% |
| D | 10787 | 642 | 5.951608% |
Noise dominated data is calculated using 1-second bins in cleaned event files. If a bin has >2000 counts, and if more than 50% of those come from <1% of pixels, then it is considered to be noise-dominated and hence unusable.
| Quadrant | # 1 sec bins | Bins with >0 counts | Bins with >2000 counts | High rate bins dominated by noise | Noise dominated (total time) | Noise dominated (detector-on time) | Marked lightcurve |
|---|---|---|---|---|---|---|---|
| A | 11336 | 10785 | 0 | 0 | 0.00% | 0.00% |  |
| B | 11337 | 10786 | 0 | 0 | 0.00% | 0.00% |  |
| C | 11337 | 10787 | 0 | 0 | 0.00% | 0.00% |  |
| D | 11336 | 10785 | 0 | 0 | 0.00% | 0.00% |  |
Top three noisy pixels from each quadrant. If the there are fewer than three noisy pixels in the level2.evt file, extra rows are filled as -1
| Pixel properties | Quadrant properties | ||||||
|---|---|---|---|---|---|---|---|
| Quadrant | DetID | PixID | Counts | Sigma | Mean | Median | Sigma |
| A | 0 | 29 | 520 | 8.66 | 161 | 151 | 42.6 |
| A | 0 | 30 | 478 | 7.67 | 161 | 151 | 42.6 |
| A | 7 | 110 | 475 | 7.6 | 161 | 151 | 42.6 |
| B | 2 | 9 | 505 | 10.66 | 158 | 151 | 33.2 |
| B | 3 | 17 | 420 | 8.1 | 158 | 151 | 33.2 |
| B | 2 | 8 | 415 | 7.95 | 158 | 151 | 33.2 |
| C | 12 | 241 | 470 | 7.47 | 162 | 151 | 42.7 |
| C | 3 | 187 | 422 | 6.35 | 162 | 151 | 42.7 |
| C | 12 | 249 | 417 | 6.23 | 162 | 151 | 42.7 |
| D | 3 | 14 | 407 | 6.32 | 152 | 138 | 42.5 |
| D | 15 | 46 | 373 | 5.52 | 152 | 138 | 42.5 |
| D | 6 | 231 | 372 | 5.5 | 152 | 138 | 42.5 |
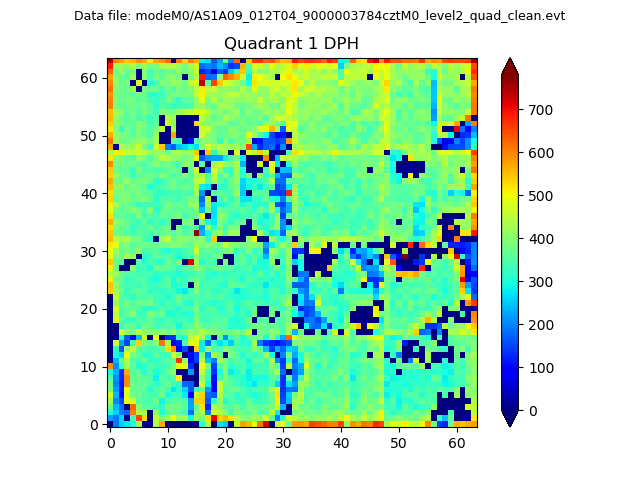
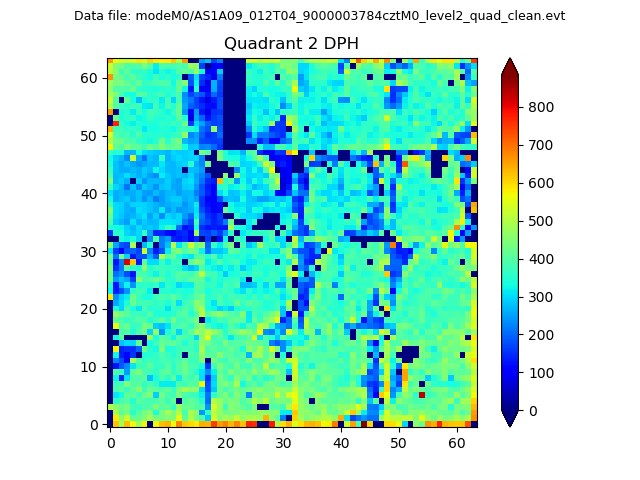
Histogram calculated using DETX and DETY for each event in the final _common_clean file
| Quadrant A |  |
 |
Quadrant B |
|---|---|---|---|
| Quadrant D |  |
 |
Quadrant C |
| Plot type | Count rate plots | Images |
|---|---|---|
| Comparison with Poisson distribution Blue bars denote a histogram of data divided into 1 sec bins. Red curve is a Poisson curve with rate = median count rate of data. |
 |
 |
| Quadrant-wise count rates Data is divided into 100 sec bins |
 |
|
| Module-wise count rates for Quadrant A Data is divided into 100 sec bins |
 |
 |
| Module-wise count rates for Quadrant B Data is divided into 100 sec bins |
 |
 |
| Module-wise count rates for Quadrant C Data is divided into 100 sec bins |
 |
 |
| Module-wise count rates for Quadrant D Data is divided into 100 sec bins |
 |
 |
| Parameter | Plot |
|---|---|
| CZT HV Monitor |  |
| D_VDD |  |
| Temperature 1 |  |
| Veto HV Monitor |  |
| Veto LLD |  |
| Alpha Counter |  |
| _CPM_Rate | 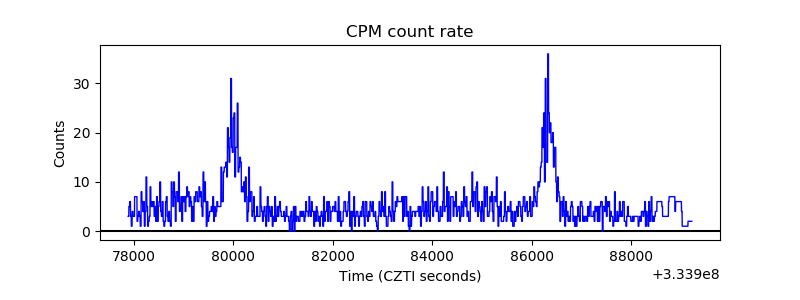 |
| CZT Counter |  |
| +2.5 Volts monitor |  |
| +5 Volts monitor |  |
| _ROLL_ROT |  |
| _Roll_DEC |  |
| _Roll_RA |  |
| Veto Counter |  |