| Param | Original file | Final file |
|---|---|---|
| Filename | modeM0/AS1A09_012T04_9000003784_26189cztM0_level2.evt | modeM0/AS1A09_012T04_9000003784_26189cztM0_level2_quad_clean.evt |
| Size (bytes) | 309,372,480 | 72,616,320 |
| Size | 295.0 MB | 69.3 MB |
| Events in quadrant A | 1,841,690 | 486,380 |
| Events in quadrant B | 1,922,517 | 497,279 |
| Events in quadrant C | 2,090,530 | 485,101 |
| Events in quadrant D | 3,258,192 | 464,524 |
| Mode M9 | |||
|---|---|---|---|
| Quadrant | BADHDUFLAG | Total packets | Discarded packets |
| A | 0 | 2 | 0 |
| B | 0 | 2 | 0 |
| C | 0 | 2 | 0 |
| D | 0 | 2 | 0 |
| Mode M0 | |||
|---|---|---|---|
| Quadrant | BADHDUFLAG | Total packets | Discarded packets |
| A | 0 | 7872 | 0 |
| B | 0 | 8032 | 0 |
| C | 0 | 8531 | 0 |
| D | 0 | 12225 | 0 |
| Quadrant | Total seconds | Saturated seconds | Saturation percentage |
|---|---|---|---|
| A | 3751 | 173 | 4.612103% |
| B | 3751 | 172 | 4.585444% |
| C | 3751 | 180 | 4.798720% |
| D | 3751 | 458 | 12.210077% |
Noise dominated data is calculated using 1-second bins in cleaned event files. If a bin has >2000 counts, and if more than 50% of those come from <1% of pixels, then it is considered to be noise-dominated and hence unusable.
| Quadrant | # 1 sec bins | Bins with >0 counts | Bins with >2000 counts | High rate bins dominated by noise | Noise dominated (total time) | Noise dominated (detector-on time) | Marked lightcurve |
|---|---|---|---|---|---|---|---|
| A | 4026 | 3752 | 0 | 0 | 0.00% | 0.00% | 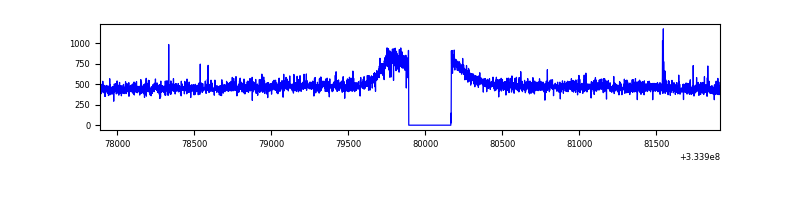 |
| B | 4026 | 3752 | 0 | 0 | 0.00% | 0.00% | 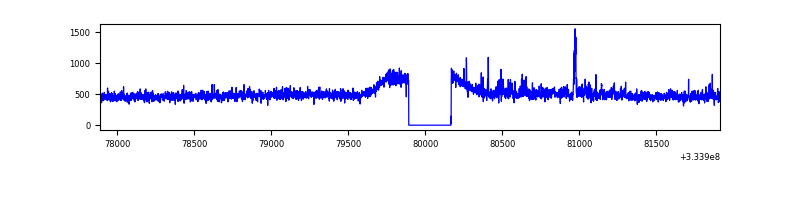 |
| C | 4026 | 3752 | 0 | 0 | 0.00% | 0.00% | 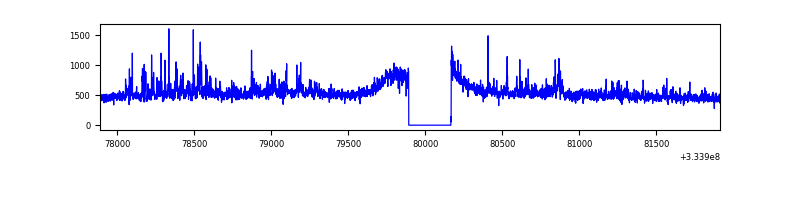 |
| D | 4026 | 3752 | 324 | 324 | 8.05% | 8.64% | 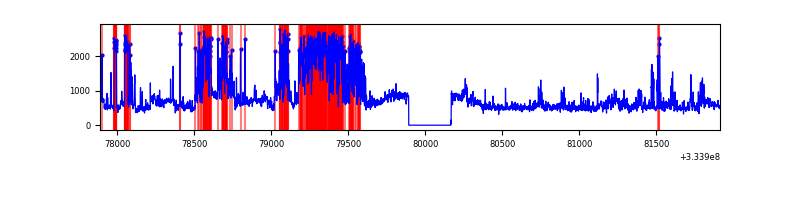 |
Top three noisy pixels from each quadrant. If the there are fewer than three noisy pixels in the level2.evt file, extra rows are filled as -1
| Pixel properties | Quadrant properties | ||||||
|---|---|---|---|---|---|---|---|
| Quadrant | DetID | PixID | Counts | Sigma | Mean | Median | Sigma |
| A | 0 | 13 | 7496 | 72.54 | 475 | 462 | 97.0 |
| A | 13 | 254 | 5821 | 55.26 | 475 | 462 | 97.0 |
| A | 3 | 137 | 4541 | 42.06 | 475 | 462 | 97.0 |
| B | 0 | 230 | 33808 | 361.48 | 473 | 458 | 92.3 |
| B | 0 | 190 | 28903 | 308.31 | 473 | 458 | 92.3 |
| B | 12 | 111 | 11071 | 115.03 | 473 | 458 | 92.3 |
| C | 2 | 16 | 133935 | 1216.56 | 465 | 466 | 109.7 |
| C | 14 | 238 | 71936 | 651.44 | 465 | 466 | 109.7 |
| C | 3 | 233 | 65837 | 595.85 | 465 | 466 | 109.7 |
| D | 12 | 233 | 821515 | 7441.43 | 463 | 450 | 110.3 |
| D | 1 | 52 | 672168 | 6087.88 | 463 | 450 | 110.3 |
| D | 2 | 234 | 15919 | 140.2 | 463 | 450 | 110.3 |
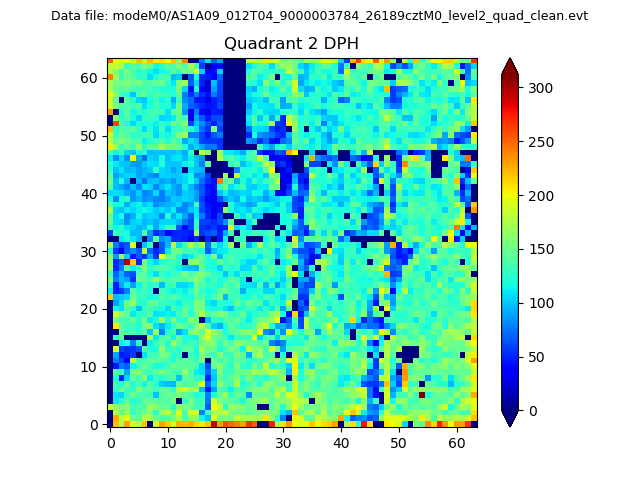
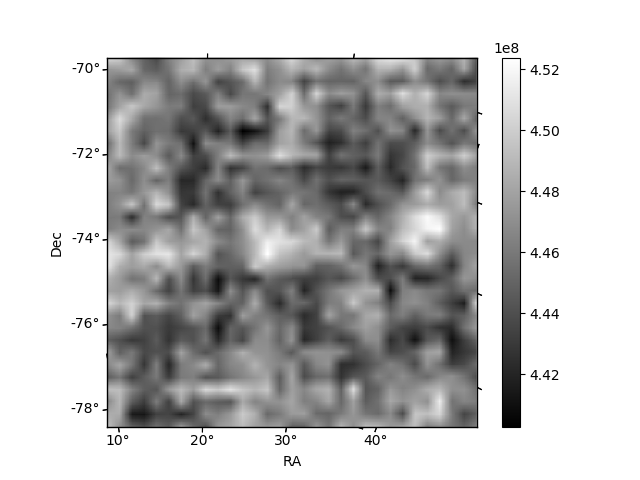
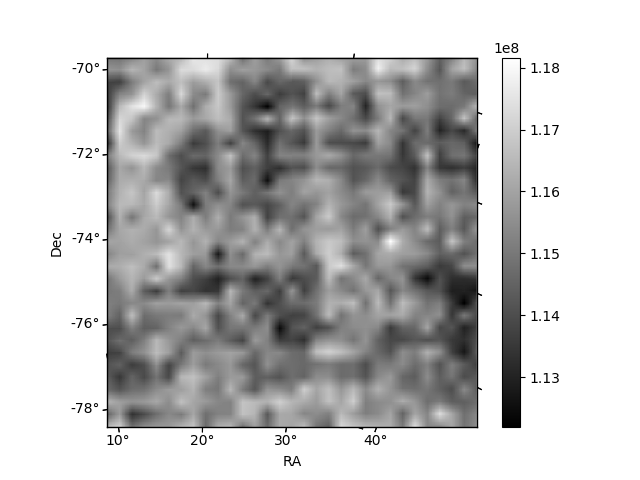
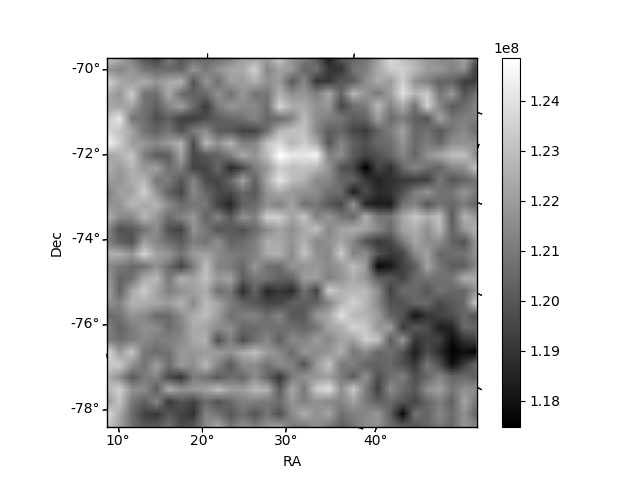
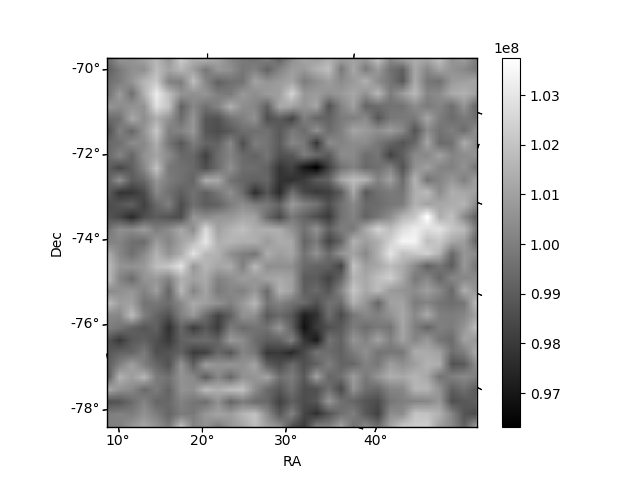
Histogram calculated using DETX and DETY for each event in the final _common_clean file
| Quadrant A | 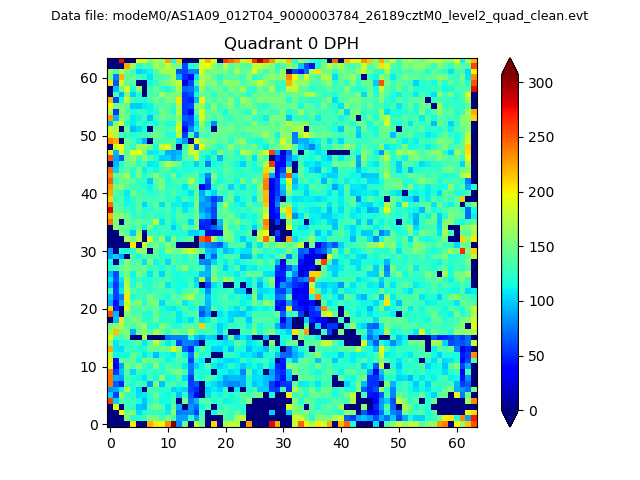 |
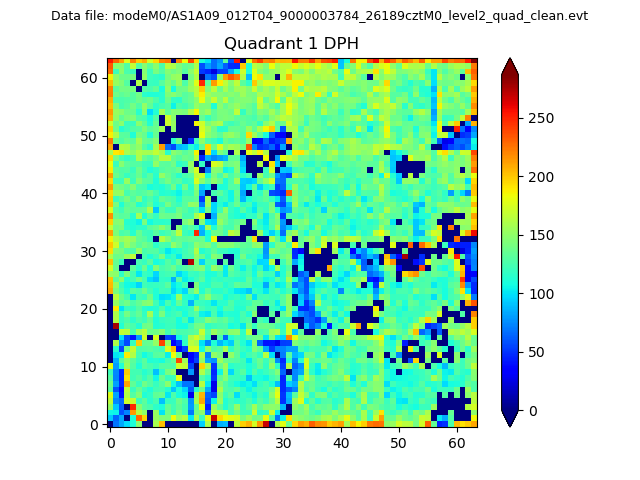 |
Quadrant B |
|---|---|---|---|
| Quadrant D | 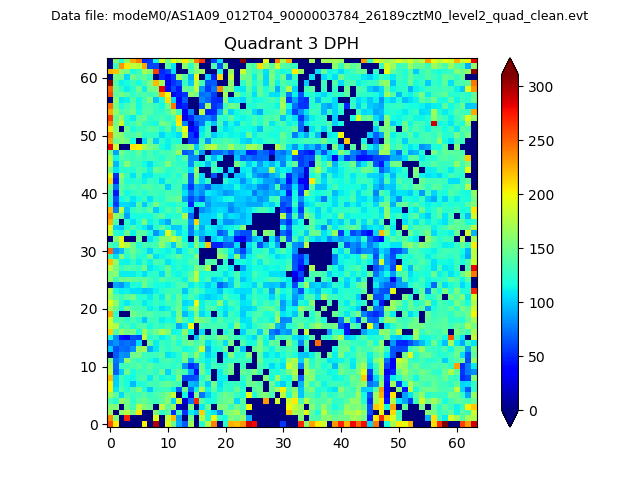 |
 |
Quadrant C |
| Plot type | Count rate plots | Images |
|---|---|---|
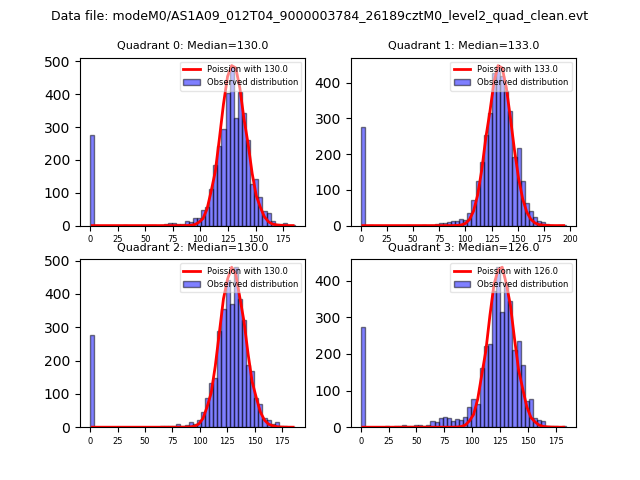
| Comparison with Poisson distribution Blue bars denote a histogram of data divided into 1 sec bins. Red curve is a Poisson curve with rate = median count rate of data. |
 |
 |
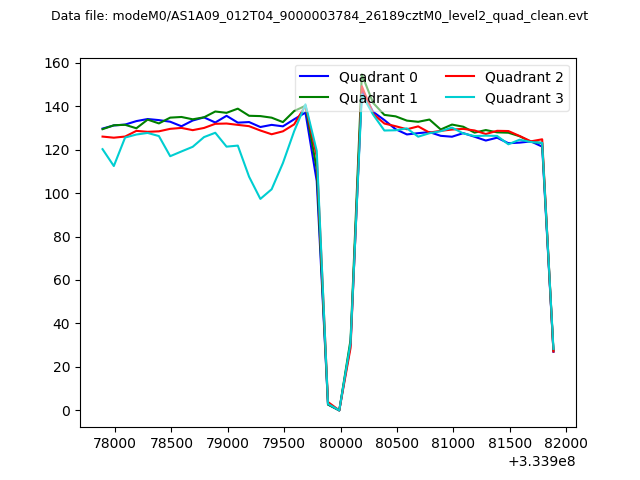
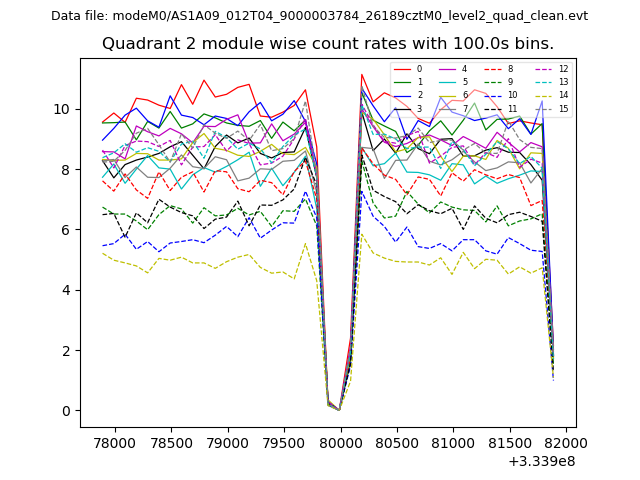
| Quadrant-wise count rates Data is divided into 100 sec bins |
 |
|
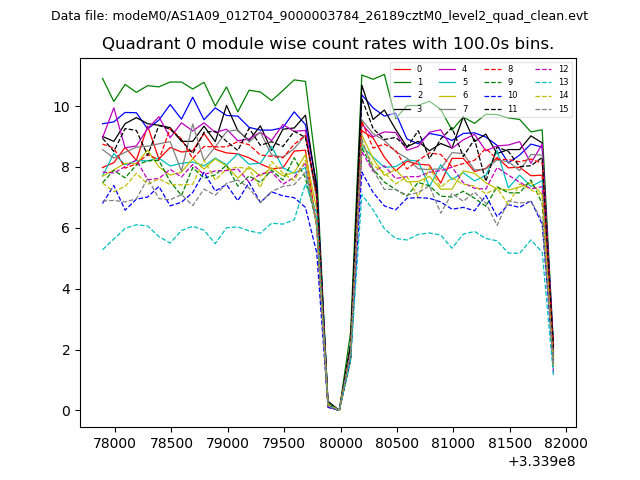
| Module-wise count rates for Quadrant A Data is divided into 100 sec bins |
 |
 |
| Module-wise count rates for Quadrant B Data is divided into 100 sec bins |
 |
 |
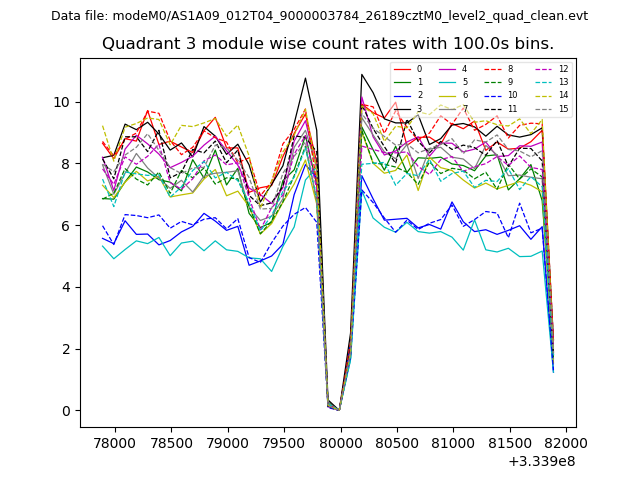
| Module-wise count rates for Quadrant C Data is divided into 100 sec bins |
 |
 |
| Module-wise count rates for Quadrant D Data is divided into 100 sec bins |
 |
 |
| Parameter | Plot |
|---|---|
| CZT HV Monitor |  |
| D_VDD | 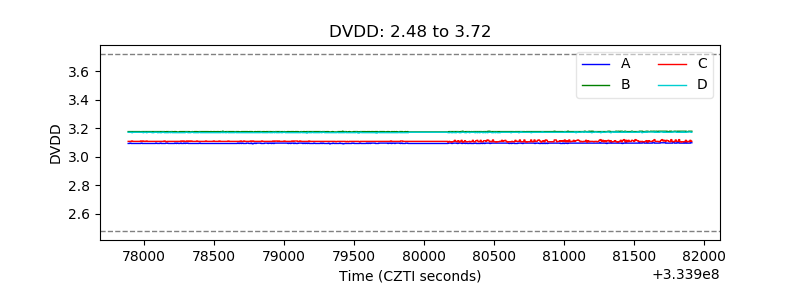 |
| Temperature 1 | 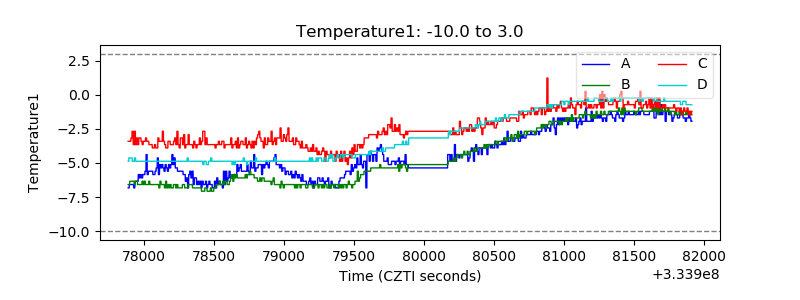 |
| Veto HV Monitor | 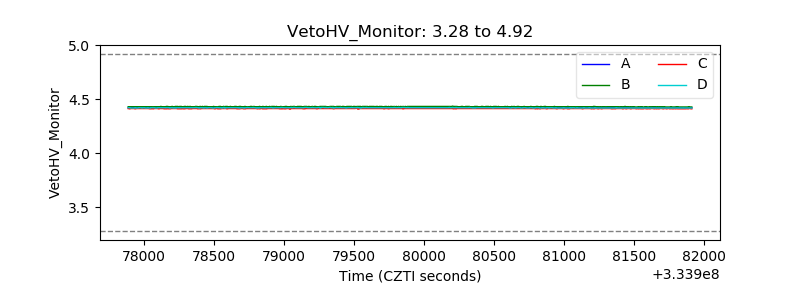 |
| Veto LLD | 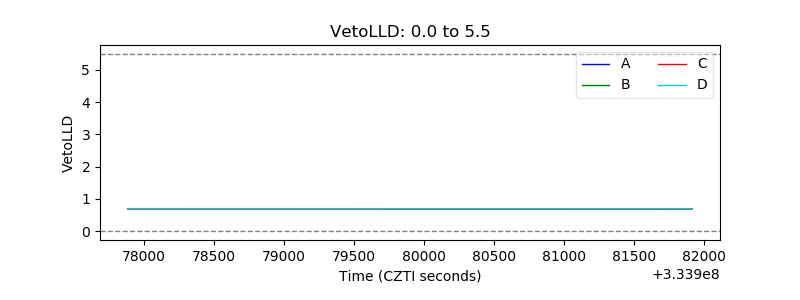 |
| Alpha Counter | 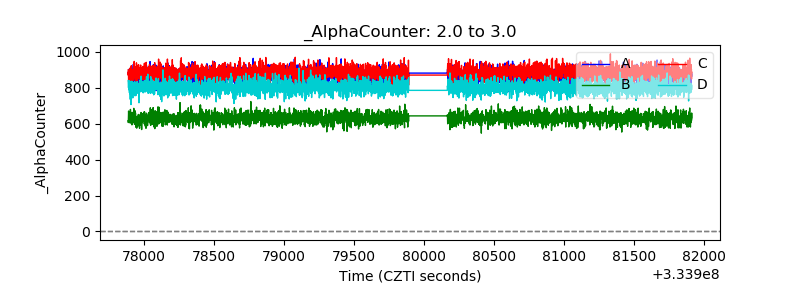 |
| _CPM_Rate | 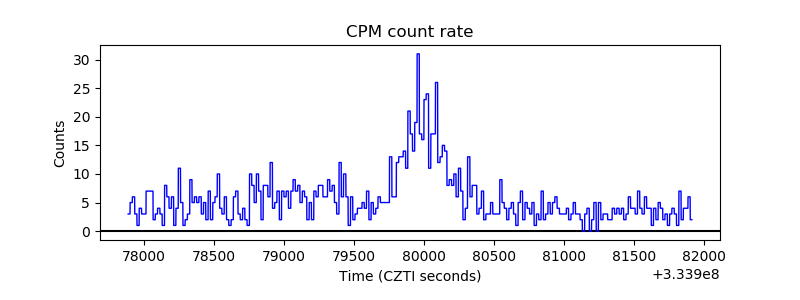 |
| CZT Counter | 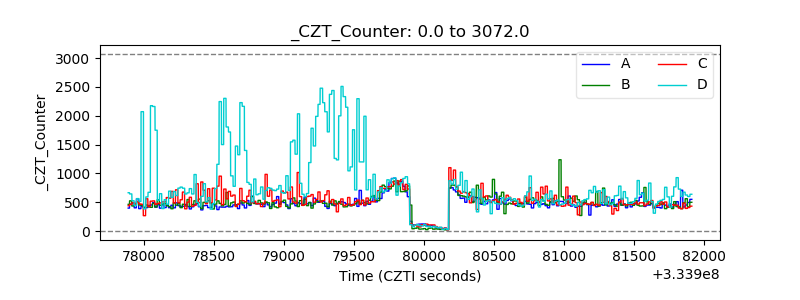 |
| +2.5 Volts monitor | 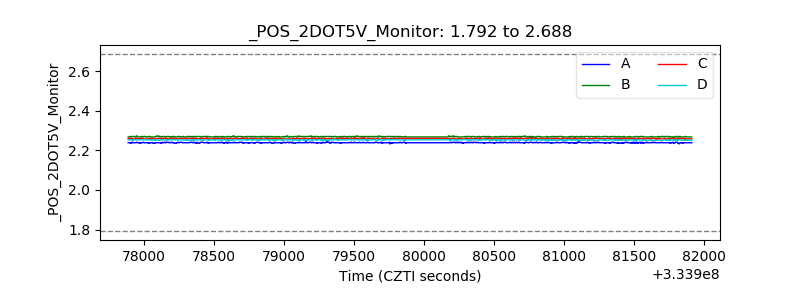 |
| +5 Volts monitor |  |
| _ROLL_ROT | 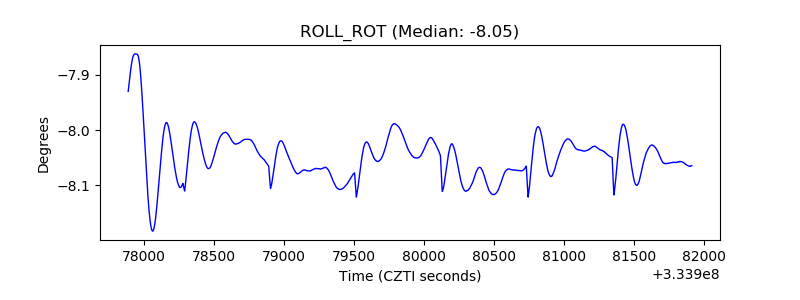 |
| _Roll_DEC | 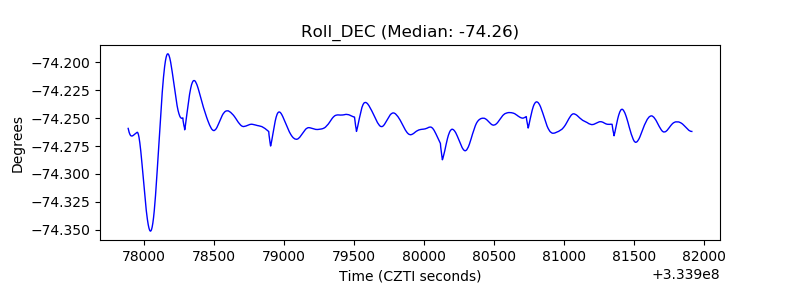 |
| _Roll_RA | 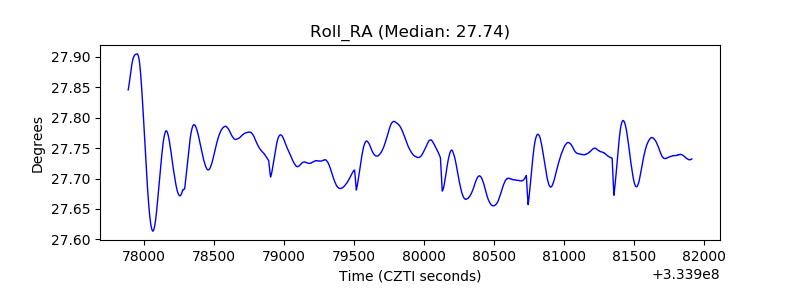 |
| Veto Counter | 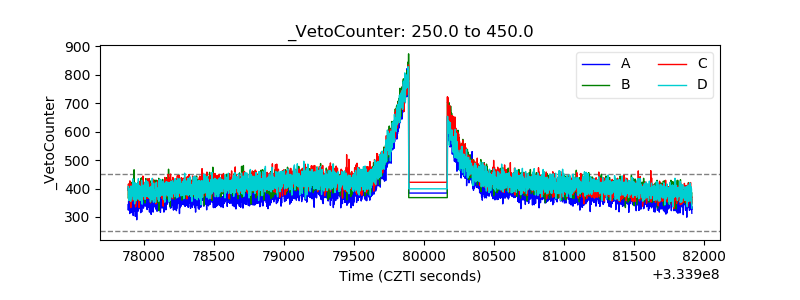 |