| Param | Original file | Final file |
|---|---|---|
| Filename | modeM0/AS1A09_012T04_9000003784_26190cztM0_level2.evt | modeM0/AS1A09_012T04_9000003784_26190cztM0_level2_quad_clean.evt |
| Size (bytes) | 527,518,080 | 136,647,360 |
| Size | 503.1 MB | 130.3 MB |
| Events in quadrant A | 3,759,222 | 908,817 |
| Events in quadrant B | 3,456,466 | 924,820 |
| Events in quadrant C | 3,678,518 | 909,691 |
| Events in quadrant D | 4,594,914 | 896,087 |
| Mode M9 | |||
|---|---|---|---|
| Quadrant | BADHDUFLAG | Total packets | Discarded packets |
| A | 0 | 3 | 0 |
| B | 0 | 3 | 0 |
| C | 0 | 3 | 0 |
| D | 0 | 3 | 0 |
| Mode M0 | |||
|---|---|---|---|
| Quadrant | BADHDUFLAG | Total packets | Discarded packets |
| A | 0 | 15896 | 0 |
| B | 0 | 14877 | 0 |
| C | 0 | 15504 | 0 |
| D | 0 | 18596 | 0 |
| Quadrant | Total seconds | Saturated seconds | Saturation percentage |
|---|---|---|---|
| A | 7175 | 164 | 2.285714% |
| B | 7176 | 132 | 1.839465% |
| C | 7176 | 140 | 1.950948% |
| D | 7176 | 153 | 2.132107% |
Noise dominated data is calculated using 1-second bins in cleaned event files. If a bin has >2000 counts, and if more than 50% of those come from <1% of pixels, then it is considered to be noise-dominated and hence unusable.
| Quadrant | # 1 sec bins | Bins with >0 counts | Bins with >2000 counts | High rate bins dominated by noise | Noise dominated (total time) | Noise dominated (detector-on time) | Marked lightcurve |
|---|---|---|---|---|---|---|---|
| A | 7450 | 7176 | 47 | 47 | 0.63% | 0.65% | 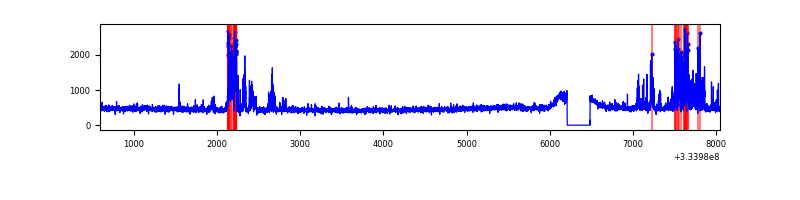 |
| B | 7451 | 7177 | 0 | 0 | 0.00% | 0.00% | 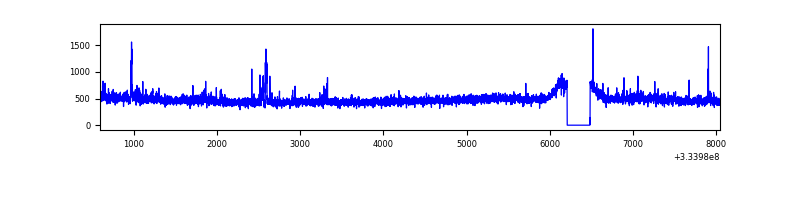 |
| C | 7451 | 7177 | 0 | 0 | 0.00% | 0.00% | 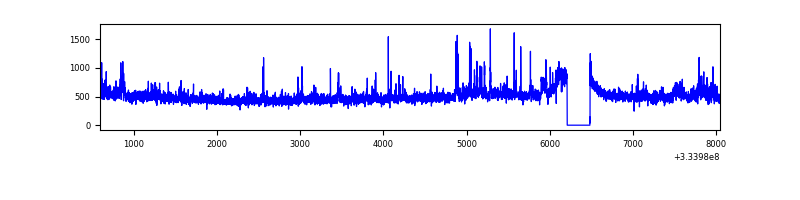 |
| D | 7451 | 7177 | 43 | 43 | 0.58% | 0.60% | 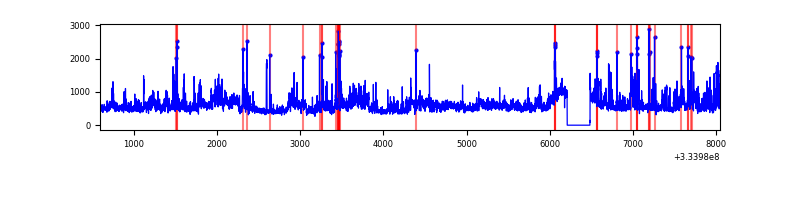 |
Top three noisy pixels from each quadrant. If the there are fewer than three noisy pixels in the level2.evt file, extra rows are filled as -1
| Pixel properties | Quadrant properties | ||||||
|---|---|---|---|---|---|---|---|
| Quadrant | DetID | PixID | Counts | Sigma | Mean | Median | Sigma |
| A | 0 | 13 | 447003 | 2598.48 | 858 | 839 | 171.7 |
| A | 13 | 254 | 11645 | 62.93 | 858 | 839 | 171.7 |
| A | 3 | 137 | 8126 | 42.44 | 858 | 839 | 171.7 |
| B | 0 | 190 | 77843 | 468.8 | 853 | 829 | 164.3 |
| B | 0 | 230 | 26388 | 155.58 | 853 | 829 | 164.3 |
| B | 12 | 111 | 19603 | 114.28 | 853 | 829 | 164.3 |
| C | 2 | 16 | 164025 | 842.54 | 832 | 835 | 193.7 |
| C | 14 | 238 | 132995 | 682.33 | 832 | 835 | 193.7 |
| C | 3 | 233 | 125572 | 644.01 | 832 | 835 | 193.7 |
| D | 1 | 52 | 1167982 | 5831.61 | 843 | 822 | 200.1 |
| D | 13 | 168 | 99968 | 495.37 | 843 | 822 | 200.1 |
| D | 12 | 233 | 82454 | 407.87 | 843 | 822 | 200.1 |
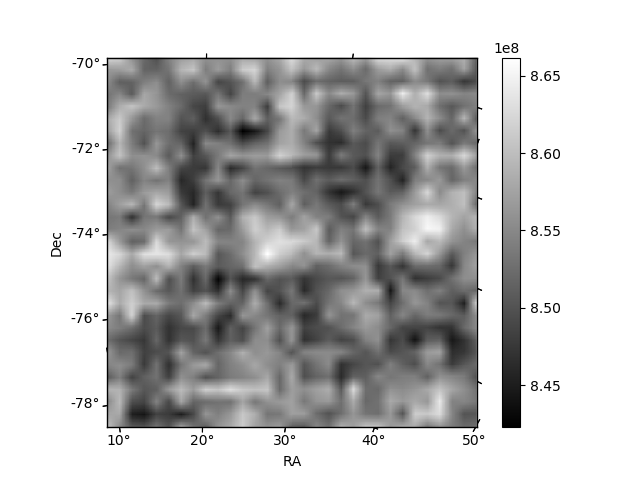
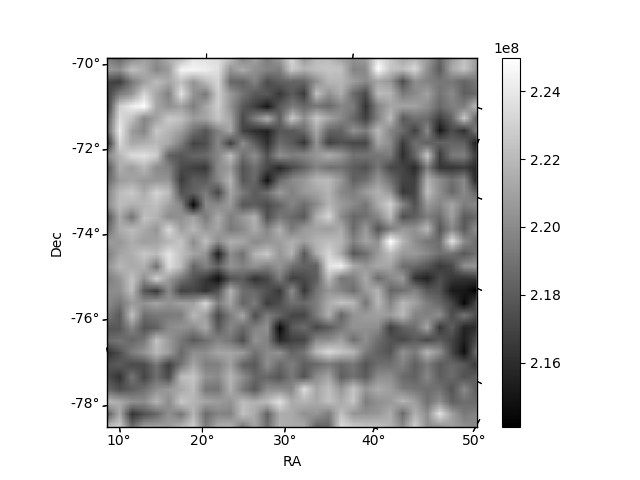
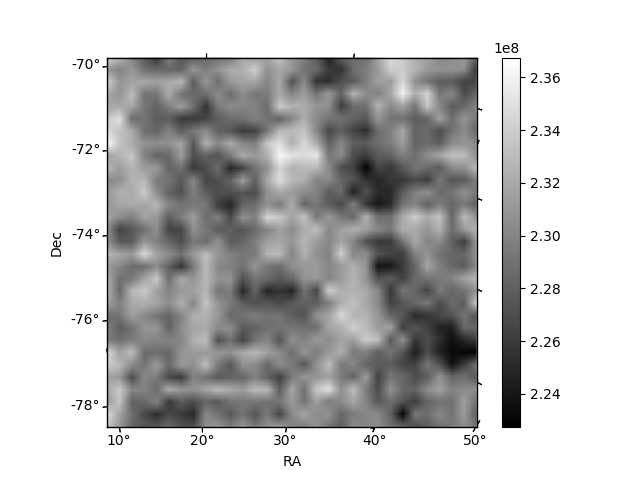
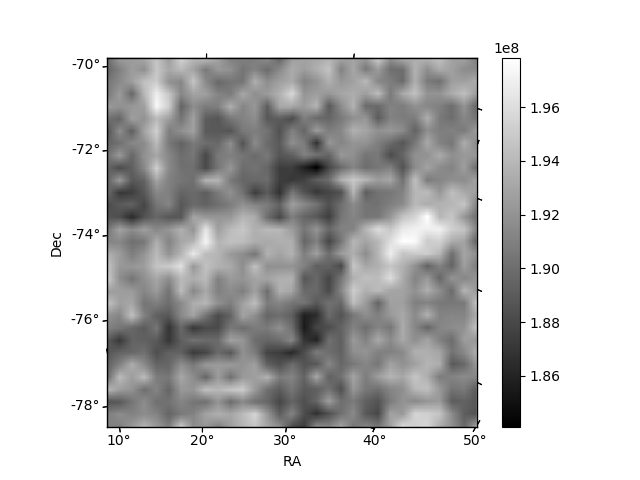
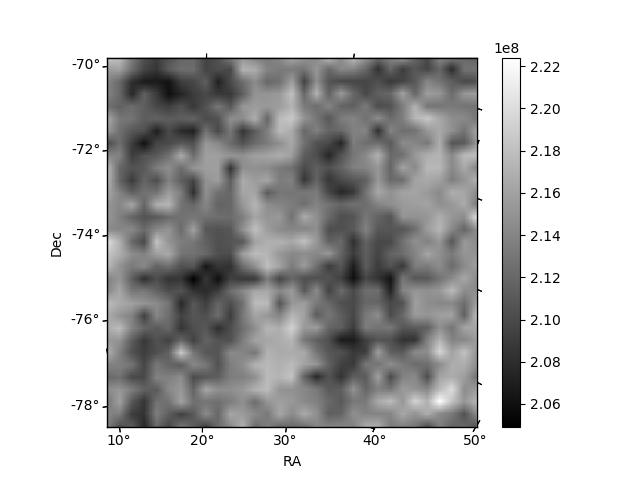
Histogram calculated using DETX and DETY for each event in the final _common_clean file
| Quadrant A | 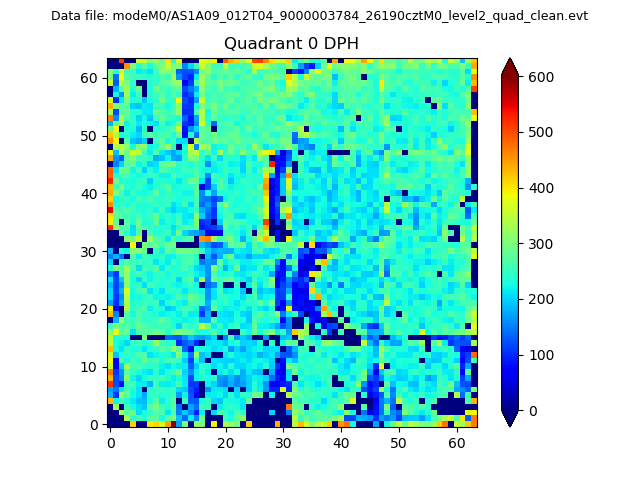 |
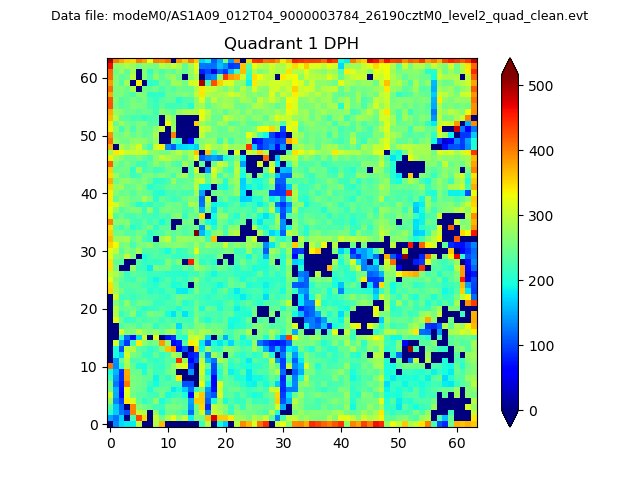 |
Quadrant B |
|---|---|---|---|
| Quadrant D |  |
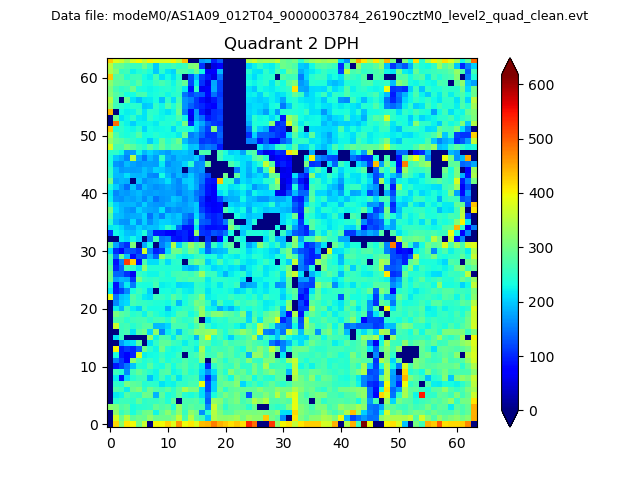 |
Quadrant C |
| Plot type | Count rate plots | Images |
|---|---|---|
| Comparison with Poisson distribution Blue bars denote a histogram of data divided into 1 sec bins. Red curve is a Poisson curve with rate = median count rate of data. |
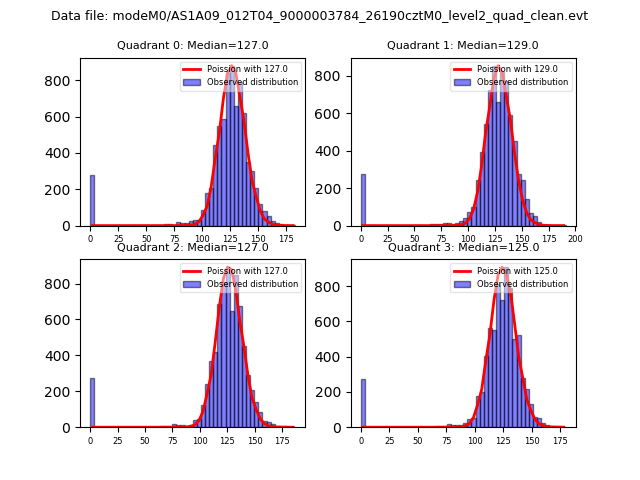 |
 |
| Quadrant-wise count rates Data is divided into 100 sec bins |
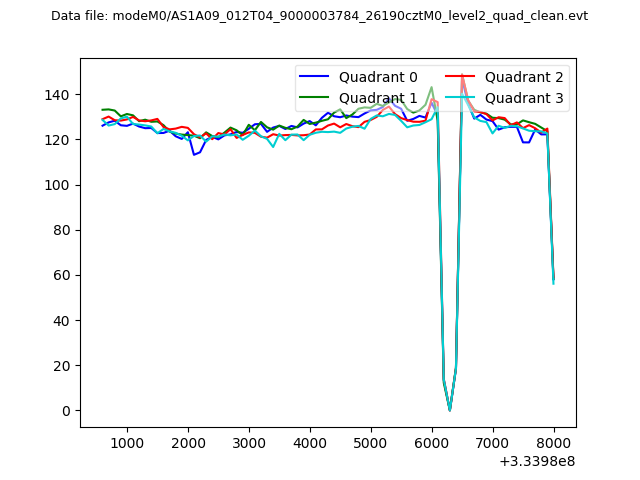 |
|
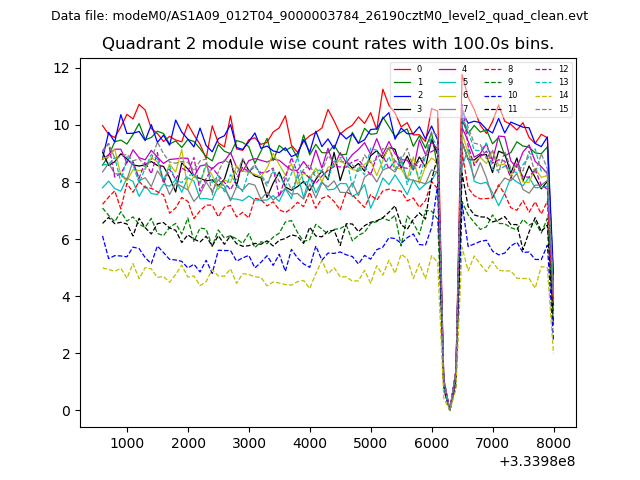
| Module-wise count rates for Quadrant A Data is divided into 100 sec bins |
 |
 |
| Module-wise count rates for Quadrant B Data is divided into 100 sec bins |
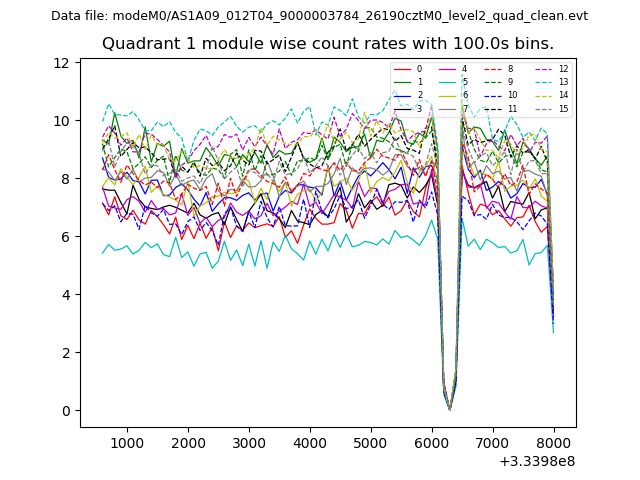 |
 |
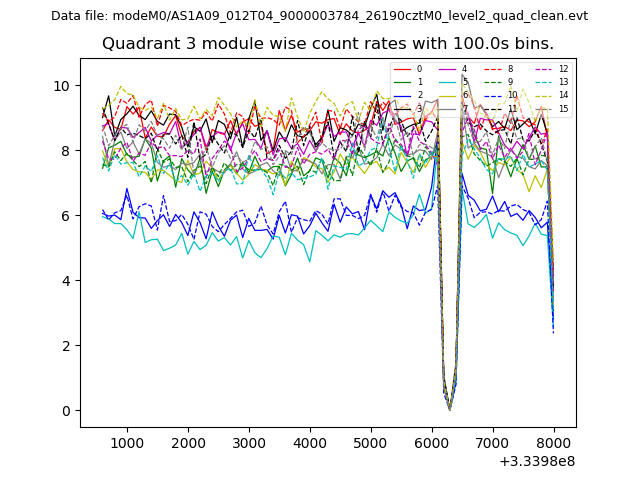
| Module-wise count rates for Quadrant C Data is divided into 100 sec bins |
 |
 |
| Module-wise count rates for Quadrant D Data is divided into 100 sec bins |
 |
 |
| Parameter | Plot |
|---|---|
| CZT HV Monitor | 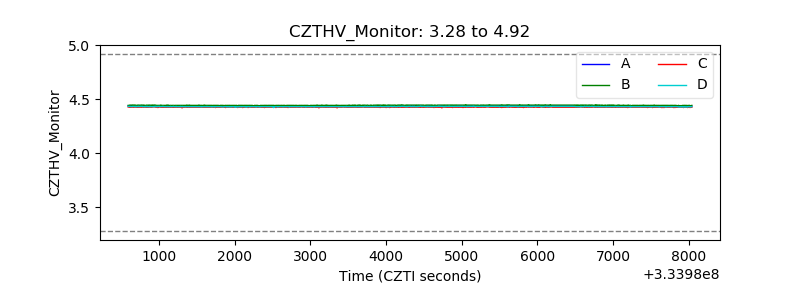 |
| D_VDD |  |
| Temperature 1 | 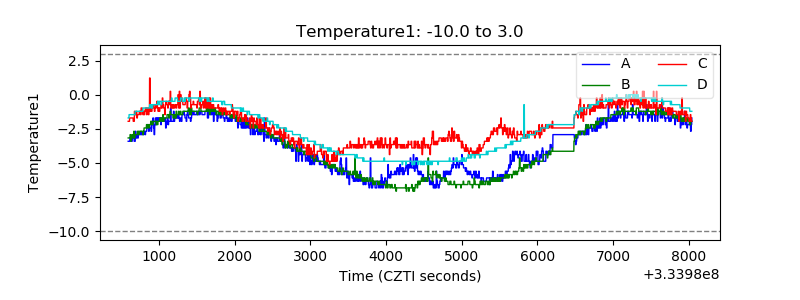 |
| Veto HV Monitor | 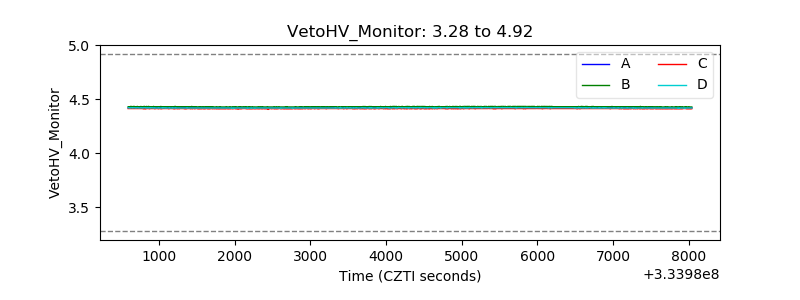 |
| Veto LLD | 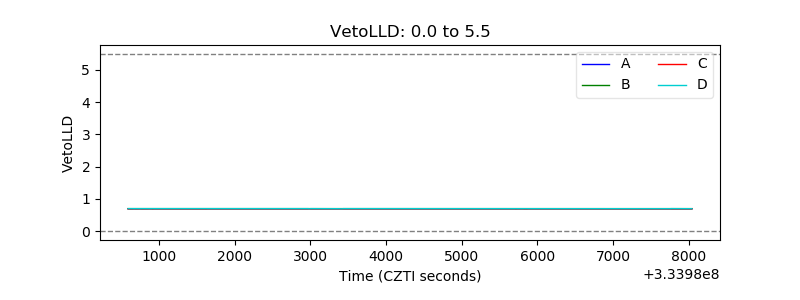 |
| Alpha Counter | 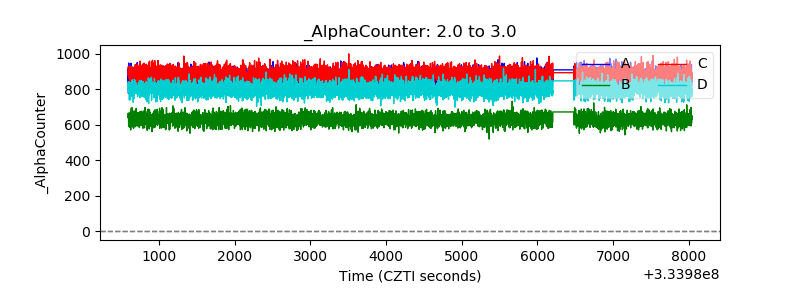 |
| _CPM_Rate | 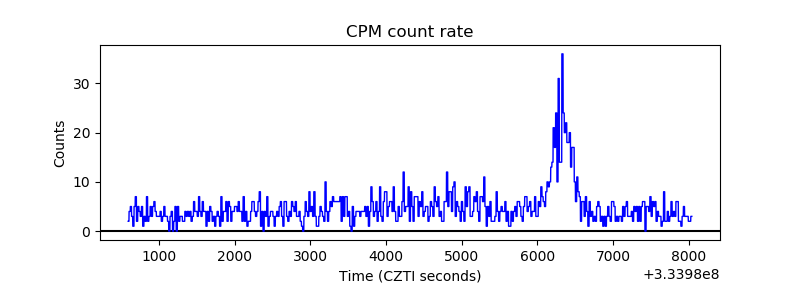 |
| CZT Counter | 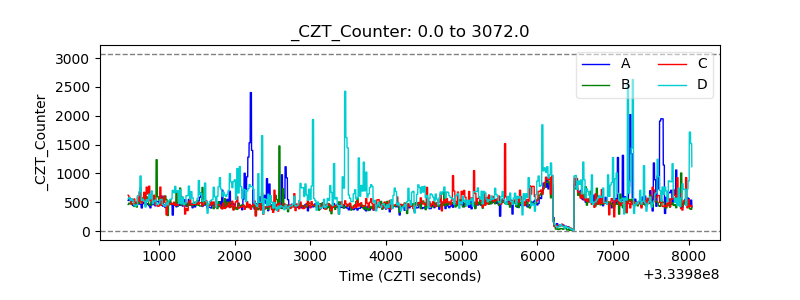 |
| +2.5 Volts monitor |  |
| +5 Volts monitor |  |
| _ROLL_ROT |  |
| _Roll_DEC | 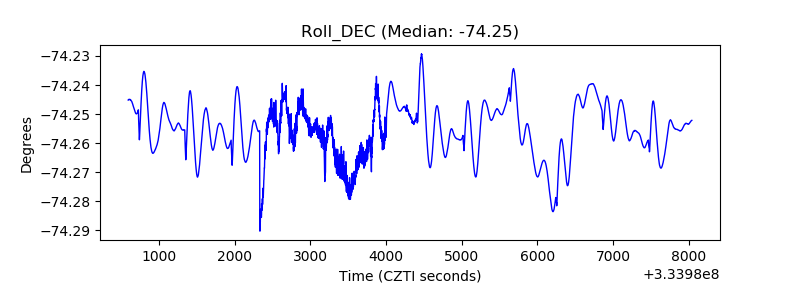 |
| _Roll_RA | 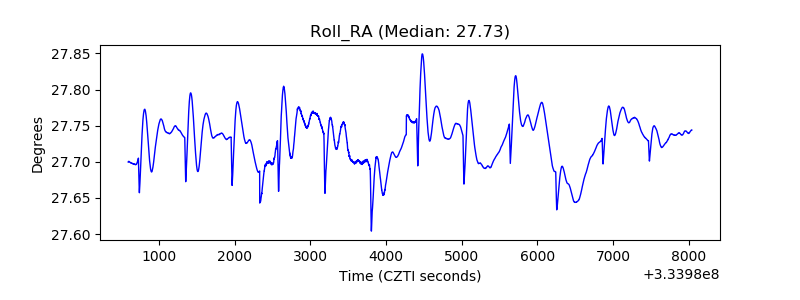 |
| Veto Counter |  |