| Param | Original file | Final file |
|---|---|---|
| Filename | modeM0/AS1A09_012T04_9000003784_26193cztM0_level2.evt | modeM0/AS1A09_012T04_9000003784_26193cztM0_level2_quad_clean.evt |
| Size (bytes) | 163,604,160 | 37,615,680 |
| Size | 156.0 MB | 35.9 MB |
| Events in quadrant A | 1,376,983 | 246,096 |
| Events in quadrant B | 947,266 | 252,001 |
| Events in quadrant C | 979,119 | 249,438 |
| Events in quadrant D | 1,511,075 | 243,724 |
| Mode M0 | |||
|---|---|---|---|
| Quadrant | BADHDUFLAG | Total packets | Discarded packets |
| A | 0 | 5462 | 0 |
| B | 0 | 4211 | 0 |
| C | 0 | 4279 | 0 |
| D | 0 | 5887 | 0 |
| Quadrant | Total seconds | Saturated seconds | Saturation percentage |
|---|---|---|---|
| A | 2032 | 53 | 2.608268% |
| B | 2033 | 4 | 0.196754% |
| C | 2033 | 3 | 0.147565% |
| D | 2033 | 47 | 2.311854% |
Noise dominated data is calculated using 1-second bins in cleaned event files. If a bin has >2000 counts, and if more than 50% of those come from <1% of pixels, then it is considered to be noise-dominated and hence unusable.
| Quadrant | # 1 sec bins | Bins with >0 counts | Bins with >2000 counts | High rate bins dominated by noise | Noise dominated (total time) | Noise dominated (detector-on time) | Marked lightcurve |
|---|---|---|---|---|---|---|---|
| A | 2032 | 2032 | 40 | 40 | 1.97% | 1.97% | 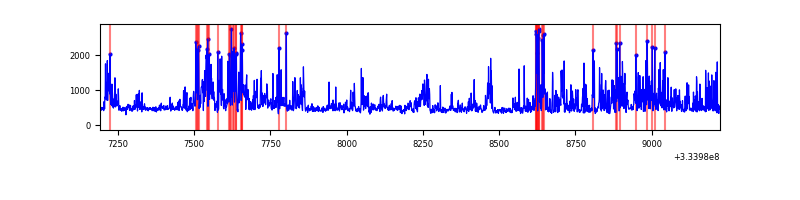 |
| B | 2033 | 2033 | 0 | 0 | 0.00% | 0.00% | 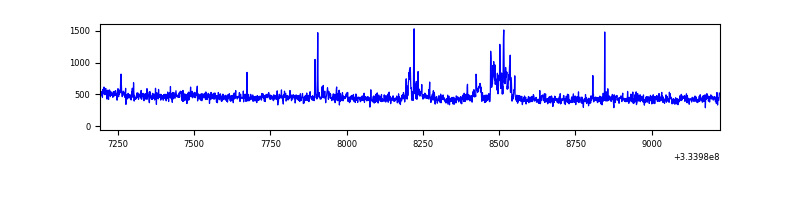 |
| C | 2033 | 2033 | 0 | 0 | 0.00% | 0.00% | 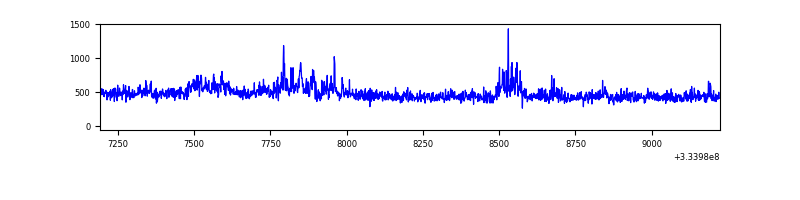 |
| D | 2033 | 2033 | 48 | 48 | 2.36% | 2.36% | 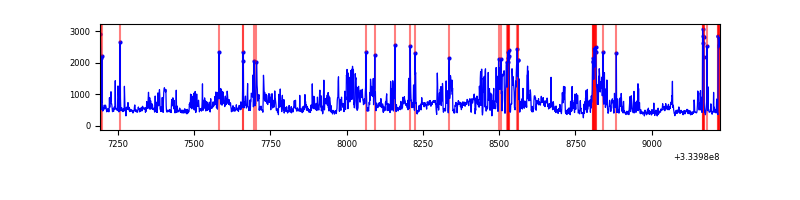 |
Top three noisy pixels from each quadrant. If the there are fewer than three noisy pixels in the level2.evt file, extra rows are filled as -1
| Pixel properties | Quadrant properties | ||||||
|---|---|---|---|---|---|---|---|
| Quadrant | DetID | PixID | Counts | Sigma | Mean | Median | Sigma |
| A | 0 | 13 | 501005 | 10428.32 | 227 | 221 | 48.0 |
| A | 13 | 254 | 3101 | 59.96 | 227 | 221 | 48.0 |
| A | 3 | 137 | 2100 | 39.12 | 227 | 221 | 48.0 |
| B | 0 | 190 | 44322 | 979.89 | 226 | 221 | 45.0 |
| B | 5 | 172 | 18436 | 404.72 | 226 | 221 | 45.0 |
| B | 12 | 111 | 4958 | 105.25 | 226 | 221 | 45.0 |
| C | 3 | 233 | 99691 | 1934.54 | 215 | 216 | 51.4 |
| C | 14 | 238 | 34997 | 676.4 | 215 | 216 | 51.4 |
| C | 2 | 16 | 5566 | 104.04 | 215 | 216 | 51.4 |
| D | 1 | 52 | 611305 | 11325.31 | 217 | 211 | 54.0 |
| D | 12 | 233 | 48020 | 886.04 | 217 | 211 | 54.0 |
| D | 2 | 234 | 10118 | 183.6 | 217 | 211 | 54.0 |
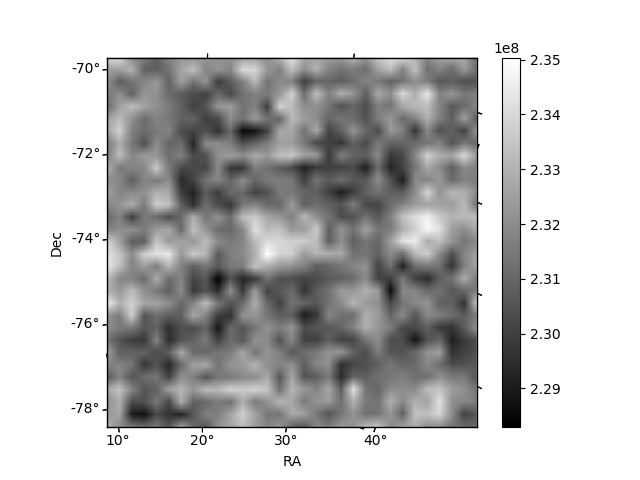
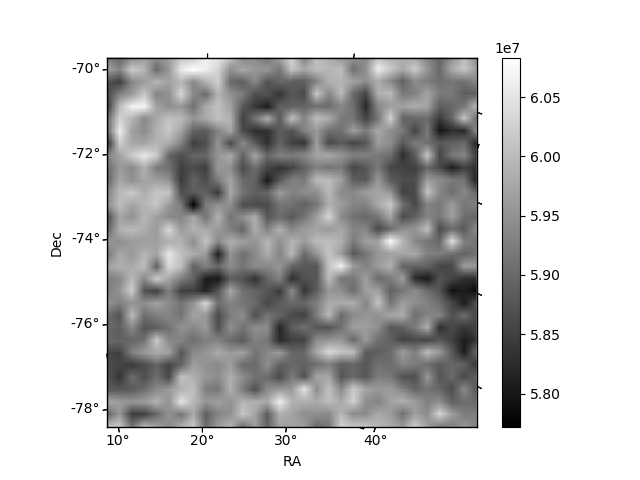
Histogram calculated using DETX and DETY for each event in the final _common_clean file
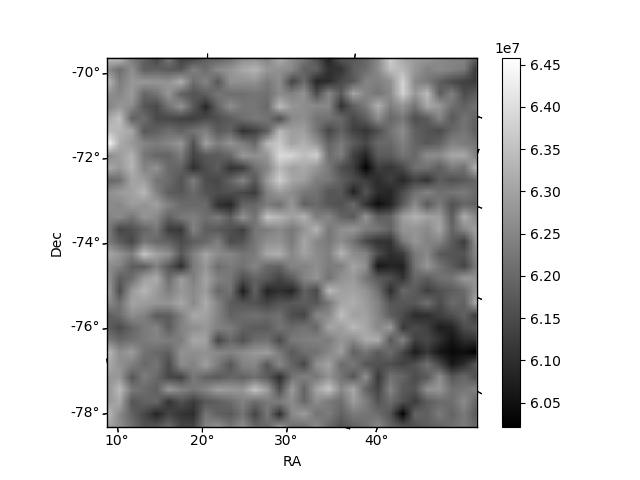
| Quadrant A | 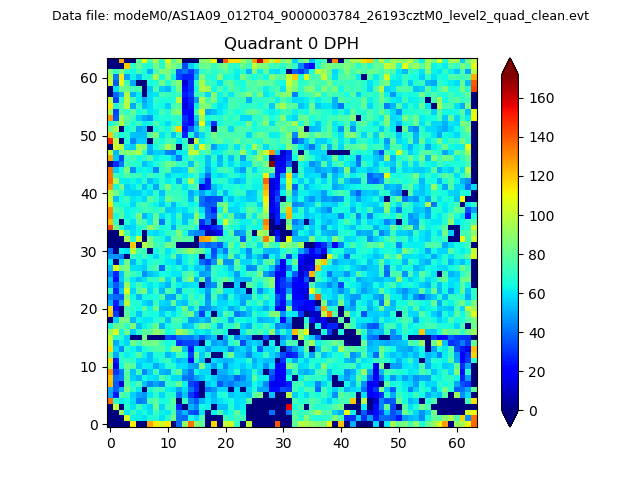 |
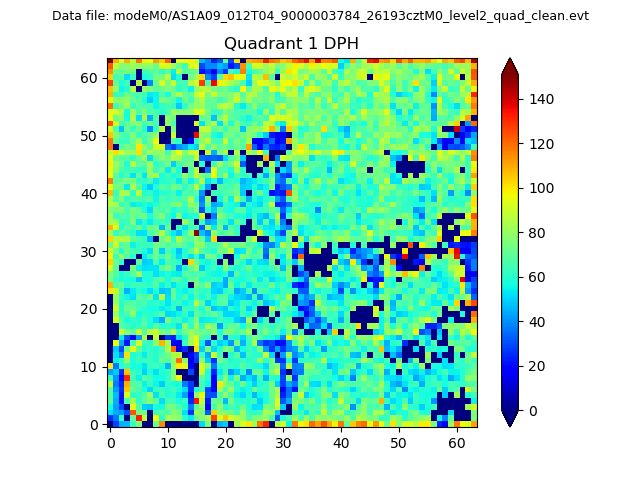 |
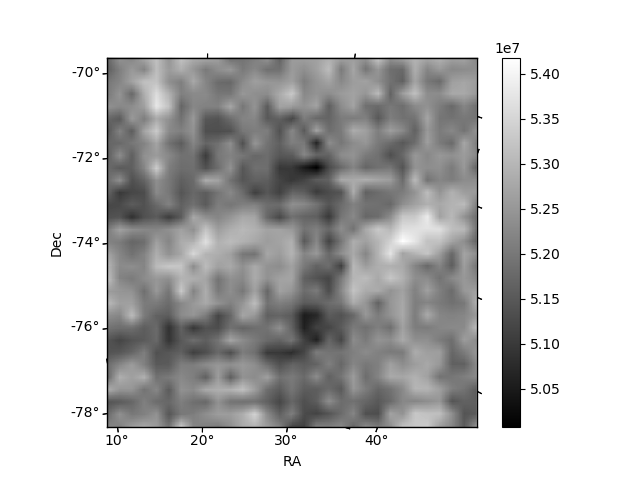
Quadrant B |
|---|---|---|---|
| Quadrant D | 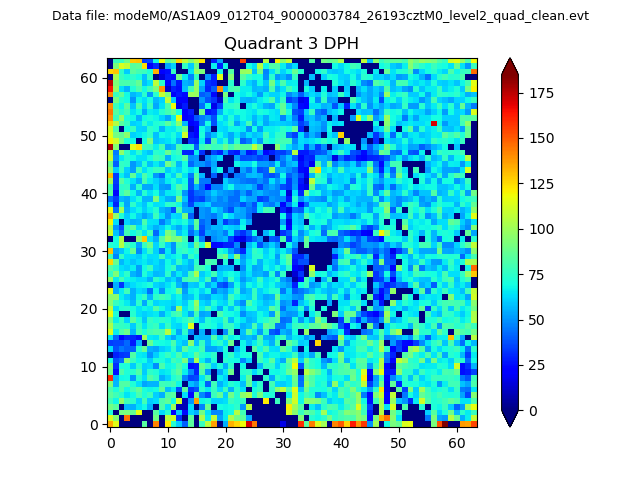 |
 |
Quadrant C |
| Plot type | Count rate plots | Images |
|---|---|---|
| Comparison with Poisson distribution Blue bars denote a histogram of data divided into 1 sec bins. Red curve is a Poisson curve with rate = median count rate of data. |
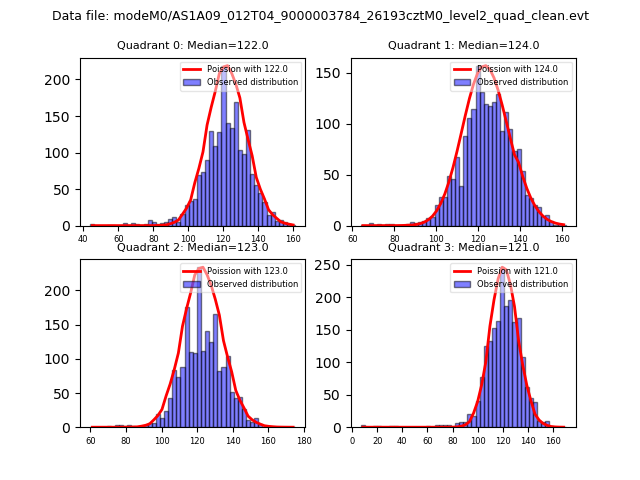 |
 |
| Quadrant-wise count rates Data is divided into 100 sec bins |
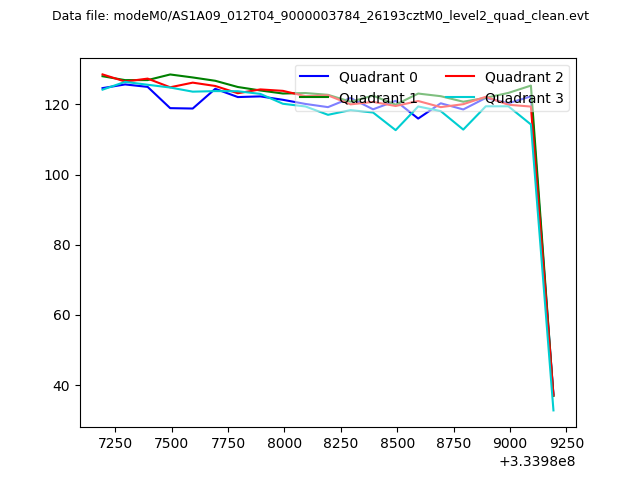 |
|
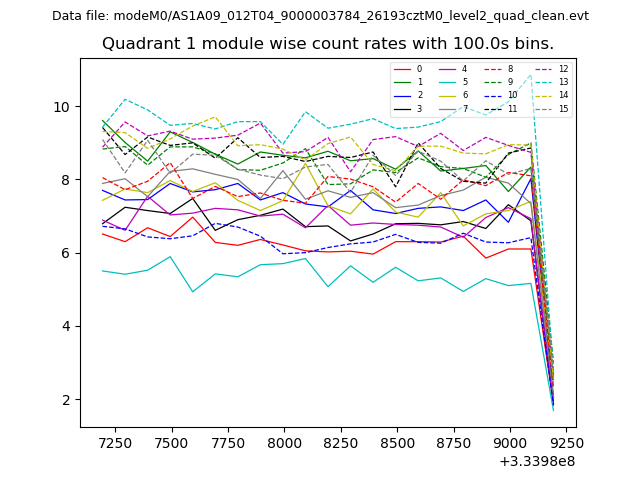
| Module-wise count rates for Quadrant A Data is divided into 100 sec bins |
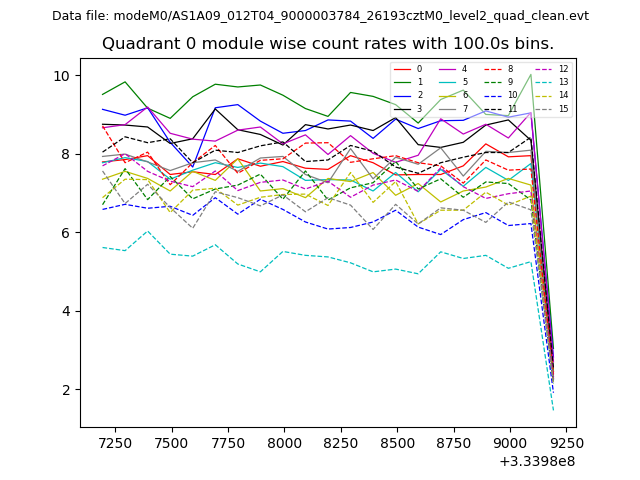 |
 |
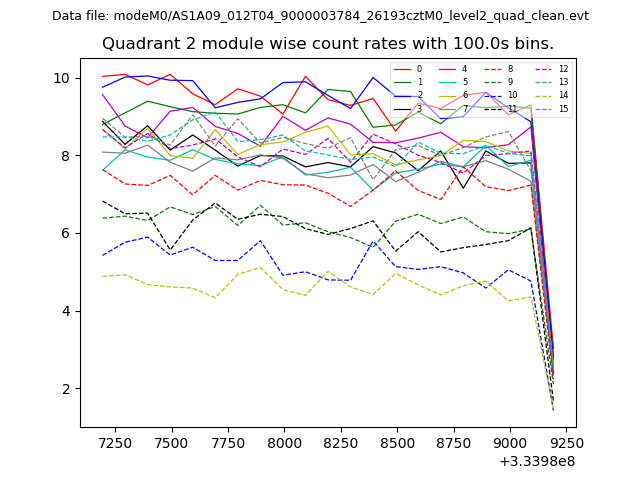
| Module-wise count rates for Quadrant B Data is divided into 100 sec bins |
 |
 |
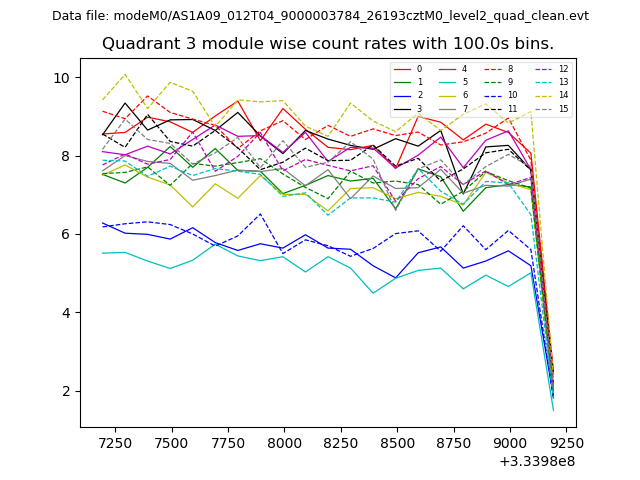
| Module-wise count rates for Quadrant C Data is divided into 100 sec bins |
 |
 |
| Module-wise count rates for Quadrant D Data is divided into 100 sec bins |
 |
 |
| Parameter | Plot |
|---|---|
| CZT HV Monitor | 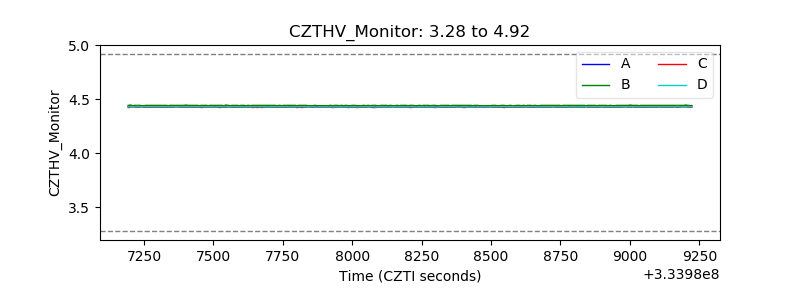 |
| D_VDD | 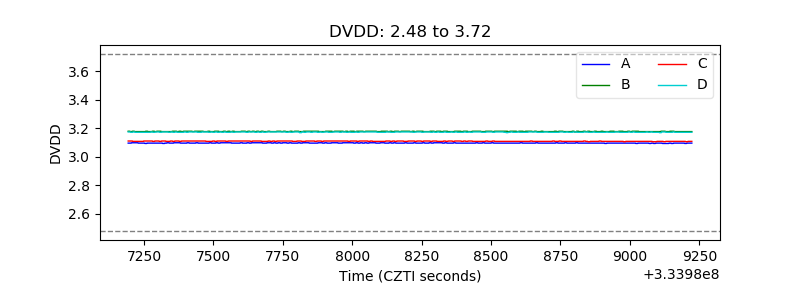 |
| Temperature 1 | 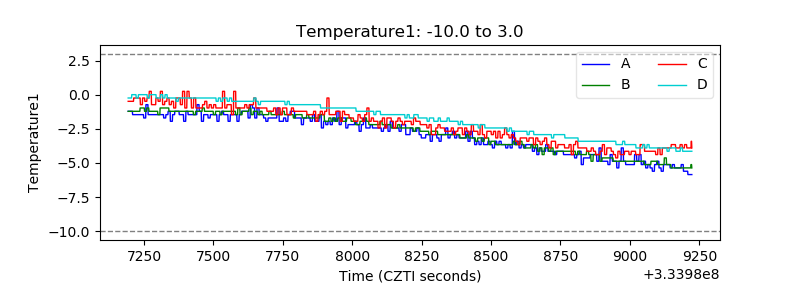 |
| Veto HV Monitor | 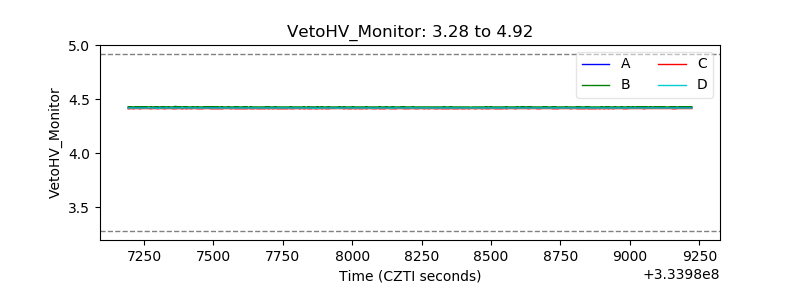 |
| Veto LLD | 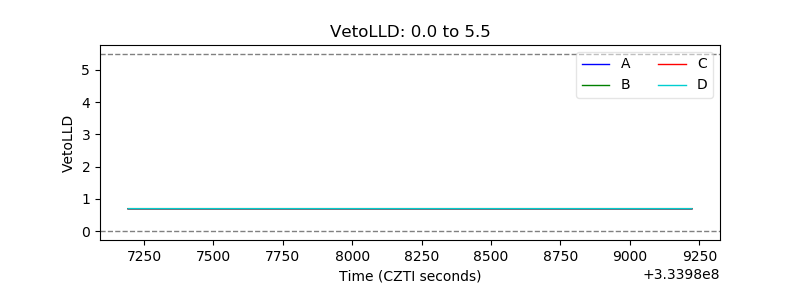 |
| Alpha Counter | 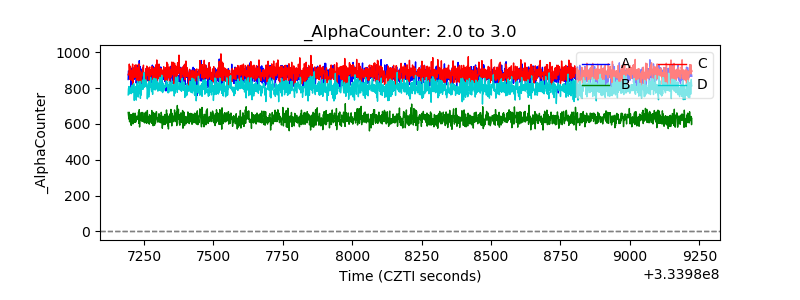 |
| _CPM_Rate | 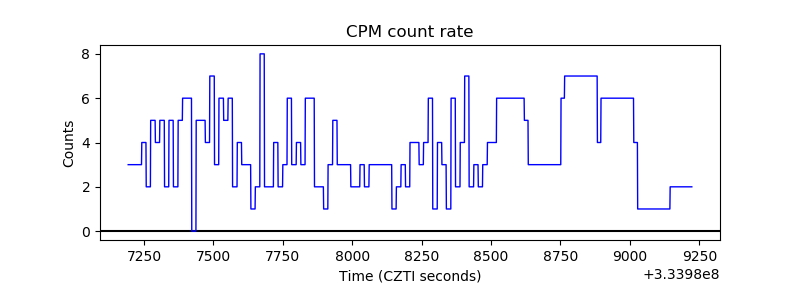 |
| CZT Counter | 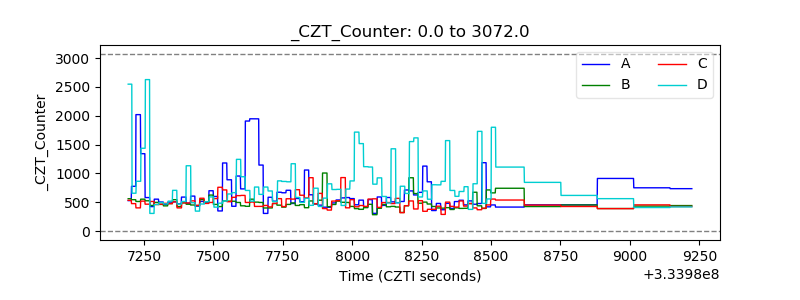 |
| +2.5 Volts monitor |  |
| +5 Volts monitor | 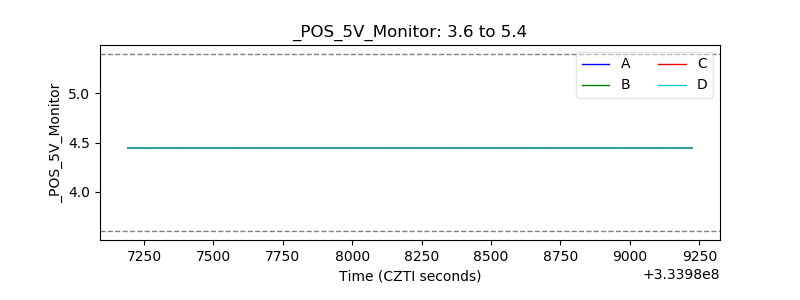 |
| _ROLL_ROT | 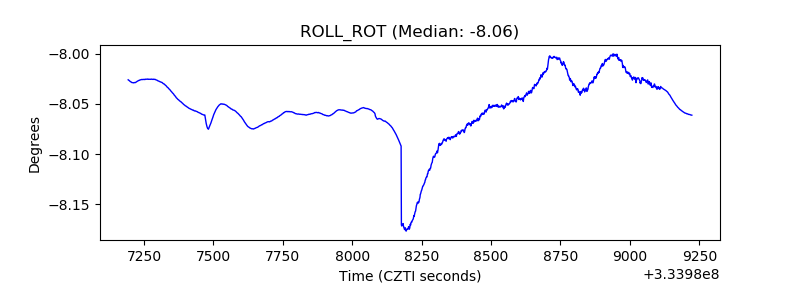 |
| _Roll_DEC | 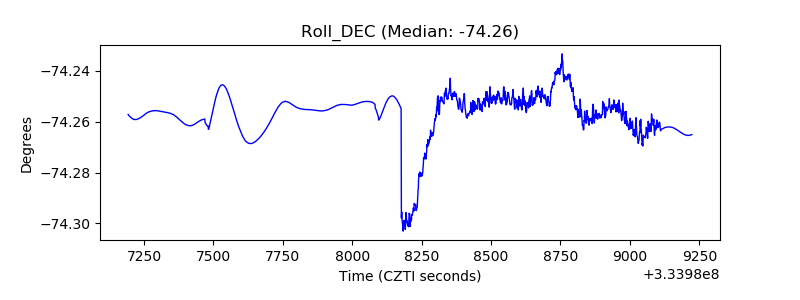 |
| _Roll_RA | 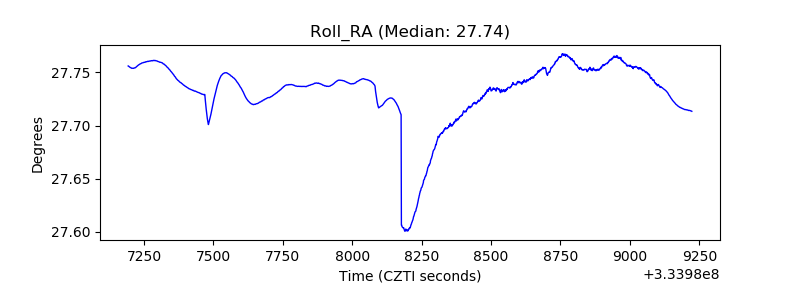 |
| Veto Counter | 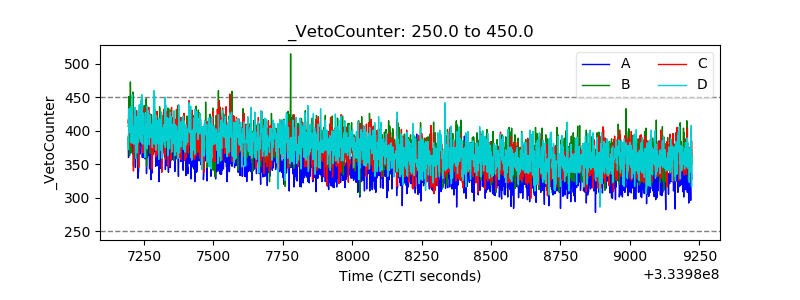 |