| Param | Original file | Final file |
|---|---|---|
| Filename | modeM0/AS1C05_007T01_9000003786cztM0_level2.fits | modeM0/AS1C05_007T01_9000003786cztM0_level2_quad_clean.evt |
| Size (bytes) | 704,177,280 | 508,435,200 |
| Size | 671.6 MB | 484.9 MB |
| Events in quadrant A | 4,463,536 | 2,857,086 |
| Events in quadrant B | 4,238,826 | 2,824,098 |
| Events in quadrant C | 4,253,480 | 2,646,219 |
| Events in quadrant D | 3,715,294 | 2,412,340 |
| Mode M0 | |||
|---|---|---|---|
| Quadrant | BADHDUFLAG | Total packets | Discarded packets |
| A | 0 | 145533 | 0 |
| B | 0 | 146001 | 0 |
| C | 0 | 150041 | 0 |
| D | 0 | 179475 | 0 |
| Mode SS | |||
|---|---|---|---|
| Quadrant | BADHDUFLAG | Total packets | Discarded packets |
| A | 0 | 1382 | 0 |
| B | 0 | 1382 | 0 |
| C | 0 | 1382 | 0 |
| D | 0 | 1382 | 0 |
| Mode M9 | |||
|---|---|---|---|
| Quadrant | BADHDUFLAG | Total packets | Discarded packets |
| A | 0 | 118 | 0 |
| B | 0 | 118 | 0 |
| C | 0 | 118 | 0 |
| D | 0 | 118 | 0 |
| Quadrant | Total seconds | Saturated seconds | Saturation percentage |
|---|---|---|---|
| A | 67883 | 946 | 1.393574% |
| B | 67883 | 1159 | 1.707349% |
| C | 67883 | 1554 | 2.289233% |
| D | 67883 | 2211 | 3.257075% |
Noise dominated data is calculated using 1-second bins in cleaned event files. If a bin has >2000 counts, and if more than 50% of those come from <1% of pixels, then it is considered to be noise-dominated and hence unusable.
| Quadrant | # 1 sec bins | Bins with >0 counts | Bins with >2000 counts | High rate bins dominated by noise | Noise dominated (total time) | Noise dominated (detector-on time) | Marked lightcurve |
|---|---|---|---|---|---|---|---|
| A | 79643 | 67880 | 0 | 0 | 0.00% | 0.00% |  |
| B | 79643 | 67872 | 0 | 0 | 0.00% | 0.00% |  |
| C | 79642 | 67875 | 0 | 0 | 0.00% | 0.00% |  |
| D | 79643 | 67859 | 0 | 0 | 0.00% | 0.00% |  |
Top three noisy pixels from each quadrant. If the there are fewer than three noisy pixels in the level2.evt file, extra rows are filled as -1
| Pixel properties | Quadrant properties | ||||||
|---|---|---|---|---|---|---|---|
| Quadrant | DetID | PixID | Counts | Sigma | Mean | Median | Sigma |
| A | 0 | 29 | 3718 | 9.26 | 1162 | 1093 | 283.5 |
| A | 7 | 110 | 3464 | 8.36 | 1162 | 1093 | 283.5 |
| A | 0 | 30 | 3326 | 7.88 | 1162 | 1093 | 283.5 |
| B | 2 | 9 | 3360 | 10.38 | 1120 | 1071 | 220.5 |
| B | 5 | 128 | 2777 | 7.74 | 1120 | 1071 | 220.5 |
| B | 5 | 225 | 2772 | 7.72 | 1120 | 1071 | 220.5 |
| C | 12 | 241 | 2956 | 6.72 | 1123 | 1051 | 283.3 |
| C | 3 | 126 | 2917 | 6.59 | 1123 | 1051 | 283.3 |
| C | 12 | 250 | 2858 | 6.38 | 1123 | 1051 | 283.3 |
| D | 10 | 189 | 2634 | 5.93 | 1062 | 968 | 280.9 |
| D | 15 | 46 | 2618 | 5.87 | 1062 | 968 | 280.9 |
| D | 6 | 231 | 2566 | 5.69 | 1062 | 968 | 280.9 |
Histogram calculated using DETX and DETY for each event in the final _common_clean file
| Quadrant A | 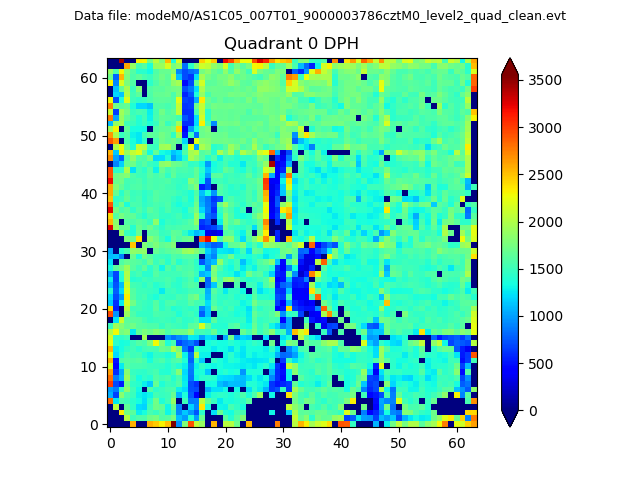 |
 |
Quadrant B |
|---|---|---|---|
| Quadrant D | 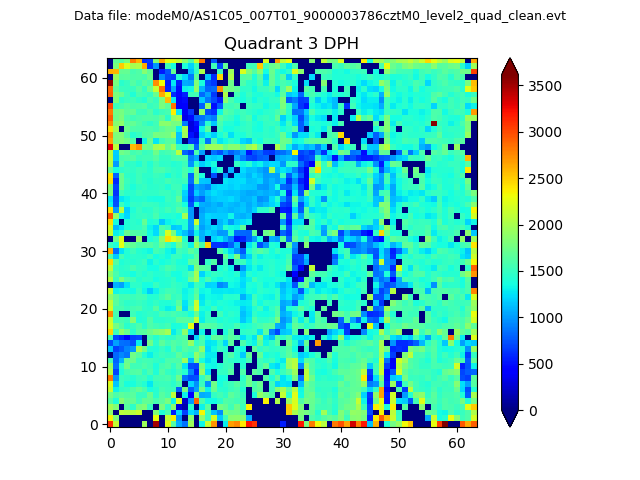 |
 |
Quadrant C |
| Plot type | Count rate plots | Images |
|---|---|---|
| Comparison with Poisson distribution Blue bars denote a histogram of data divided into 1 sec bins. Red curve is a Poisson curve with rate = median count rate of data. |
 |
 |
| Quadrant-wise count rates Data is divided into 100 sec bins |
 |
|
| Module-wise count rates for Quadrant A Data is divided into 100 sec bins |
 |
 |
| Module-wise count rates for Quadrant B Data is divided into 100 sec bins |
 |
 |
| Module-wise count rates for Quadrant C Data is divided into 100 sec bins |
 |
 |
| Module-wise count rates for Quadrant D Data is divided into 100 sec bins |
 |
 |
| Parameter | Plot |
|---|---|
| CZT HV Monitor |  |
| D_VDD | 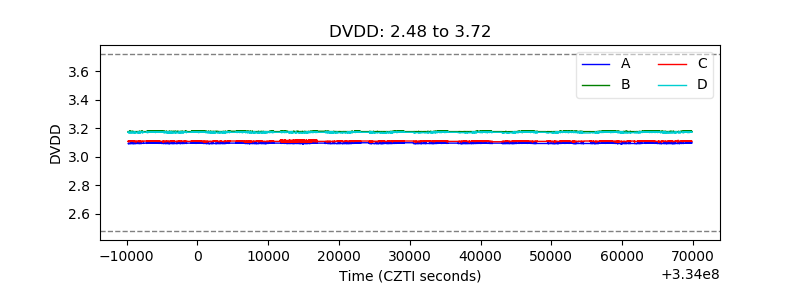 |
| Temperature 1 |  |
| Veto HV Monitor |  |
| Veto LLD |  |
| Alpha Counter |  |
| _CPM_Rate |  |
| CZT Counter |  |
| +2.5 Volts monitor |  |
| +5 Volts monitor |  |
| _ROLL_ROT |  |
| _Roll_DEC |  |
| _Roll_RA |  |
| Veto Counter |  |