| Param | Original file | Final file |
|---|---|---|
| Filename | modeM0/AS1C05_007T01_9000003786_26193cztM0_level2.evt | modeM0/AS1C05_007T01_9000003786_26193cztM0_level2_quad_clean.evt |
| Size (bytes) | 1,097,231,040 | 182,718,720 |
| Size | 1.0 GB | 174.3 MB |
| Events in quadrant A | 7,197,706 | 1,155,723 |
| Events in quadrant B | 7,486,056 | 1,161,021 |
| Events in quadrant C | 7,760,004 | 1,106,365 |
| Events in quadrant D | 9,778,830 | 1,082,039 |
| Mode M0 | |||
|---|---|---|---|
| Quadrant | BADHDUFLAG | Total packets | Discarded packets |
| A | 0 | 30880 | 0 |
| B | 0 | 31544 | 0 |
| C | 0 | 32548 | 0 |
| D | 0 | 39007 | 0 |
| Mode M9 | |||
|---|---|---|---|
| Quadrant | BADHDUFLAG | Total packets | Discarded packets |
| A | 0 | 18 | 0 |
| B | 0 | 18 | 0 |
| C | 0 | 18 | 0 |
| D | 0 | 18 | 0 |
| Quadrant | Total seconds | Saturated seconds | Saturation percentage |
|---|---|---|---|
| A | 14902 | 114 | 0.764998% |
| B | 14902 | 157 | 1.053550% |
| C | 14902 | 268 | 1.798416% |
| D | 14902 | 411 | 2.758019% |
Noise dominated data is calculated using 1-second bins in cleaned event files. If a bin has >2000 counts, and if more than 50% of those come from <1% of pixels, then it is considered to be noise-dominated and hence unusable.
| Quadrant | # 1 sec bins | Bins with >0 counts | Bins with >2000 counts | High rate bins dominated by noise | Noise dominated (total time) | Noise dominated (detector-on time) | Marked lightcurve |
|---|---|---|---|---|---|---|---|
| A | 16712 | 14905 | 1 | 1 | 0.01% | 0.01% | 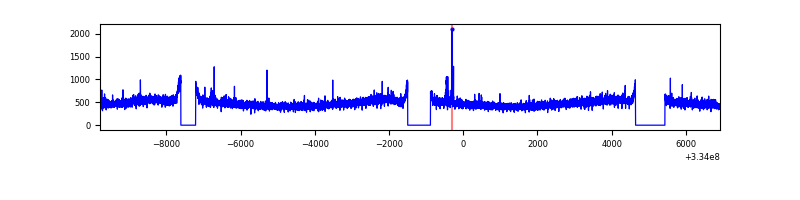 |
| B | 16712 | 14905 | 22 | 22 | 0.13% | 0.15% |  |
| C | 16712 | 14905 | 34 | 34 | 0.20% | 0.23% | 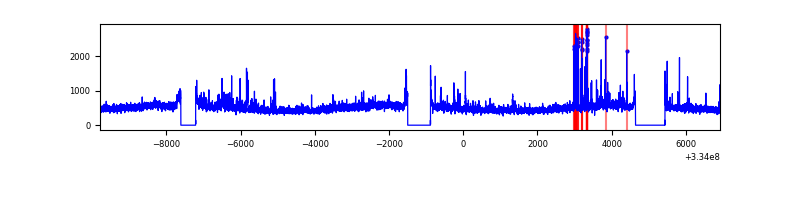 |
| D | 16712 | 14905 | 358 | 358 | 2.14% | 2.40% | 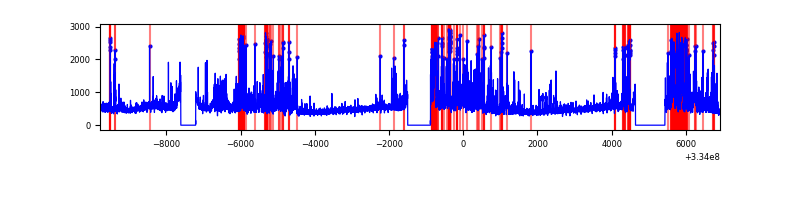 |
Top three noisy pixels from each quadrant. If the there are fewer than three noisy pixels in the level2.evt file, extra rows are filled as -1
| Pixel properties | Quadrant properties | ||||||
|---|---|---|---|---|---|---|---|
| Quadrant | DetID | PixID | Counts | Sigma | Mean | Median | Sigma |
| A | 0 | 13 | 42716 | 109.39 | 1853 | 1810 | 374.0 |
| A | 13 | 254 | 23889 | 59.04 | 1853 | 1810 | 374.0 |
| A | 3 | 137 | 17305 | 41.43 | 1853 | 1810 | 374.0 |
| B | 0 | 190 | 149846 | 424.73 | 1837 | 1788 | 348.6 |
| B | 5 | 172 | 106650 | 300.81 | 1837 | 1788 | 348.6 |
| B | 12 | 111 | 43736 | 120.33 | 1837 | 1788 | 348.6 |
| C | 3 | 233 | 364976 | 876.81 | 1764 | 1777 | 414.2 |
| C | 14 | 238 | 278441 | 667.9 | 1764 | 1777 | 414.2 |
| C | 2 | 16 | 246060 | 589.73 | 1764 | 1777 | 414.2 |
| D | 1 | 52 | 1905854 | 4455.79 | 1779 | 1735 | 427.3 |
| D | 7 | 38 | 439813 | 1025.14 | 1779 | 1735 | 427.3 |
| D | 12 | 233 | 398924 | 929.45 | 1779 | 1735 | 427.3 |
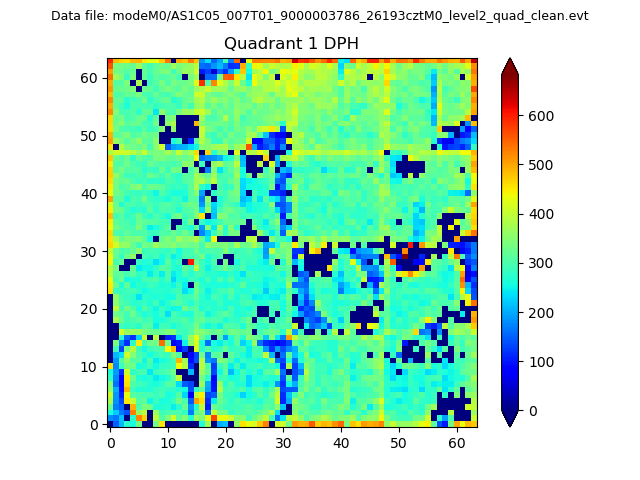
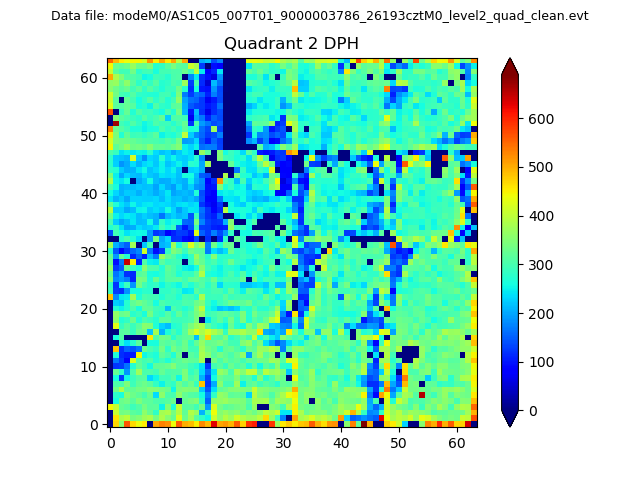
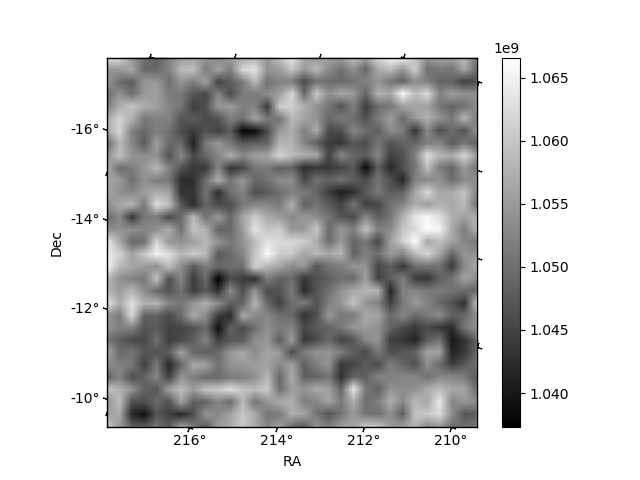
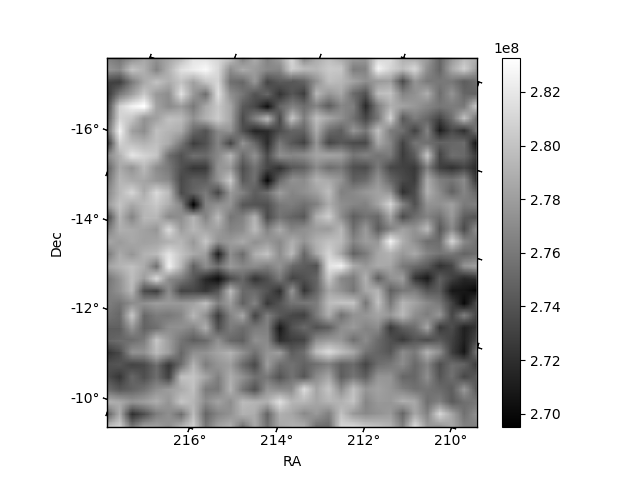
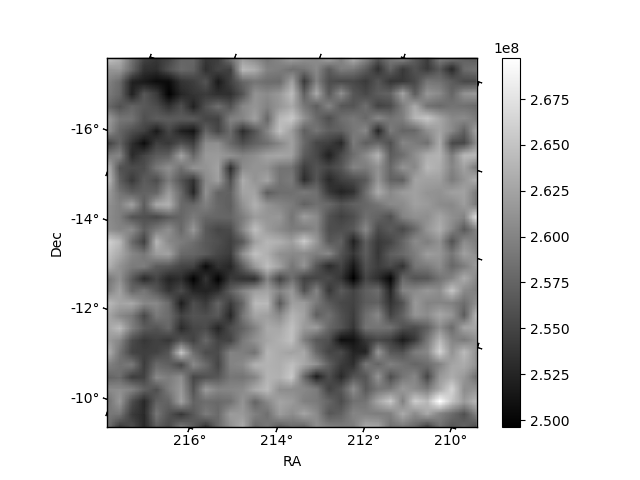
Histogram calculated using DETX and DETY for each event in the final _common_clean file
| Quadrant A | 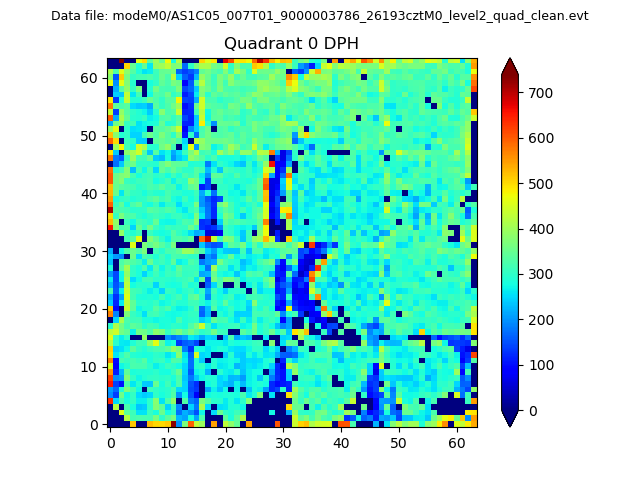 |
 |
Quadrant B |
|---|---|---|---|
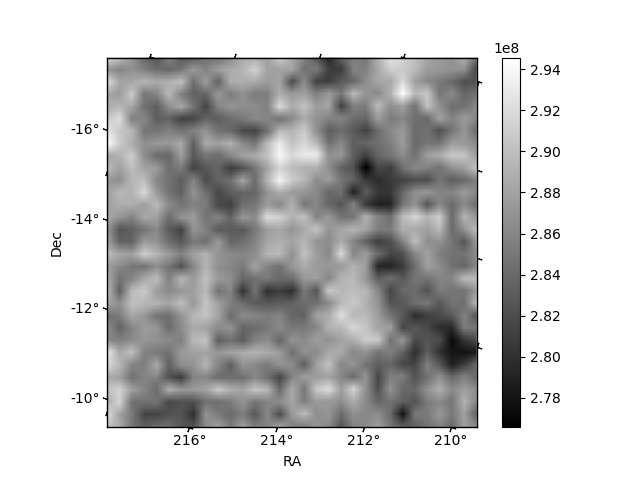
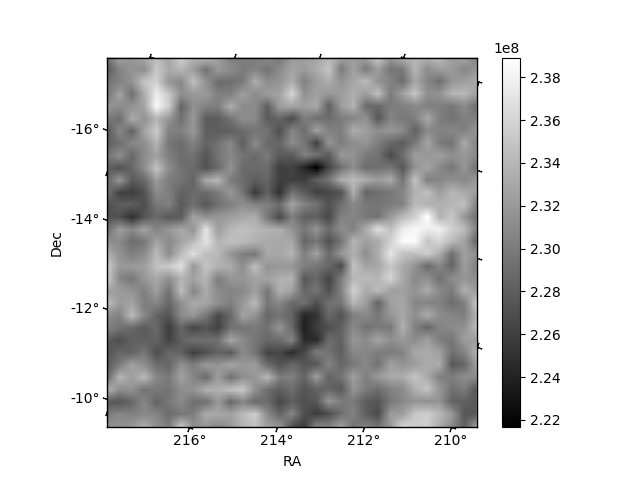
| Quadrant D | 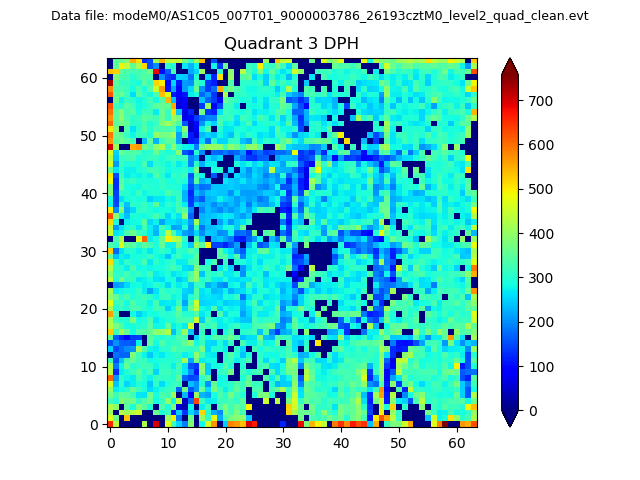 |
 |
Quadrant C |
| Plot type | Count rate plots | Images |
|---|---|---|
| Comparison with Poisson distribution Blue bars denote a histogram of data divided into 1 sec bins. Red curve is a Poisson curve with rate = median count rate of data. |
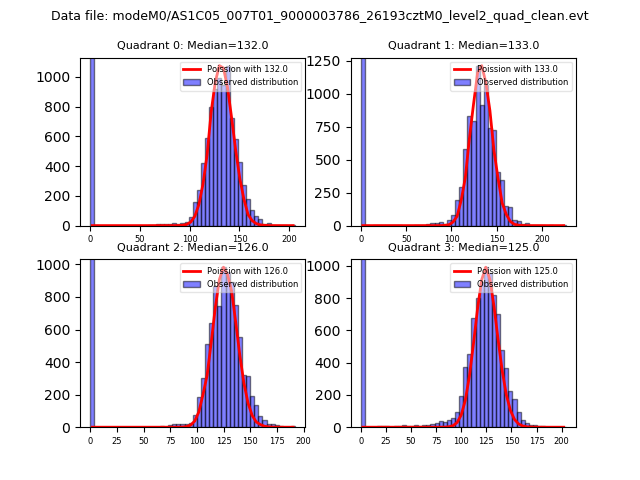 |
 |
| Quadrant-wise count rates Data is divided into 100 sec bins |
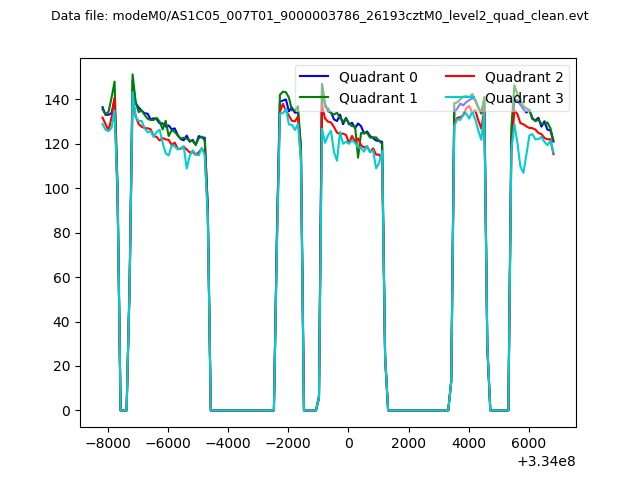 |
|
| Module-wise count rates for Quadrant A Data is divided into 100 sec bins |
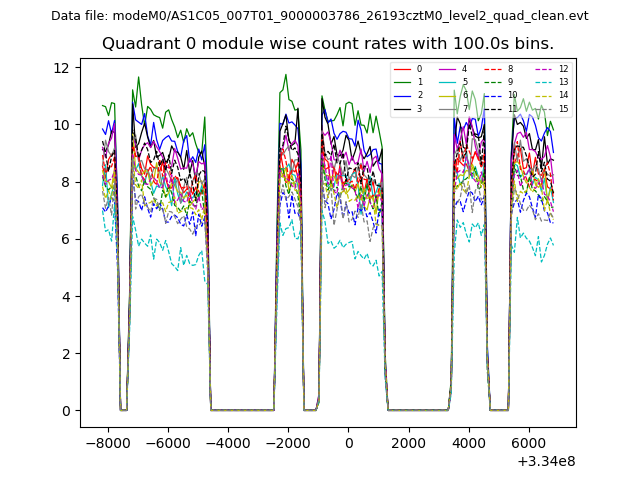 |
 |
| Module-wise count rates for Quadrant B Data is divided into 100 sec bins |
 |
 |
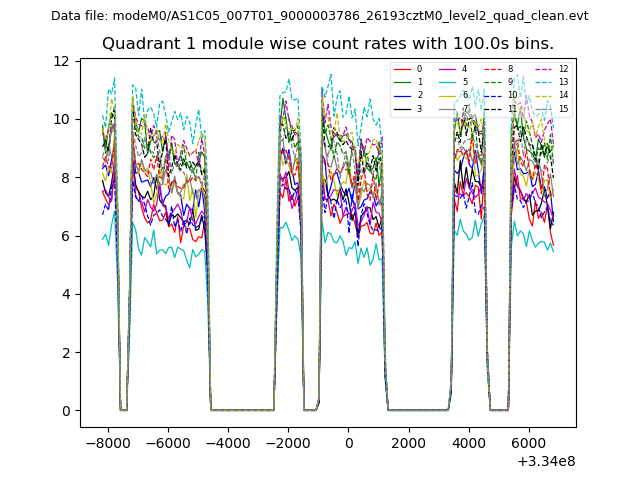
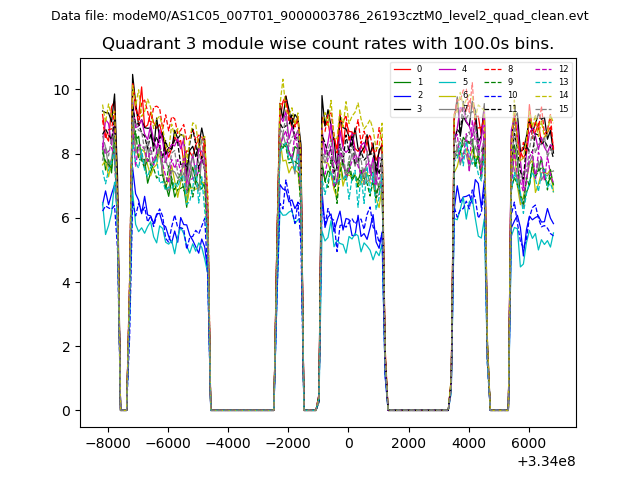
| Module-wise count rates for Quadrant C Data is divided into 100 sec bins |
 |
 |
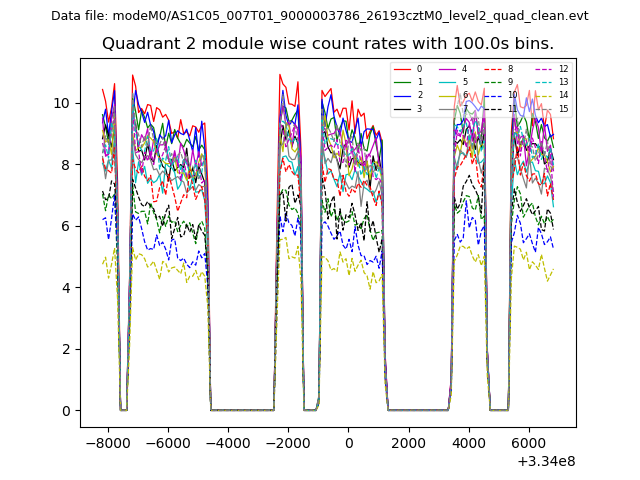
| Module-wise count rates for Quadrant D Data is divided into 100 sec bins |
 |
 |
| Parameter | Plot |
|---|---|
| CZT HV Monitor | 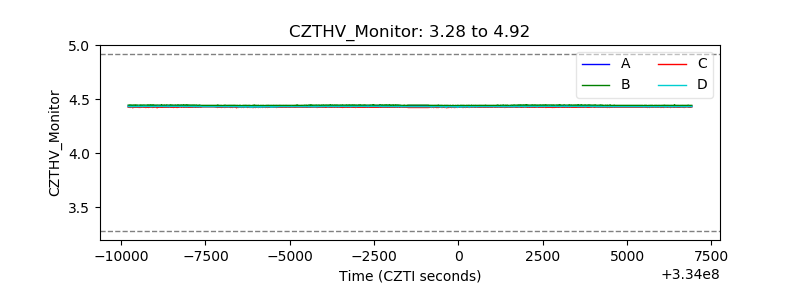 |
| D_VDD | 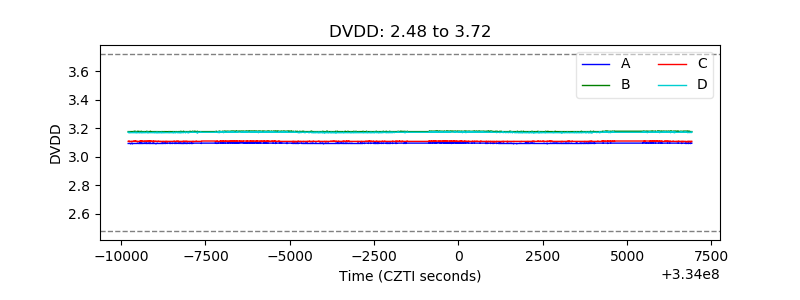 |
| Temperature 1 | 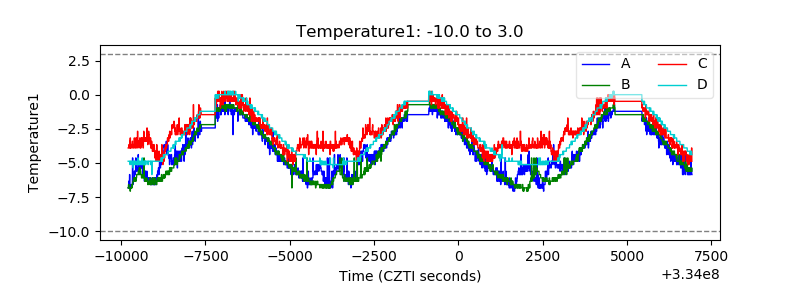 |
| Veto HV Monitor | 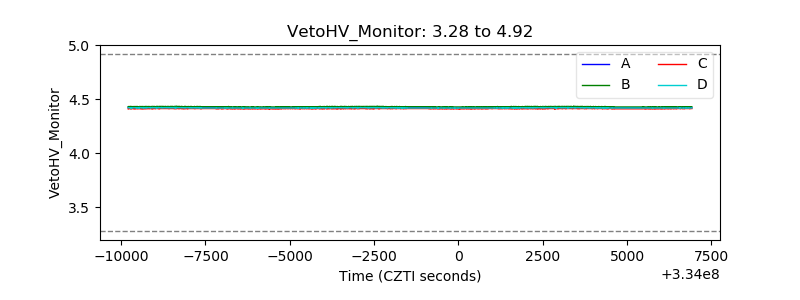 |
| Veto LLD | 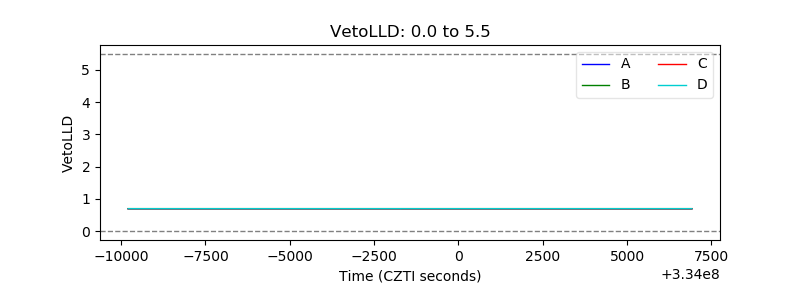 |
| Alpha Counter | 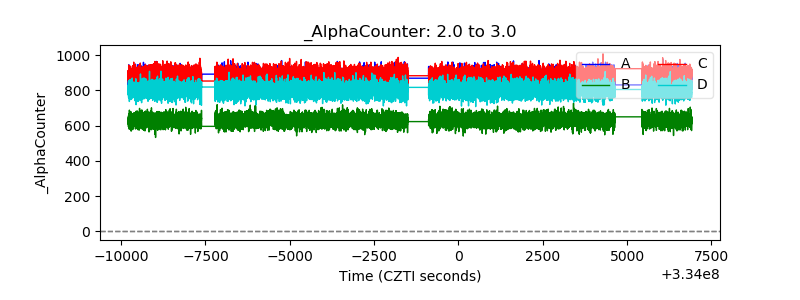 |
| _CPM_Rate | 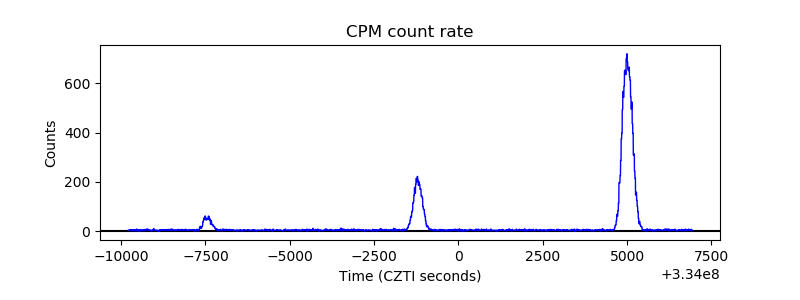 |
| CZT Counter | 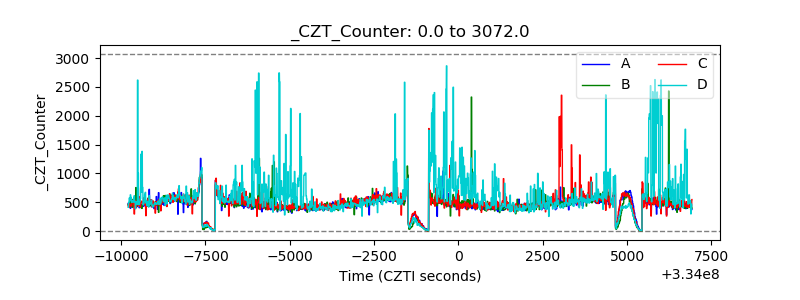 |
| +2.5 Volts monitor | 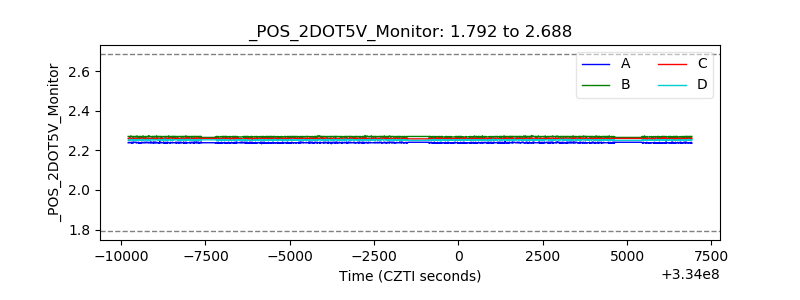 |
| +5 Volts monitor |  |
| _ROLL_ROT | 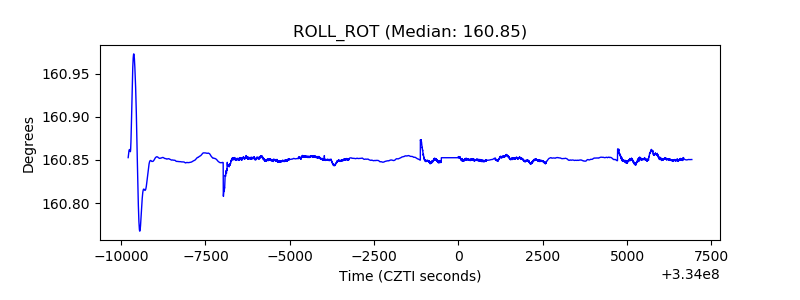 |
| _Roll_DEC | 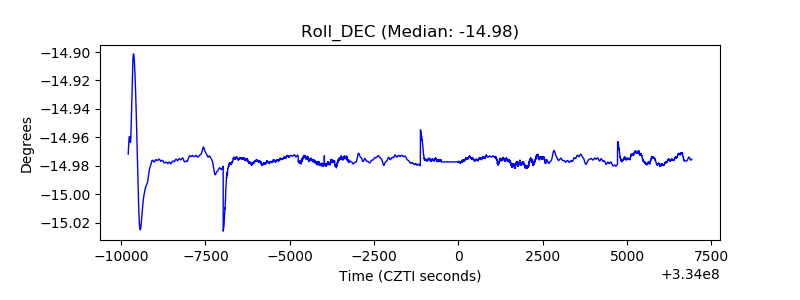 |
| _Roll_RA | 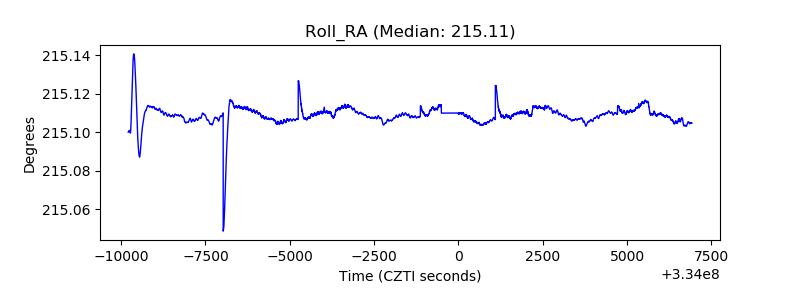 |
| Veto Counter |  |