| Param | Original file | Final file |
|---|---|---|
| Filename | modeM0/AS1C05_007T01_9000003786_26194cztM0_level2.evt | modeM0/AS1C05_007T01_9000003786_26194cztM0_level2_quad_clean.evt |
| Size (bytes) | 483,140,160 | 90,466,560 |
| Size | 460.8 MB | 86.3 MB |
| Events in quadrant A | 3,199,113 | 584,446 |
| Events in quadrant B | 3,267,940 | 591,665 |
| Events in quadrant C | 3,534,035 | 553,748 |
| Events in quadrant D | 4,176,289 | 543,259 |
| Mode M0 | |||
|---|---|---|---|
| Quadrant | BADHDUFLAG | Total packets | Discarded packets |
| A | 0 | 13689 | 0 |
| B | 0 | 13839 | 0 |
| C | 0 | 14740 | 0 |
| D | 0 | 16903 | 0 |
| Mode M9 | |||
|---|---|---|---|
| Quadrant | BADHDUFLAG | Total packets | Discarded packets |
| A | 0 | 9 | 0 |
| B | 0 | 9 | 0 |
| C | 0 | 9 | 0 |
| D | 0 | 9 | 0 |
| Quadrant | Total seconds | Saturated seconds | Saturation percentage |
|---|---|---|---|
| A | 6691 | 23 | 0.343745% |
| B | 6691 | 39 | 0.582873% |
| C | 6690 | 116 | 1.733931% |
| D | 6691 | 225 | 3.362726% |
Noise dominated data is calculated using 1-second bins in cleaned event files. If a bin has >2000 counts, and if more than 50% of those come from <1% of pixels, then it is considered to be noise-dominated and hence unusable.
| Quadrant | # 1 sec bins | Bins with >0 counts | Bins with >2000 counts | High rate bins dominated by noise | Noise dominated (total time) | Noise dominated (detector-on time) | Marked lightcurve |
|---|---|---|---|---|---|---|---|
| A | 7611 | 6692 | 0 | 0 | 0.00% | 0.00% | 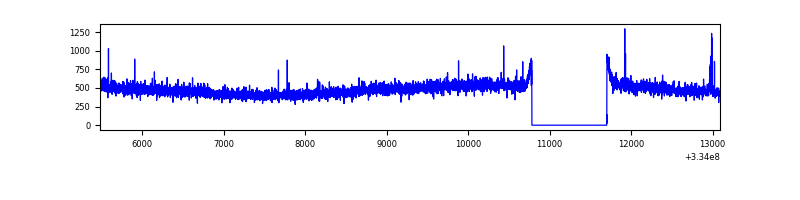 |
| B | 7611 | 6692 | 5 | 5 | 0.07% | 0.07% | 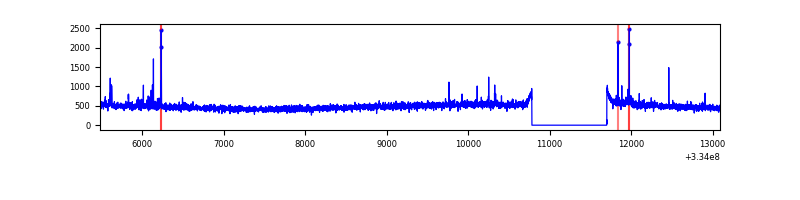 |
| C | 7610 | 6691 | 18 | 18 | 0.24% | 0.27% | 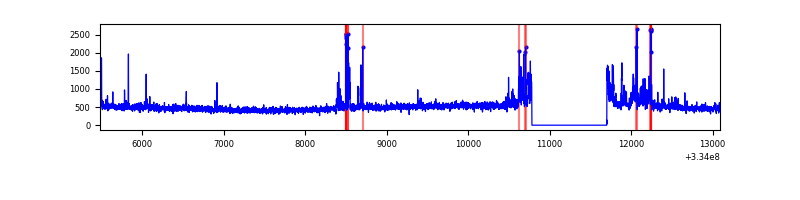 |
| D | 7610 | 6691 | 224 | 224 | 2.94% | 3.35% | 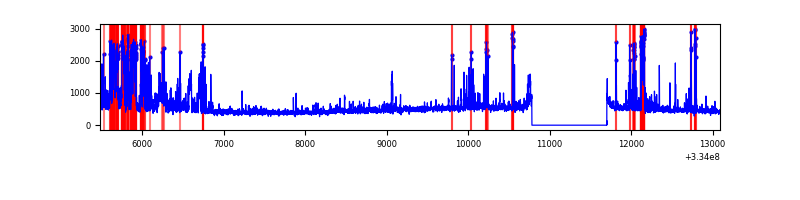 |
Top three noisy pixels from each quadrant. If the there are fewer than three noisy pixels in the level2.evt file, extra rows are filled as -1
| Pixel properties | Quadrant properties | ||||||
|---|---|---|---|---|---|---|---|
| Quadrant | DetID | PixID | Counts | Sigma | Mean | Median | Sigma |
| A | 0 | 13 | 21383 | 122.65 | 824 | 806 | 167.8 |
| A | 13 | 254 | 11395 | 63.12 | 824 | 806 | 167.8 |
| A | 3 | 137 | 7646 | 40.77 | 824 | 806 | 167.8 |
| B | 5 | 172 | 31109 | 192.2 | 820 | 798 | 157.7 |
| B | 0 | 190 | 28372 | 174.84 | 820 | 798 | 157.7 |
| B | 12 | 111 | 19127 | 116.22 | 820 | 798 | 157.7 |
| C | 3 | 233 | 220085 | 1188.03 | 780 | 785 | 184.6 |
| C | 2 | 16 | 146650 | 790.2 | 780 | 785 | 184.6 |
| C | 14 | 238 | 123739 | 666.09 | 780 | 785 | 184.6 |
| D | 1 | 52 | 522932 | 2769.3 | 781 | 764 | 188.6 |
| D | 7 | 38 | 436814 | 2312.57 | 781 | 764 | 188.6 |
| D | 12 | 233 | 219276 | 1158.87 | 781 | 764 | 188.6 |
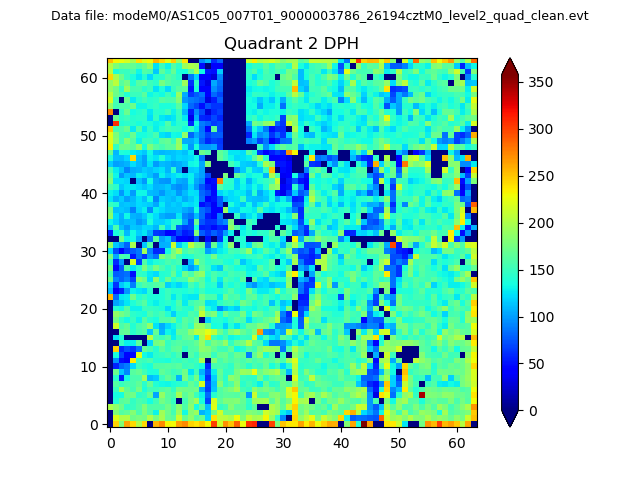
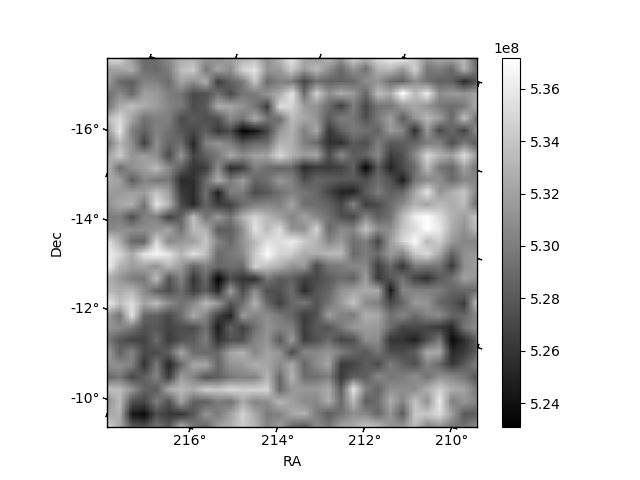
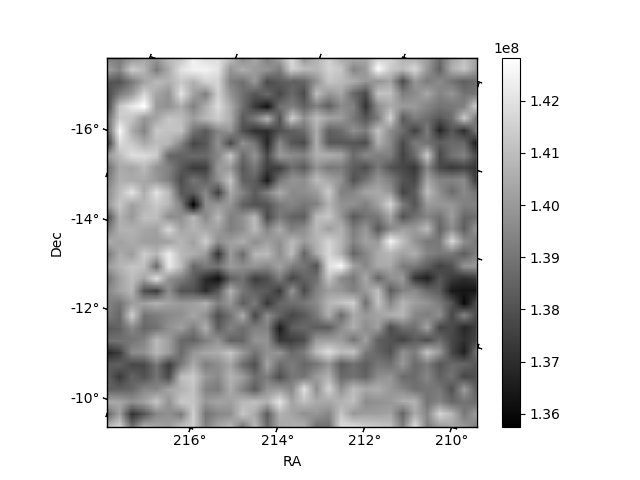
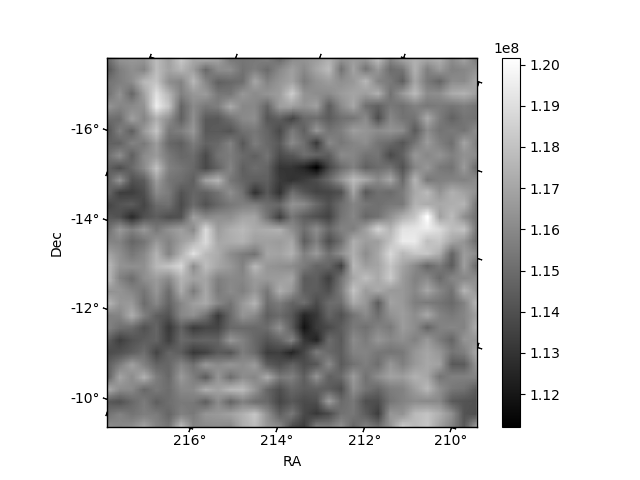
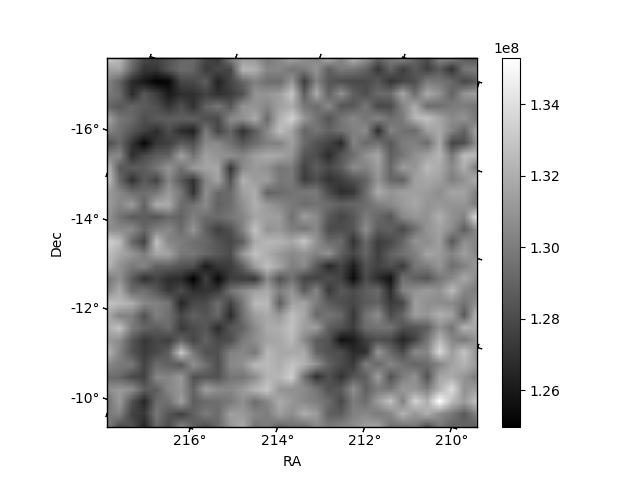
Histogram calculated using DETX and DETY for each event in the final _common_clean file
| Quadrant A | 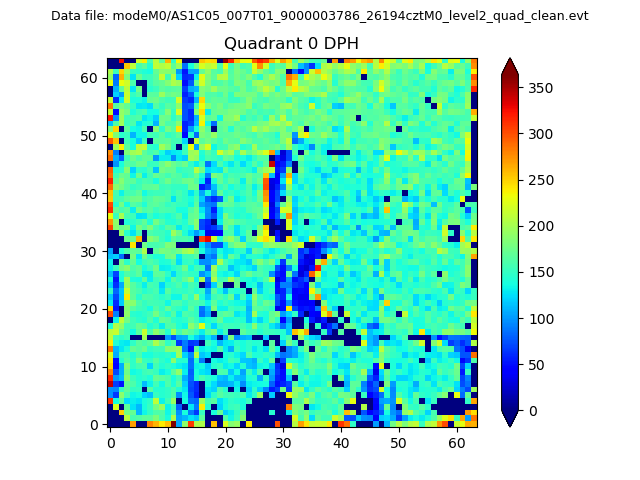 |
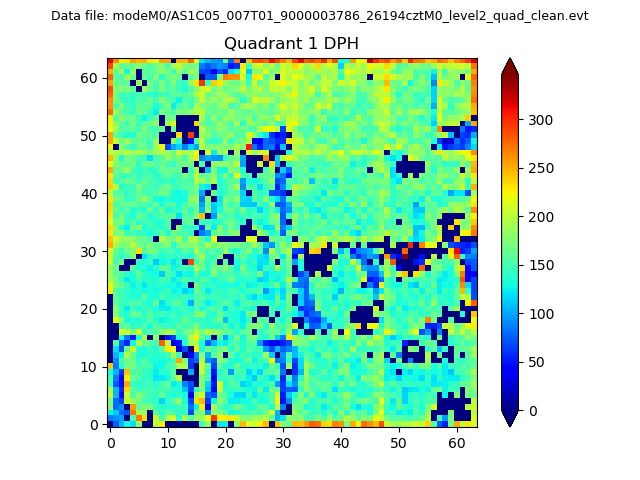 |
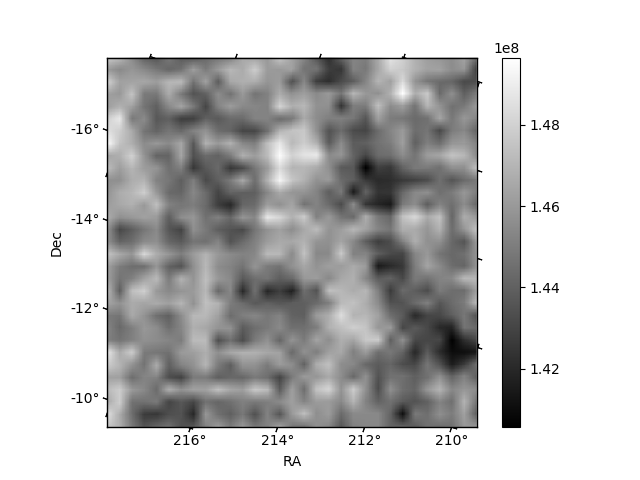
Quadrant B |
|---|---|---|---|
| Quadrant D | 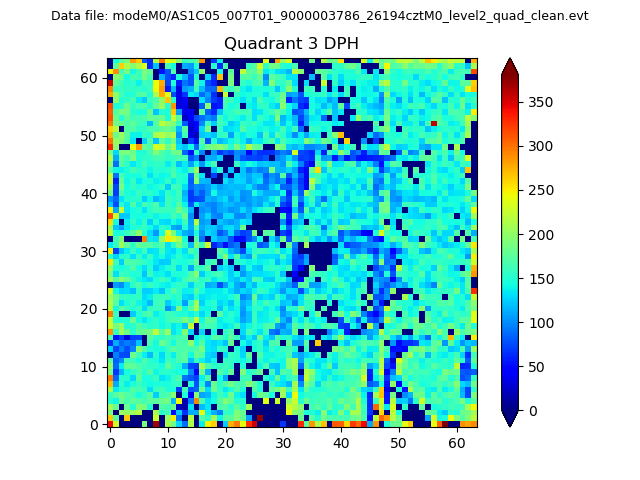 |
 |
Quadrant C |
| Plot type | Count rate plots | Images |
|---|---|---|
| Comparison with Poisson distribution Blue bars denote a histogram of data divided into 1 sec bins. Red curve is a Poisson curve with rate = median count rate of data. |
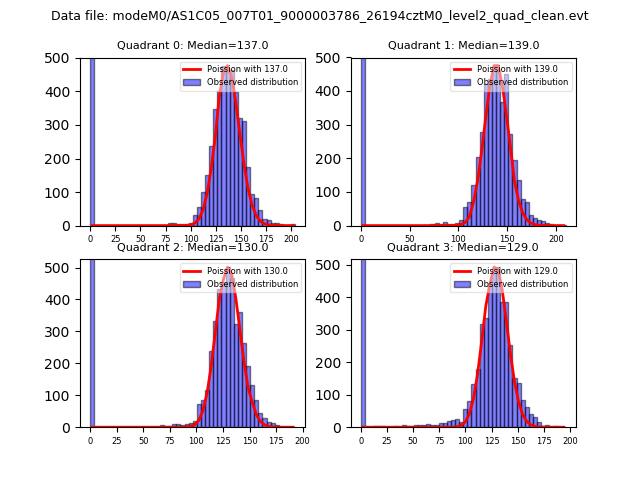 |
 |
| Quadrant-wise count rates Data is divided into 100 sec bins |
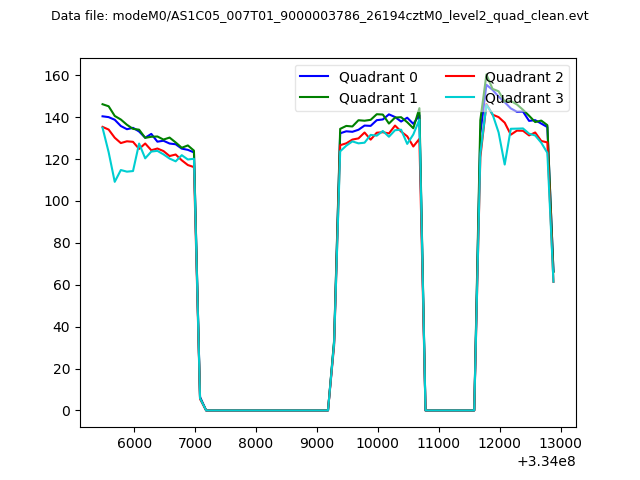 |
|
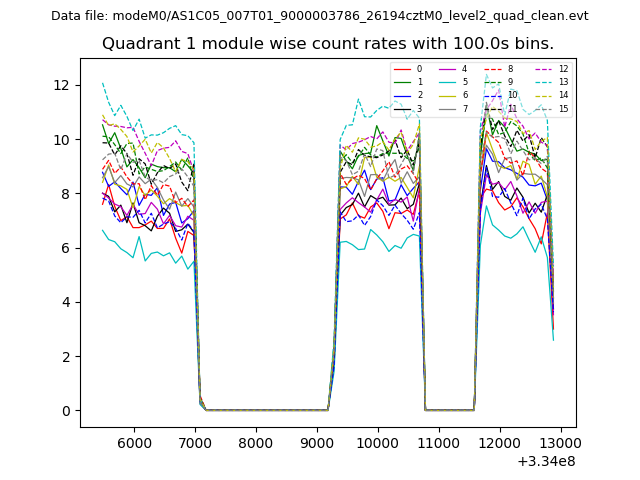
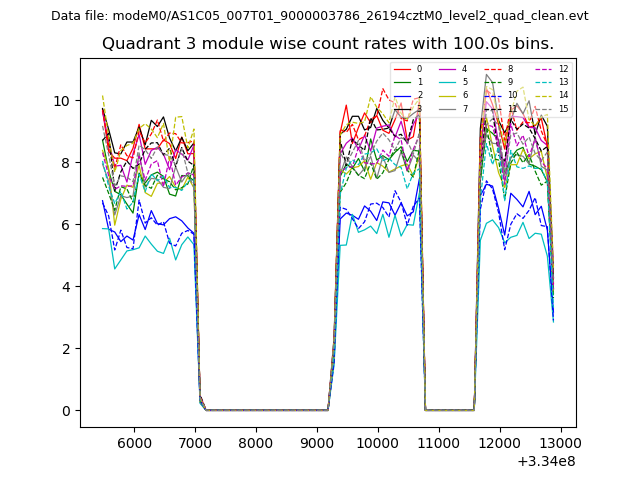
| Module-wise count rates for Quadrant A Data is divided into 100 sec bins |
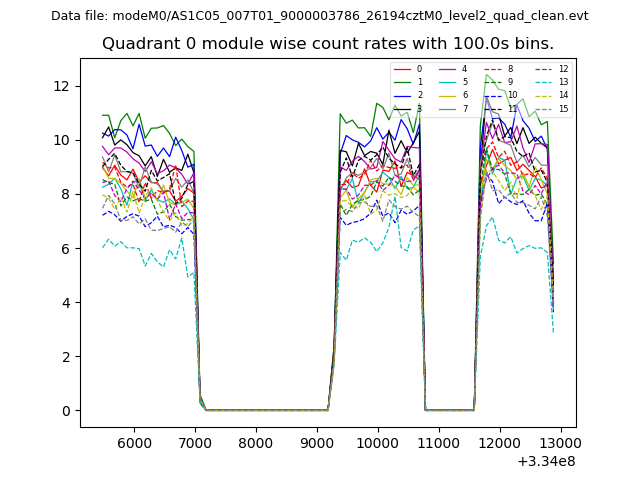 |
 |
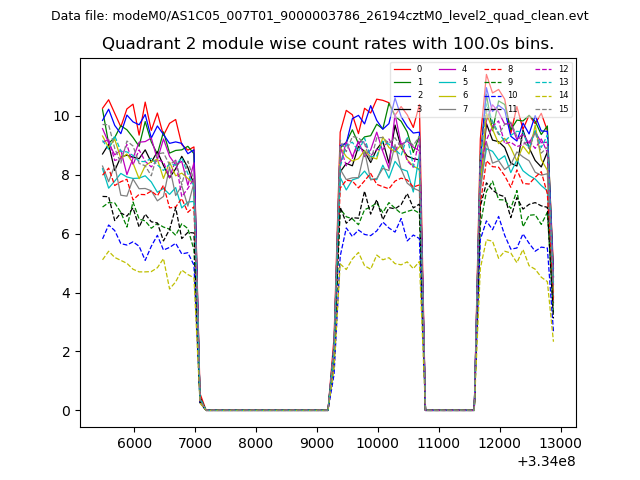
| Module-wise count rates for Quadrant B Data is divided into 100 sec bins |
 |
 |
| Module-wise count rates for Quadrant C Data is divided into 100 sec bins |
 |
 |
| Module-wise count rates for Quadrant D Data is divided into 100 sec bins |
 |
 |
| Parameter | Plot |
|---|---|
| CZT HV Monitor | 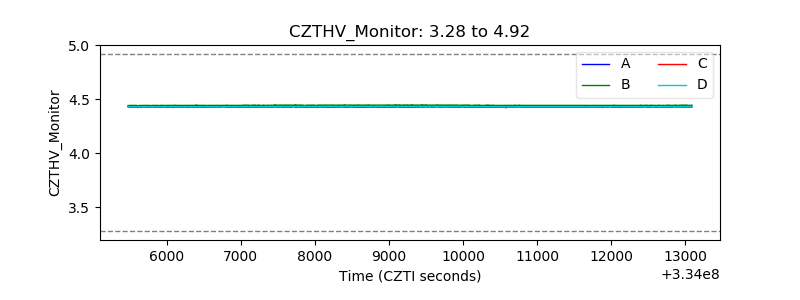 |
| D_VDD | 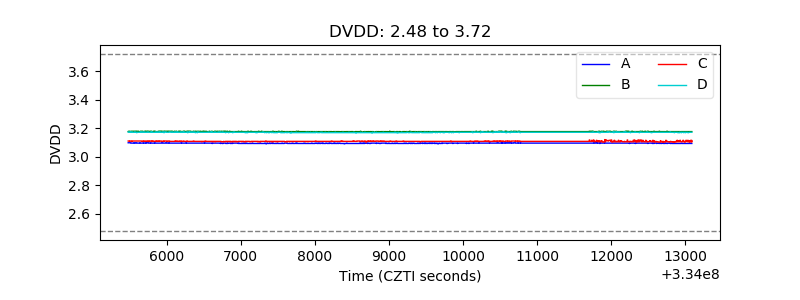 |
| Temperature 1 | 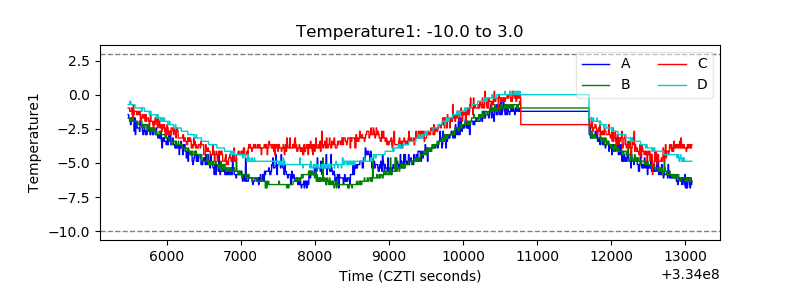 |
| Veto HV Monitor | 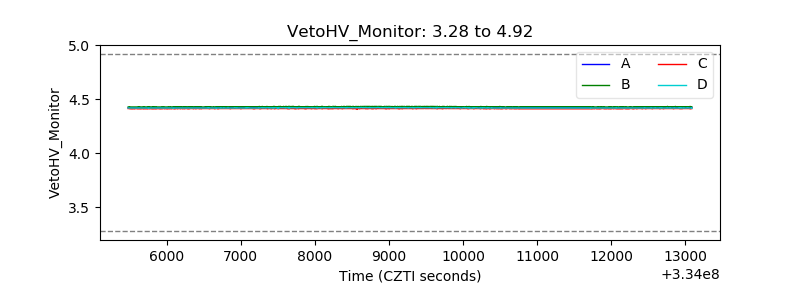 |
| Veto LLD | 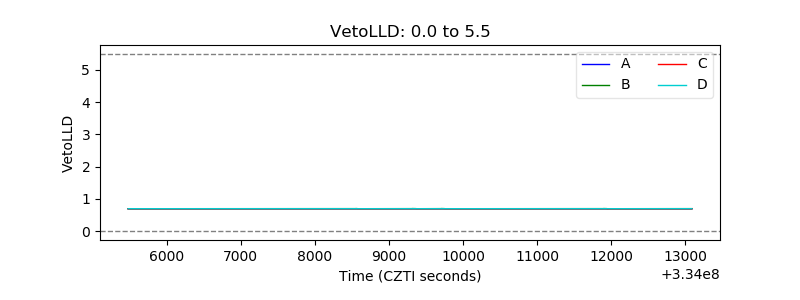 |
| Alpha Counter | 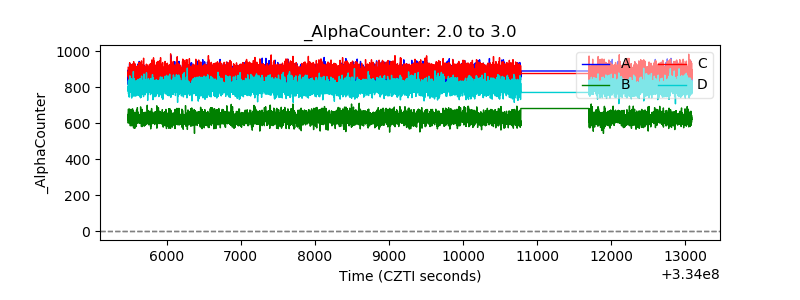 |
| _CPM_Rate | 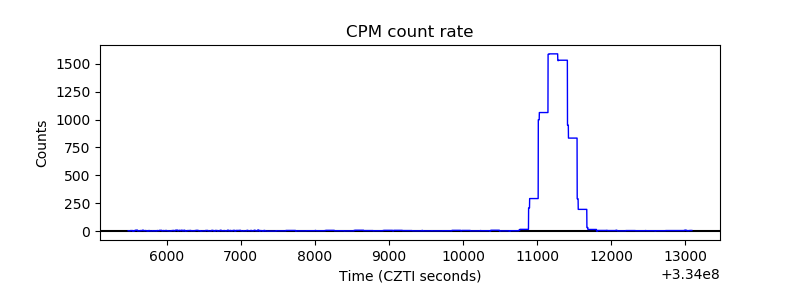 |
| CZT Counter | 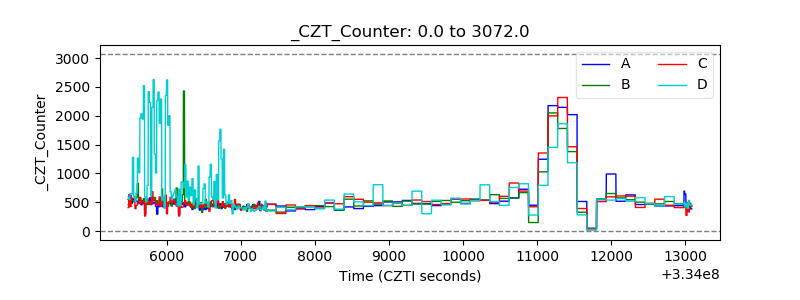 |
| +2.5 Volts monitor |  |
| +5 Volts monitor |  |
| _ROLL_ROT | 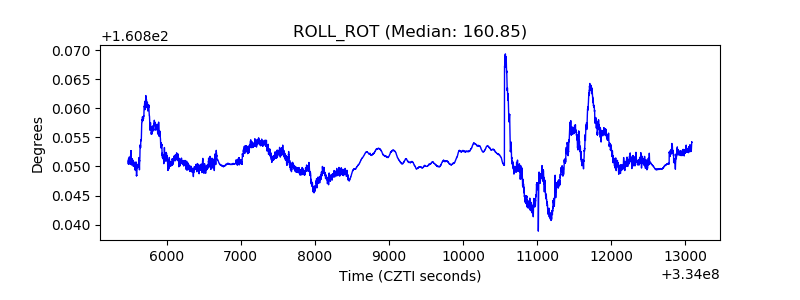 |
| _Roll_DEC | 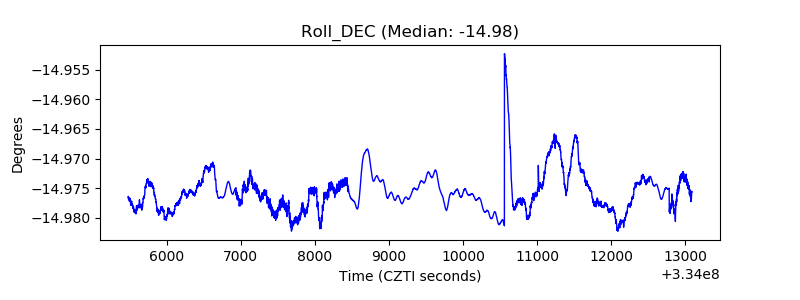 |
| _Roll_RA | 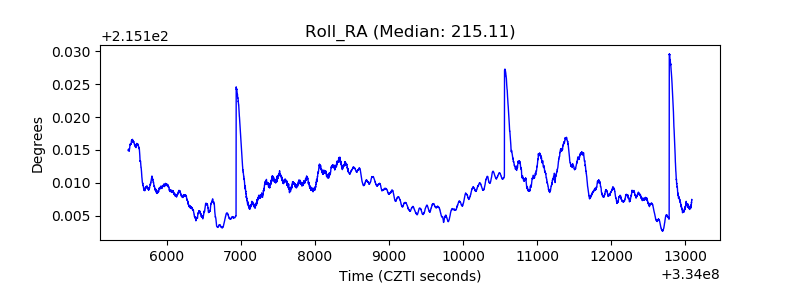 |
| Veto Counter | 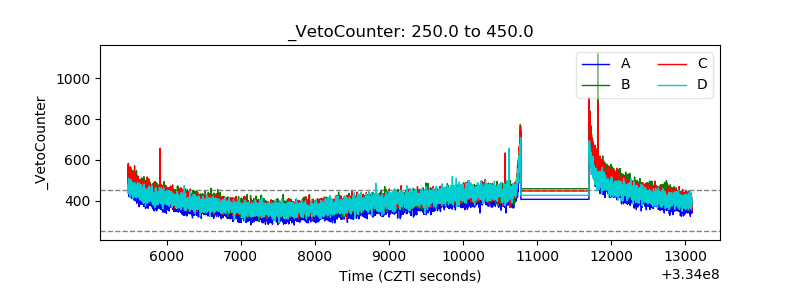 |