| Param | Original file | Final file |
|---|---|---|
| Filename | modeM0/AS1C05_007T01_9000003786_26196cztM0_level2.evt | modeM0/AS1C05_007T01_9000003786_26196cztM0_level2_quad_clean.evt |
| Size (bytes) | 494,464,320 | 88,908,480 |
| Size | 471.6 MB | 84.8 MB |
| Events in quadrant A | 3,339,525 | 574,201 |
| Events in quadrant B | 3,401,774 | 581,212 |
| Events in quadrant C | 3,884,978 | 537,254 |
| Events in quadrant D | 3,894,438 | 533,150 |
| Mode M0 | |||
|---|---|---|---|
| Quadrant | BADHDUFLAG | Total packets | Discarded packets |
| A | 0 | 13955 | 0 |
| B | 0 | 14141 | 0 |
| C | 0 | 15765 | 0 |
| D | 0 | 16056 | 0 |
| Mode M9 | |||
|---|---|---|---|
| Quadrant | BADHDUFLAG | Total packets | Discarded packets |
| A | 0 | 20 | 0 |
| B | 0 | 20 | 0 |
| C | 0 | 20 | 0 |
| D | 0 | 20 | 0 |
| Quadrant | Total seconds | Saturated seconds | Saturation percentage |
|---|---|---|---|
| A | 6688 | 37 | 0.553230% |
| B | 6689 | 71 | 1.061444% |
| C | 6689 | 173 | 2.586336% |
| D | 6689 | 159 | 2.377037% |
Noise dominated data is calculated using 1-second bins in cleaned event files. If a bin has >2000 counts, and if more than 50% of those come from <1% of pixels, then it is considered to be noise-dominated and hence unusable.
| Quadrant | # 1 sec bins | Bins with >0 counts | Bins with >2000 counts | High rate bins dominated by noise | Noise dominated (total time) | Noise dominated (detector-on time) | Marked lightcurve |
|---|---|---|---|---|---|---|---|
| A | 8693 | 6690 | 0 | 0 | 0.00% | 0.00% | 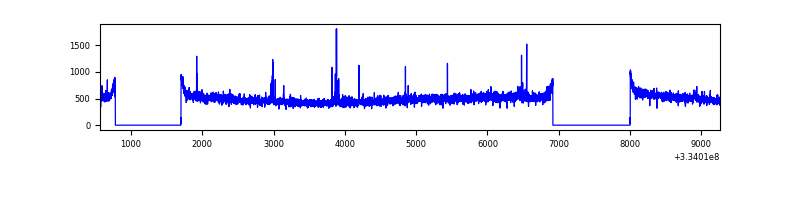 |
| B | 8694 | 6691 | 17 | 17 | 0.20% | 0.25% | 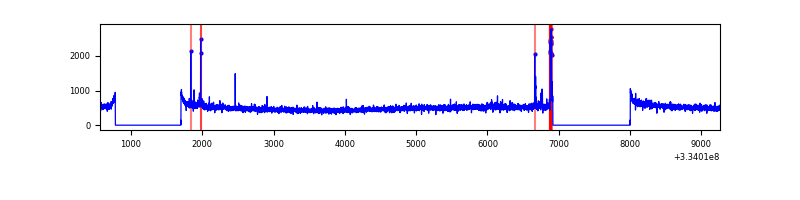 |
| C | 8694 | 6691 | 38 | 38 | 0.44% | 0.57% | 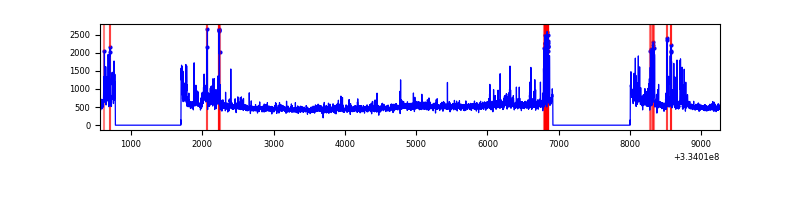 |
| D | 8694 | 6691 | 132 | 132 | 1.52% | 1.97% | 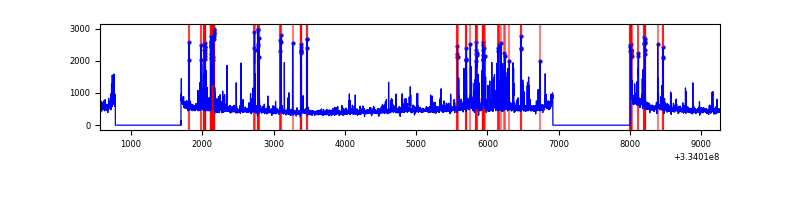 |
Top three noisy pixels from each quadrant. If the there are fewer than three noisy pixels in the level2.evt file, extra rows are filled as -1
| Pixel properties | Quadrant properties | ||||||
|---|---|---|---|---|---|---|---|
| Quadrant | DetID | PixID | Counts | Sigma | Mean | Median | Sigma |
| A | 0 | 13 | 42119 | 241.67 | 855 | 838 | 170.8 |
| A | 13 | 254 | 11177 | 60.53 | 855 | 838 | 170.8 |
| A | 3 | 137 | 7815 | 40.85 | 855 | 838 | 170.8 |
| B | 5 | 172 | 68689 | 416.61 | 849 | 828 | 162.9 |
| B | 12 | 111 | 19400 | 114.02 | 849 | 828 | 162.9 |
| B | 11 | 111 | 17157 | 100.25 | 849 | 828 | 162.9 |
| C | 2 | 16 | 318494 | 1683.31 | 806 | 813 | 188.7 |
| C | 3 | 233 | 275068 | 1453.2 | 806 | 813 | 188.7 |
| C | 14 | 238 | 129696 | 682.92 | 806 | 813 | 188.7 |
| D | 1 | 52 | 600769 | 3077.6 | 810 | 791 | 195.0 |
| D | 12 | 233 | 170671 | 871.4 | 810 | 791 | 195.0 |
| D | 2 | 234 | 29443 | 146.97 | 810 | 791 | 195.0 |
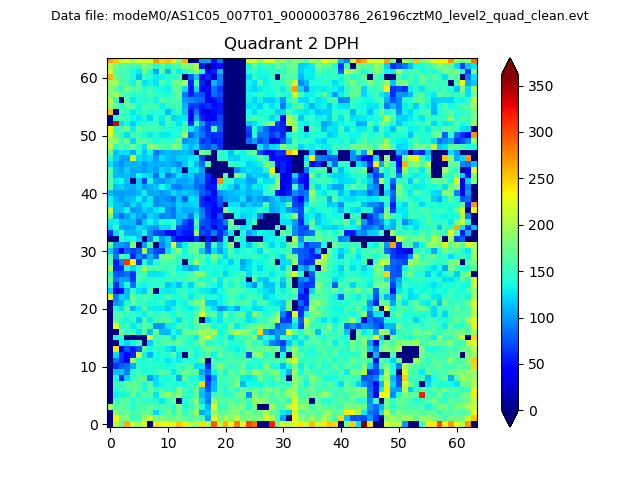
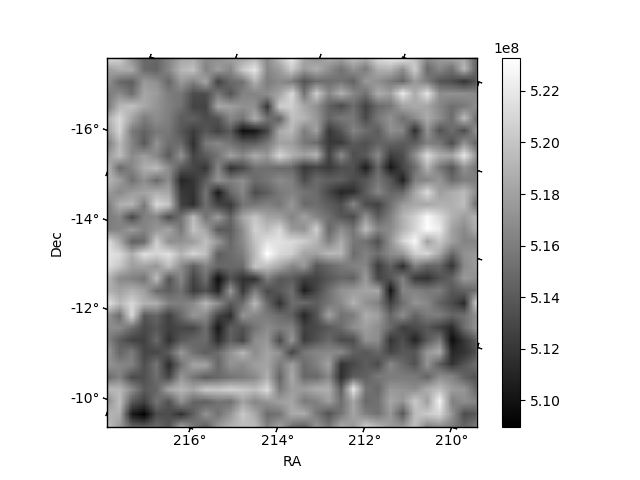
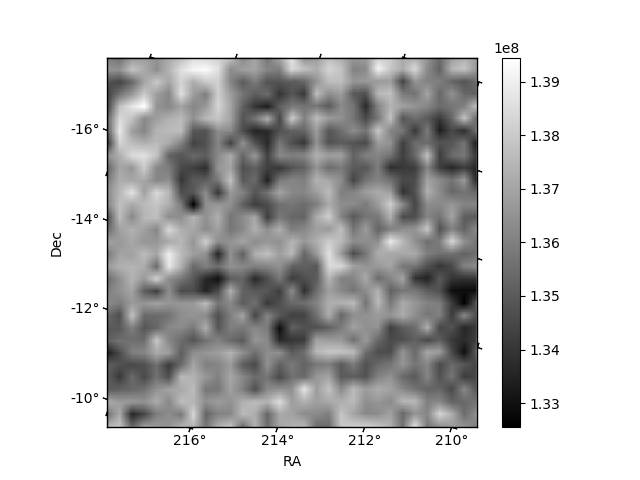
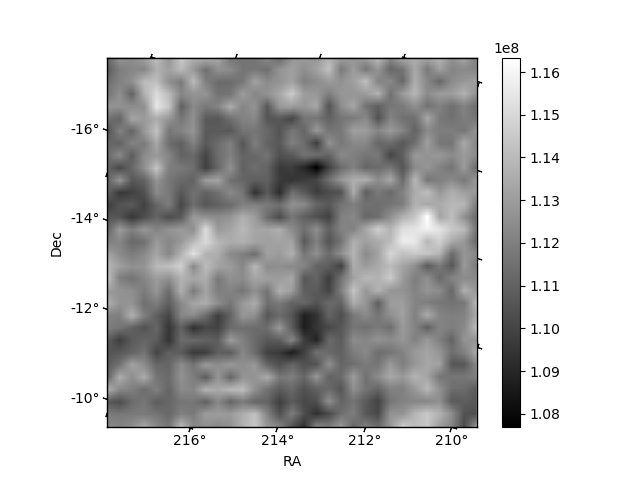
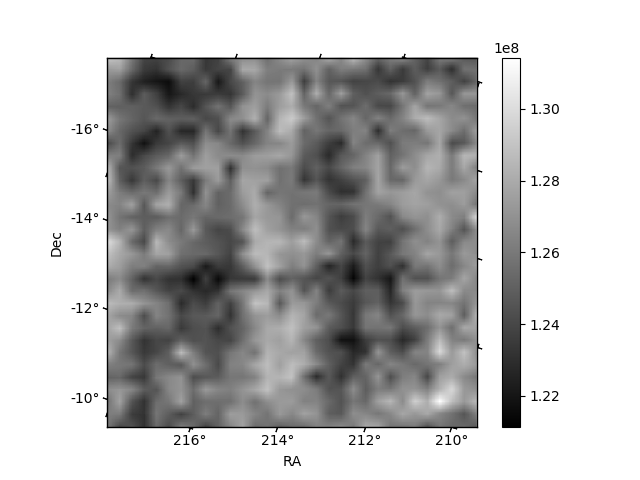
Histogram calculated using DETX and DETY for each event in the final _common_clean file
| Quadrant A | 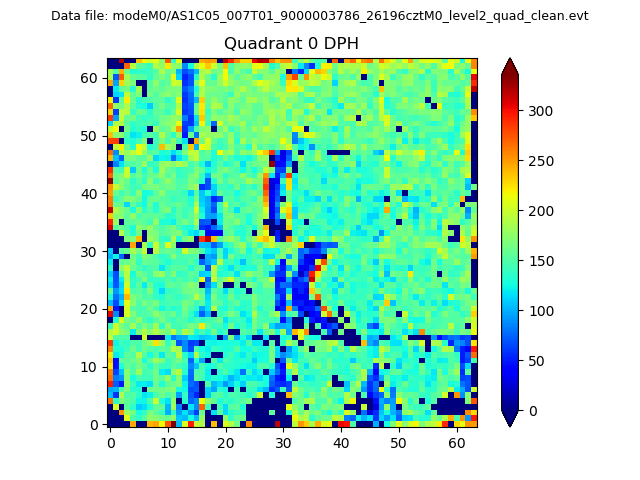 |
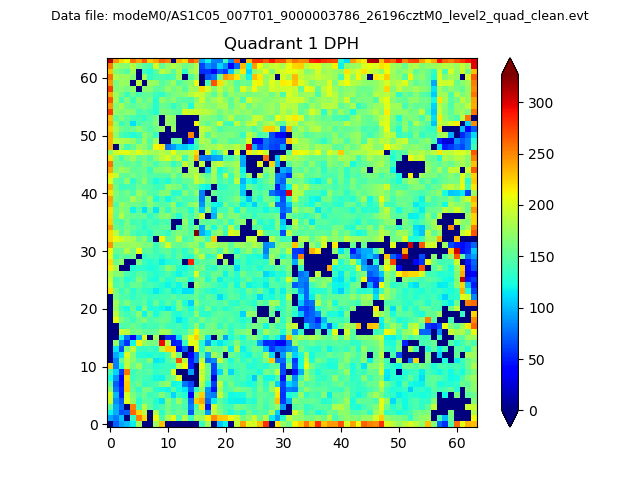 |
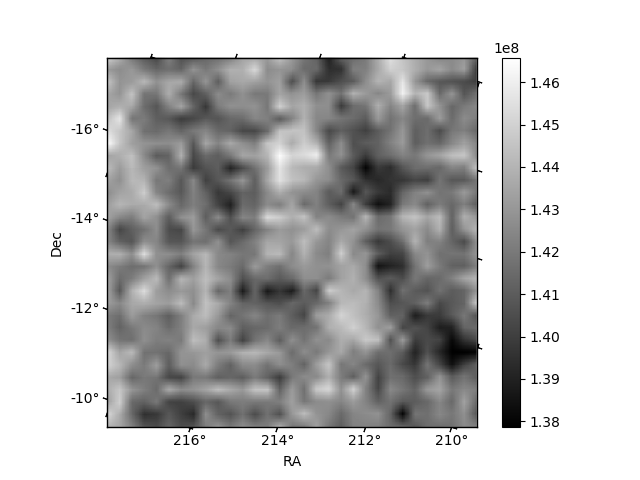
Quadrant B |
|---|---|---|---|
| Quadrant D | 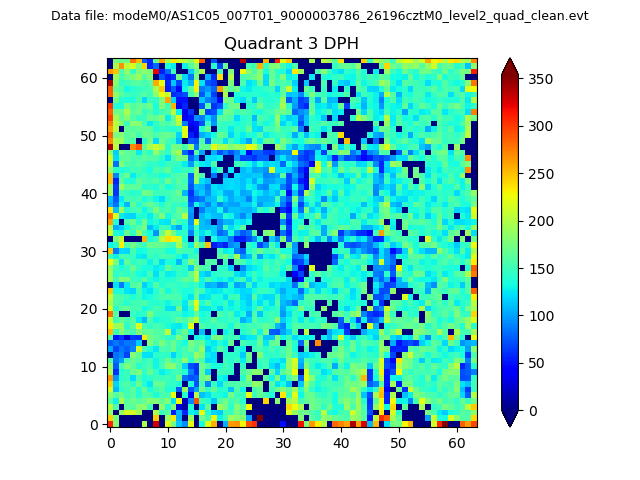 |
 |
Quadrant C |
| Plot type | Count rate plots | Images |
|---|---|---|
| Comparison with Poisson distribution Blue bars denote a histogram of data divided into 1 sec bins. Red curve is a Poisson curve with rate = median count rate of data. |
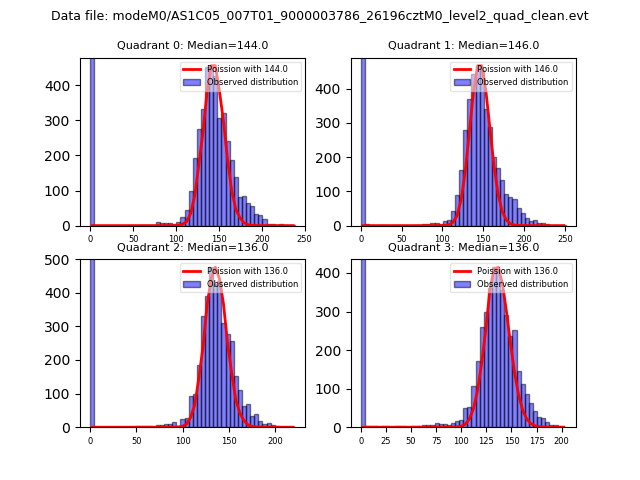 |
 |
| Quadrant-wise count rates Data is divided into 100 sec bins |
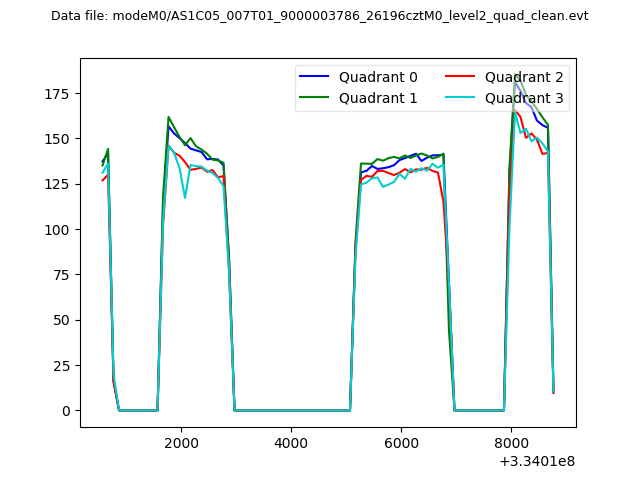 |
|
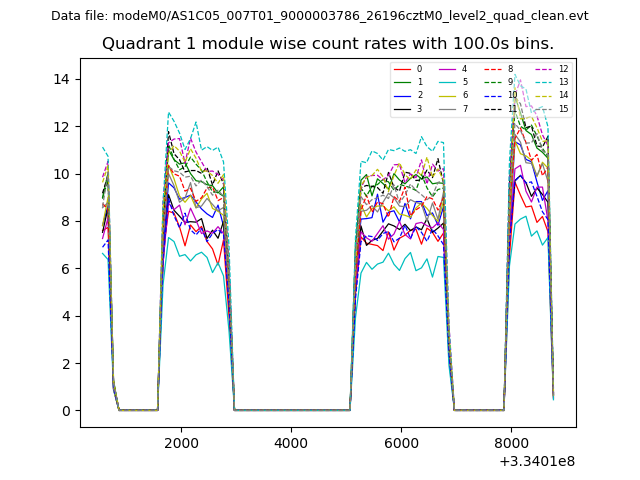
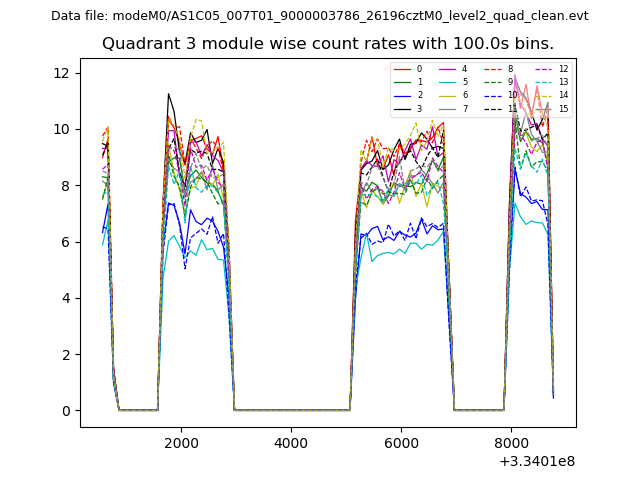
| Module-wise count rates for Quadrant A Data is divided into 100 sec bins |
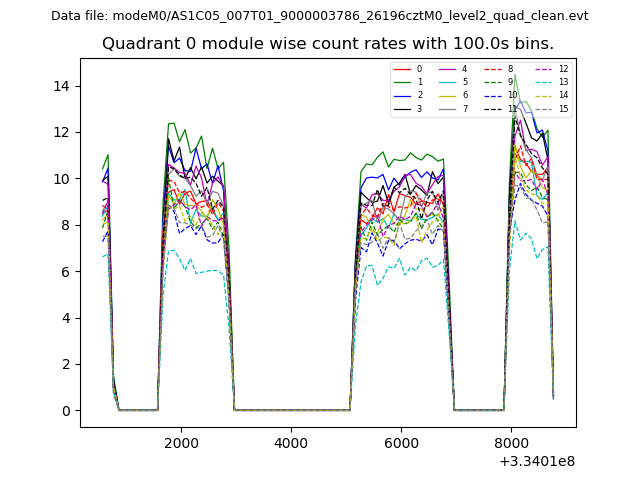 |
 |
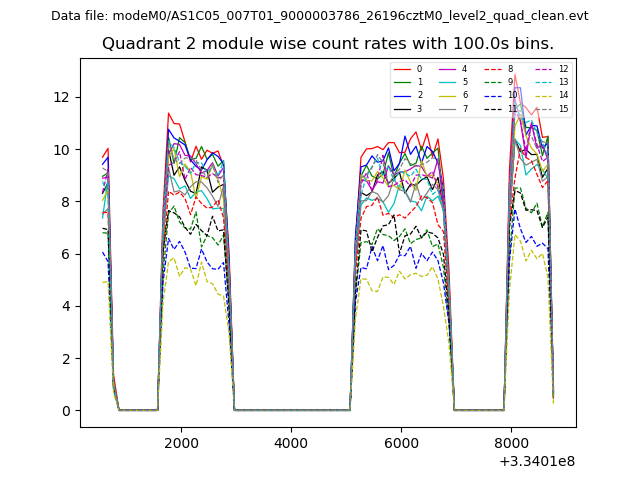
| Module-wise count rates for Quadrant B Data is divided into 100 sec bins |
 |
 |
| Module-wise count rates for Quadrant C Data is divided into 100 sec bins |
 |
 |
| Module-wise count rates for Quadrant D Data is divided into 100 sec bins |
 |
 |
| Parameter | Plot |
|---|---|
| CZT HV Monitor | 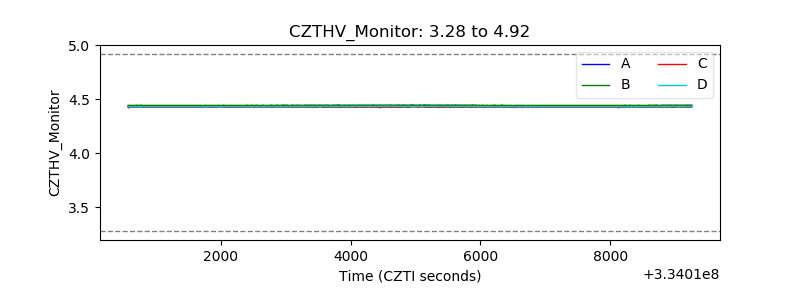 |
| D_VDD | 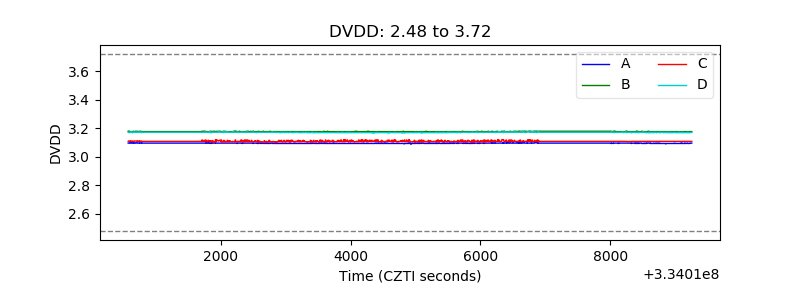 |
| Temperature 1 |  |
| Veto HV Monitor | 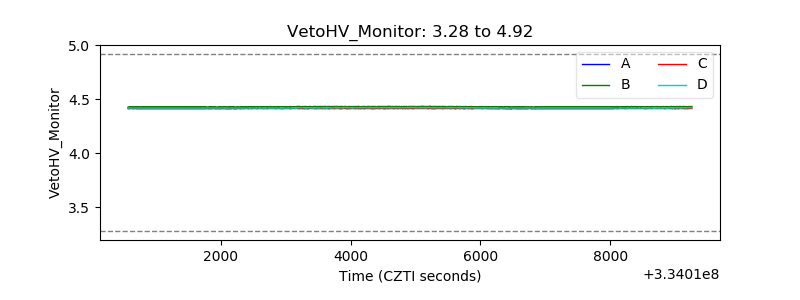 |
| Veto LLD | 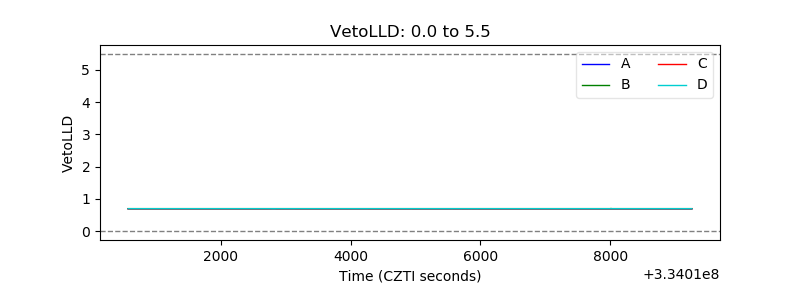 |
| Alpha Counter | 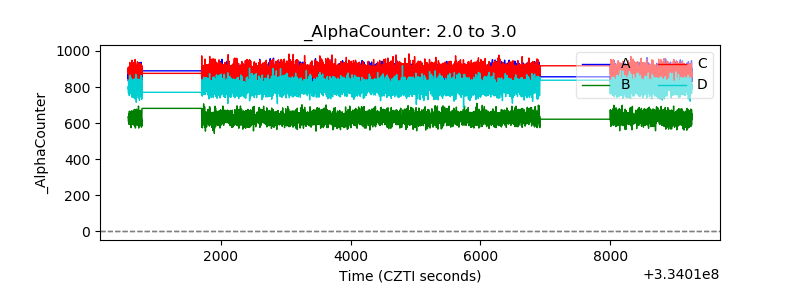 |
| _CPM_Rate | 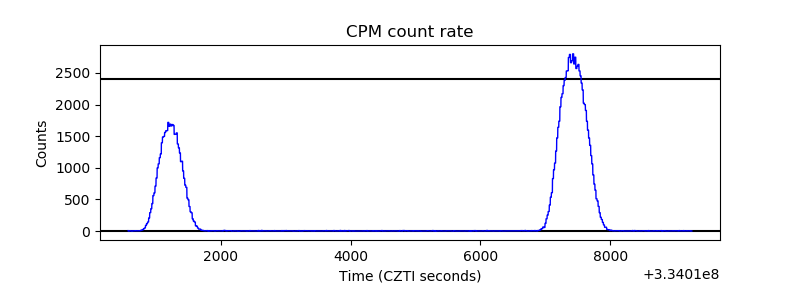 |
| CZT Counter | 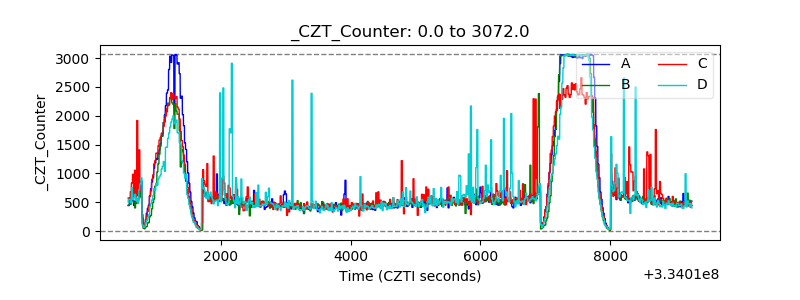 |
| +2.5 Volts monitor | 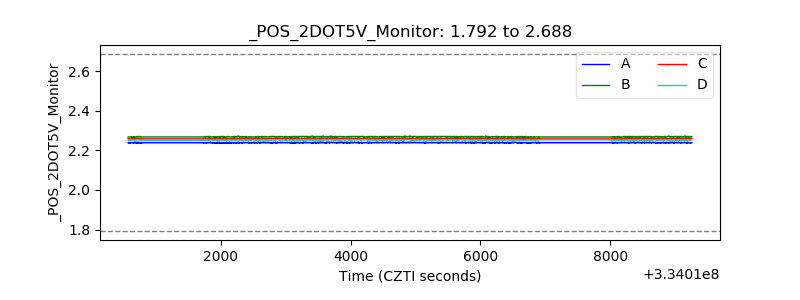 |
| +5 Volts monitor | 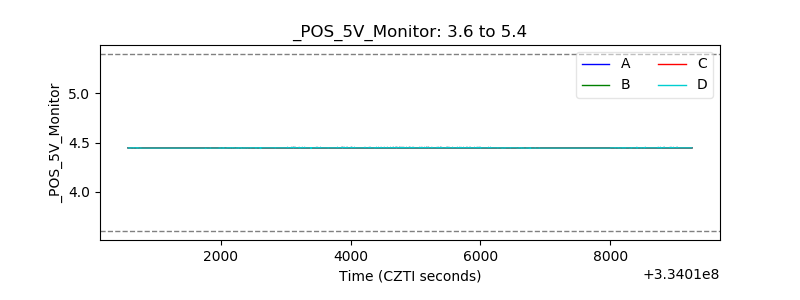 |
| _ROLL_ROT | 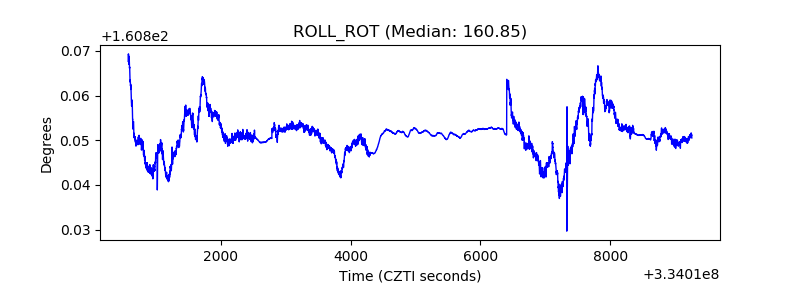 |
| _Roll_DEC | 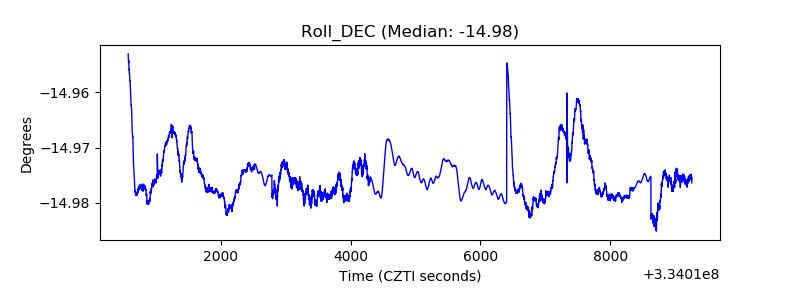 |
| _Roll_RA | 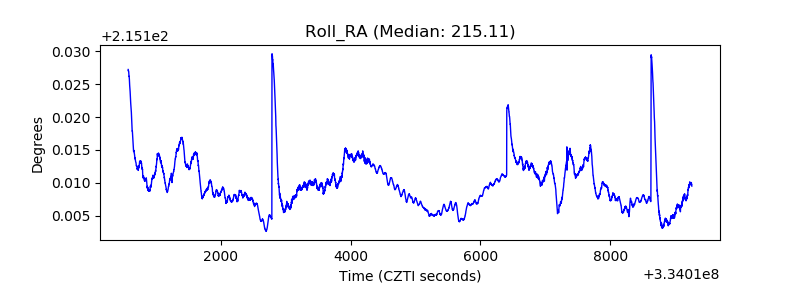 |
| Veto Counter | 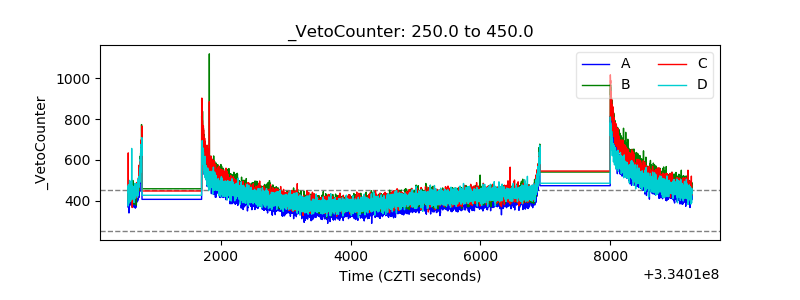 |