| Param | Original file | Final file |
|---|---|---|
| Filename | modeM0/AS1C05_007T01_9000003786_26197cztM0_level2.evt | modeM0/AS1C05_007T01_9000003786_26197cztM0_level2_quad_clean.evt |
| Size (bytes) | 468,429,120 | 73,103,040 |
| Size | 446.7 MB | 69.7 MB |
| Events in quadrant A | 3,194,808 | 459,742 |
| Events in quadrant B | 3,213,596 | 468,364 |
| Events in quadrant C | 3,734,683 | 428,120 |
| Events in quadrant D | 3,623,932 | 426,177 |
| Mode M0 | |||
|---|---|---|---|
| Quadrant | BADHDUFLAG | Total packets | Discarded packets |
| A | 0 | 13072 | 0 |
| B | 0 | 13146 | 0 |
| C | 0 | 14930 | 0 |
| D | 0 | 14756 | 0 |
| Mode M9 | |||
|---|---|---|---|
| Quadrant | BADHDUFLAG | Total packets | Discarded packets |
| A | 0 | 12 | 0 |
| B | 0 | 12 | 0 |
| C | 0 | 12 | 0 |
| D | 0 | 12 | 0 |
| Quadrant | Total seconds | Saturated seconds | Saturation percentage |
|---|---|---|---|
| A | 6174 | 34 | 0.550696% |
| B | 6175 | 41 | 0.663968% |
| C | 6174 | 159 | 2.575316% |
| D | 6174 | 121 | 1.959832% |
Noise dominated data is calculated using 1-second bins in cleaned event files. If a bin has >2000 counts, and if more than 50% of those come from <1% of pixels, then it is considered to be noise-dominated and hence unusable.
| Quadrant | # 1 sec bins | Bins with >0 counts | Bins with >2000 counts | High rate bins dominated by noise | Noise dominated (total time) | Noise dominated (detector-on time) | Marked lightcurve |
|---|---|---|---|---|---|---|---|
| A | 7369 | 6175 | 2 | 2 | 0.03% | 0.03% | 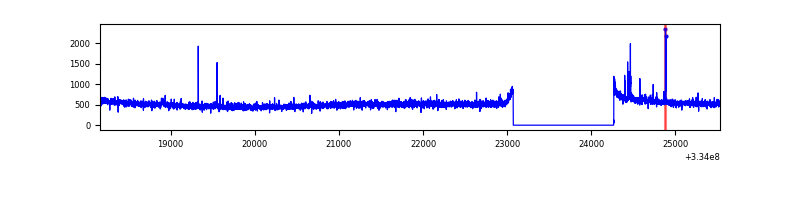 |
| B | 7370 | 6176 | 0 | 0 | 0.00% | 0.00% | 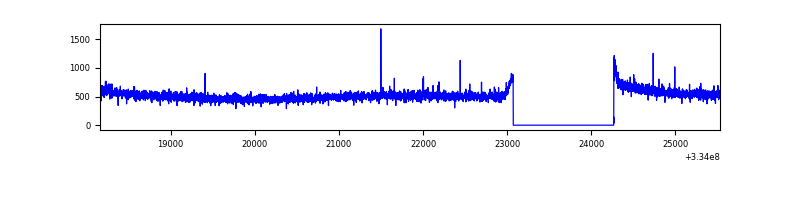 |
| C | 7369 | 6175 | 51 | 51 | 0.69% | 0.83% | 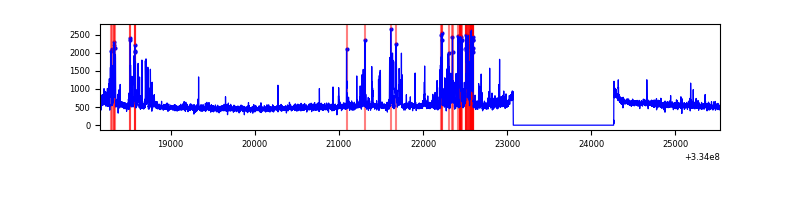 |
| D | 7369 | 6175 | 101 | 101 | 1.37% | 1.64% | 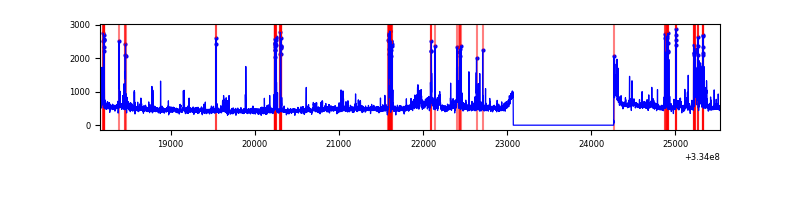 |
Top three noisy pixels from each quadrant. If the there are fewer than three noisy pixels in the level2.evt file, extra rows are filled as -1
| Pixel properties | Quadrant properties | ||||||
|---|---|---|---|---|---|---|---|
| Quadrant | DetID | PixID | Counts | Sigma | Mean | Median | Sigma |
| A | 0 | 13 | 32664 | 194.74 | 821 | 808 | 163.6 |
| A | 13 | 254 | 9580 | 53.62 | 821 | 808 | 163.6 |
| A | 0 | 226 | 7162 | 38.84 | 821 | 808 | 163.6 |
| B | 12 | 111 | 18221 | 111.91 | 820 | 801 | 155.7 |
| B | 11 | 111 | 16371 | 100.03 | 820 | 801 | 155.7 |
| B | 14 | 111 | 15009 | 91.28 | 820 | 801 | 155.7 |
| C | 2 | 16 | 519480 | 2894.37 | 773 | 779 | 179.2 |
| C | 14 | 238 | 125168 | 694.09 | 773 | 779 | 179.2 |
| C | 3 | 233 | 76412 | 422.03 | 773 | 779 | 179.2 |
| D | 1 | 52 | 622627 | 3362.06 | 773 | 757 | 185.0 |
| D | 12 | 233 | 39892 | 211.58 | 773 | 757 | 185.0 |
| D | 2 | 234 | 26317 | 138.19 | 773 | 757 | 185.0 |
Histogram calculated using DETX and DETY for each event in the final _common_clean file
| Quadrant A | 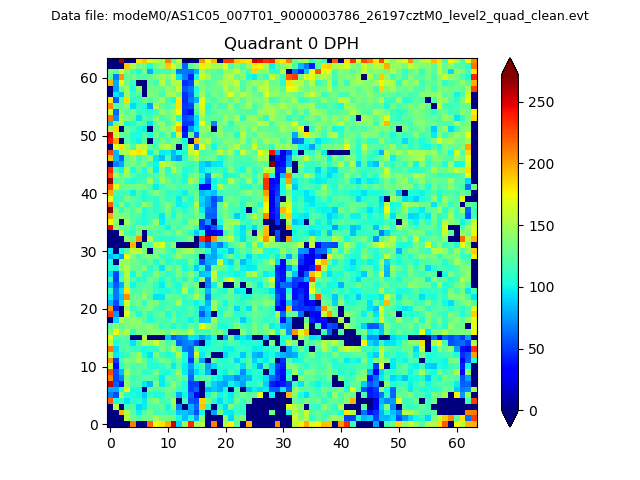 |
 |
Quadrant B |
|---|---|---|---|
| Quadrant D | 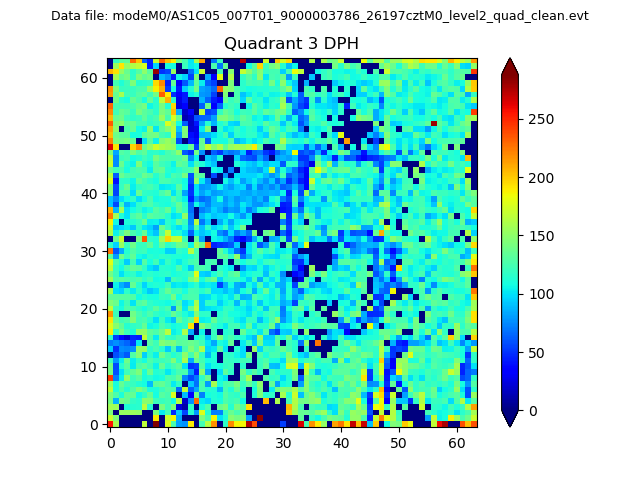 |
 |
Quadrant C |
| Plot type | Count rate plots | Images |
|---|---|---|
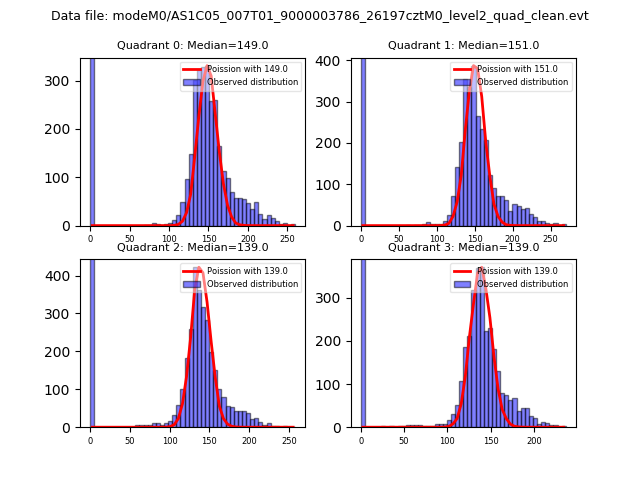
| Comparison with Poisson distribution Blue bars denote a histogram of data divided into 1 sec bins. Red curve is a Poisson curve with rate = median count rate of data. |
 |
 |
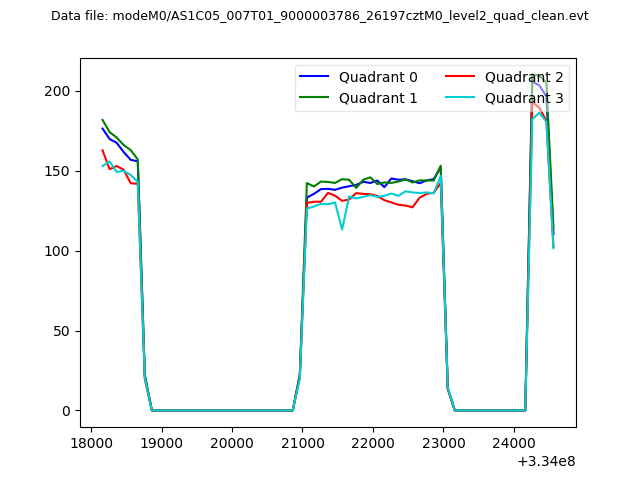
| Quadrant-wise count rates Data is divided into 100 sec bins |
 |
|
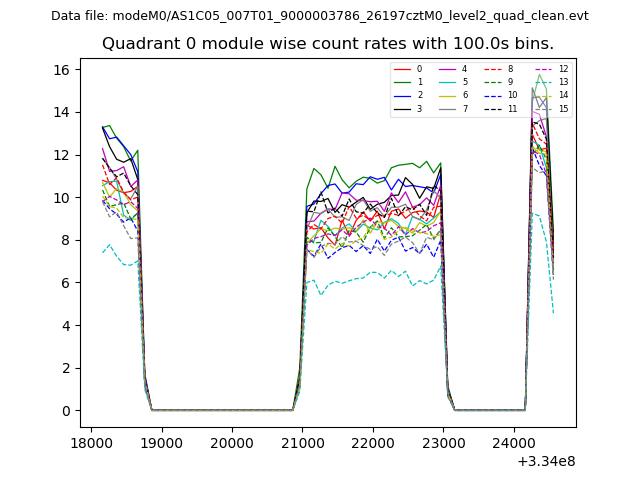
| Module-wise count rates for Quadrant A Data is divided into 100 sec bins |
 |
 |
| Module-wise count rates for Quadrant B Data is divided into 100 sec bins |
 |
 |
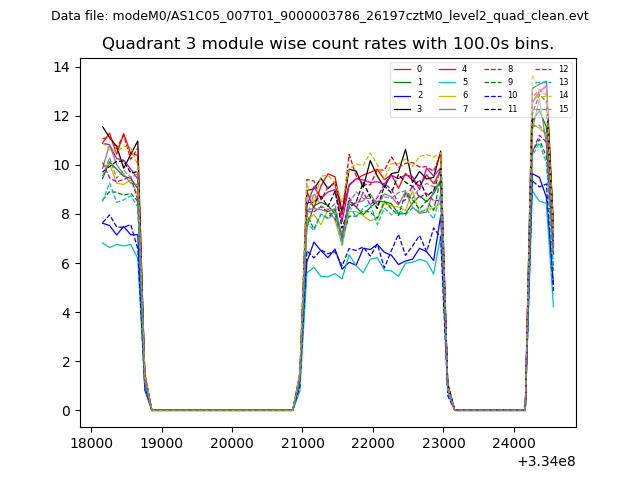
| Module-wise count rates for Quadrant C Data is divided into 100 sec bins |
 |
 |
| Module-wise count rates for Quadrant D Data is divided into 100 sec bins |
 |
 |
| Parameter | Plot |
|---|---|
| CZT HV Monitor |  |
| D_VDD | 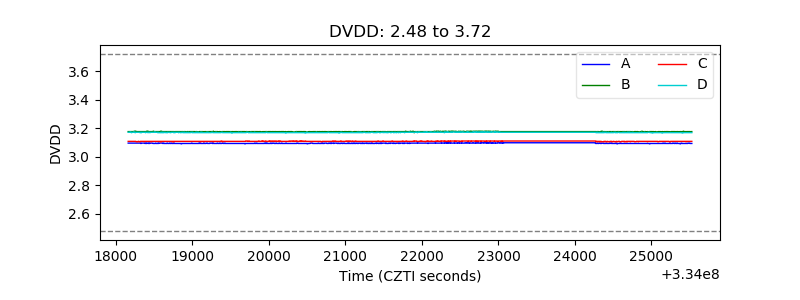 |
| Temperature 1 | 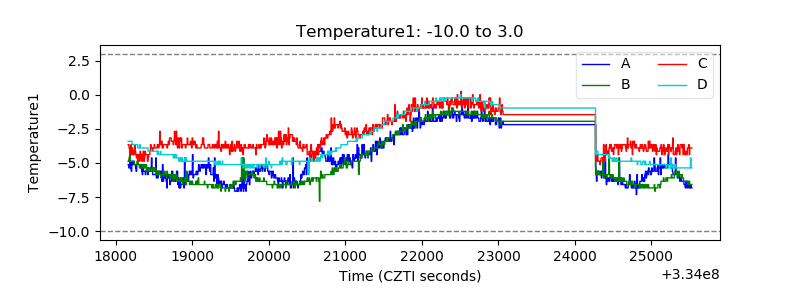 |
| Veto HV Monitor | 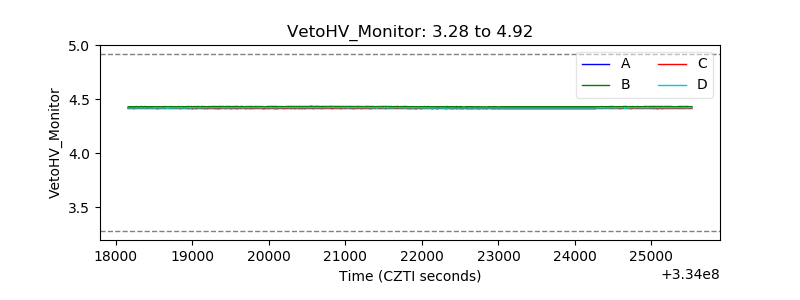 |
| Veto LLD | 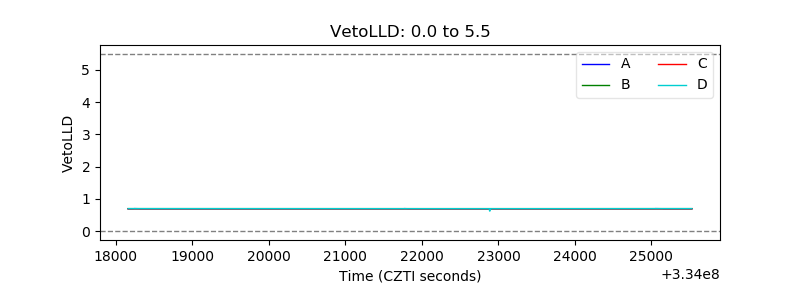 |
| Alpha Counter | 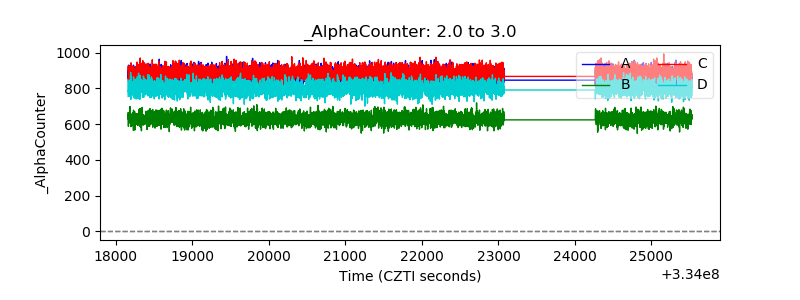 |
| _CPM_Rate | 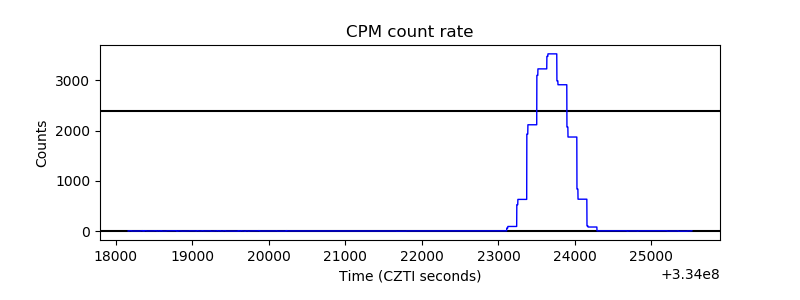 |
| CZT Counter |  |
| +2.5 Volts monitor |  |
| +5 Volts monitor | 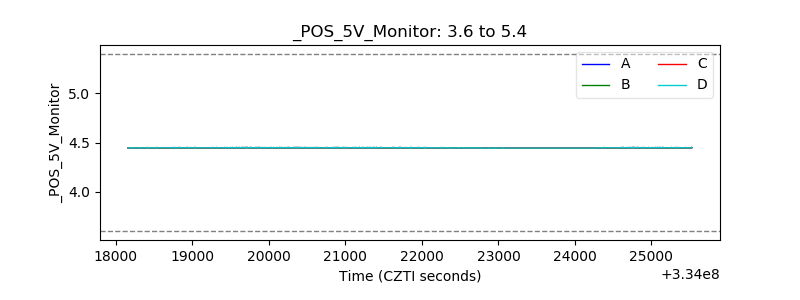 |
| _ROLL_ROT | 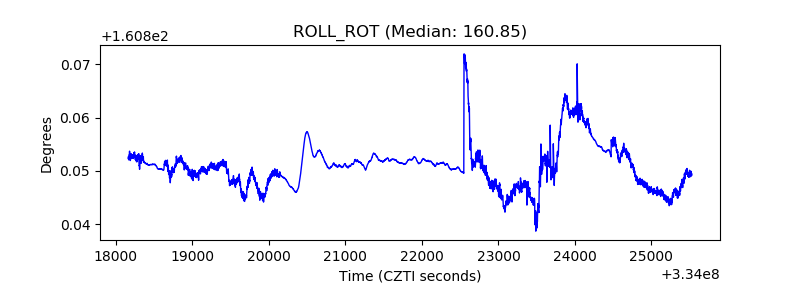 |
| _Roll_DEC | 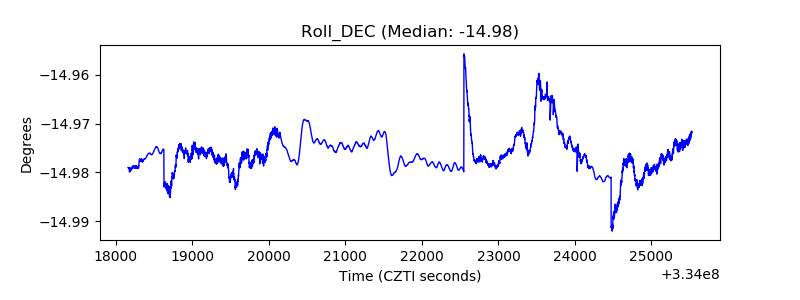 |
| _Roll_RA | 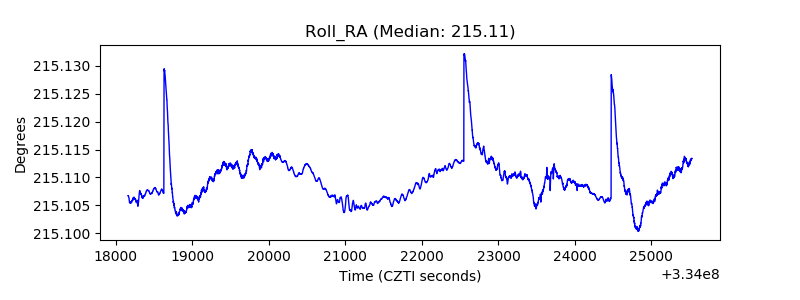 |
| Veto Counter | 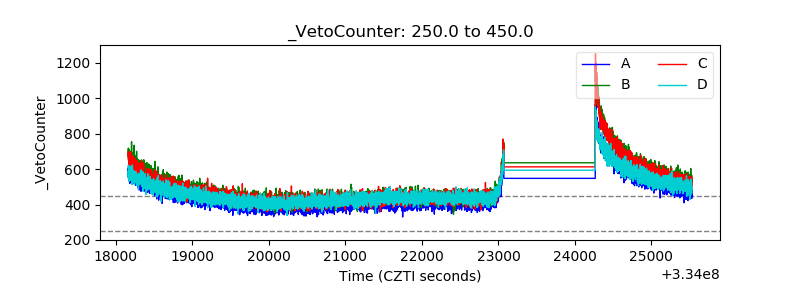 |