| Param | Original file | Final file |
|---|---|---|
| Filename | modeM0/AS1C05_007T01_9000003786_26199cztM0_level2.evt | modeM0/AS1C05_007T01_9000003786_26199cztM0_level2_quad_clean.evt |
| Size (bytes) | 520,081,920 | 67,700,160 |
| Size | 496.0 MB | 64.6 MB |
| Events in quadrant A | 3,726,029 | 413,969 |
| Events in quadrant B | 3,667,297 | 420,197 |
| Events in quadrant C | 3,652,686 | 391,806 |
| Events in quadrant D | 4,274,177 | 380,522 |
| Mode M0 | |||
|---|---|---|---|
| Quadrant | BADHDUFLAG | Total packets | Discarded packets |
| A | 0 | 14865 | 0 |
| B | 0 | 14718 | 0 |
| C | 0 | 14702 | 0 |
| D | 0 | 16630 | 0 |
| Mode M9 | |||
|---|---|---|---|
| Quadrant | BADHDUFLAG | Total packets | Discarded packets |
| A | 0 | 14 | 0 |
| B | 0 | 15 | 0 |
| C | 0 | 15 | 0 |
| D | 0 | 15 | 0 |
| Quadrant | Total seconds | Saturated seconds | Saturation percentage |
|---|---|---|---|
| A | 6355 | 107 | 1.683714% |
| B | 6355 | 100 | 1.573564% |
| C | 6354 | 147 | 2.313503% |
| D | 6354 | 252 | 3.966006% |
Noise dominated data is calculated using 1-second bins in cleaned event files. If a bin has >2000 counts, and if more than 50% of those come from <1% of pixels, then it is considered to be noise-dominated and hence unusable.
| Quadrant | # 1 sec bins | Bins with >0 counts | Bins with >2000 counts | High rate bins dominated by noise | Noise dominated (total time) | Noise dominated (detector-on time) | Marked lightcurve |
|---|---|---|---|---|---|---|---|
| A | 7710 | 6356 | 9 | 9 | 0.12% | 0.14% | 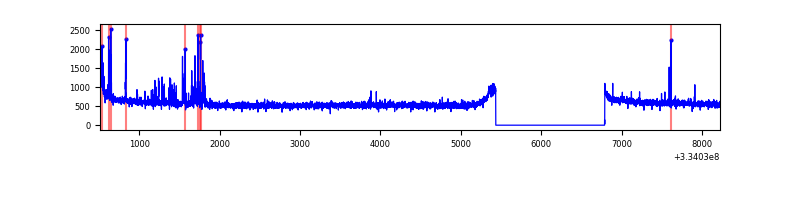 |
| B | 7710 | 6356 | 0 | 0 | 0.00% | 0.00% | 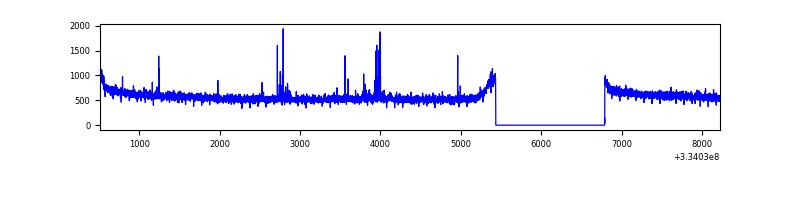 |
| C | 7709 | 6355 | 4 | 4 | 0.05% | 0.06% | 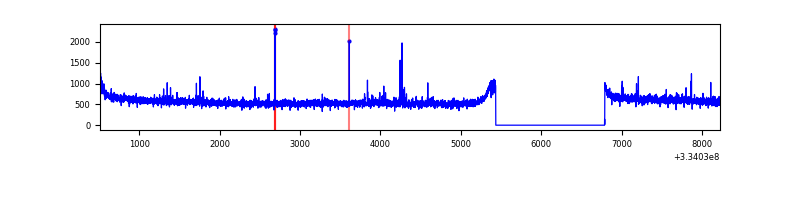 |
| D | 7709 | 6355 | 182 | 182 | 2.36% | 2.86% | 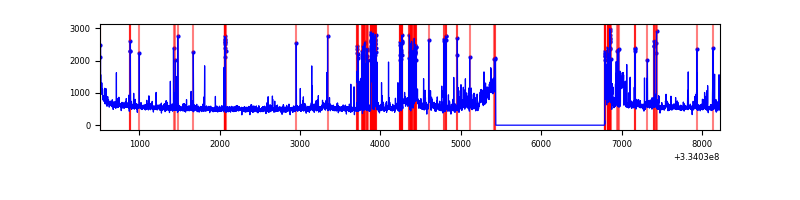 |
Top three noisy pixels from each quadrant. If the there are fewer than three noisy pixels in the level2.evt file, extra rows are filled as -1
| Pixel properties | Quadrant properties | ||||||
|---|---|---|---|---|---|---|---|
| Quadrant | DetID | PixID | Counts | Sigma | Mean | Median | Sigma |
| A | 0 | 13 | 144145 | 779.8 | 930 | 917 | 183.7 |
| A | 13 | 254 | 9647 | 47.53 | 930 | 917 | 183.7 |
| A | 0 | 226 | 7876 | 37.89 | 930 | 917 | 183.7 |
| B | 0 | 190 | 38975 | 220.95 | 926 | 907 | 172.3 |
| B | 12 | 111 | 20152 | 111.7 | 926 | 907 | 172.3 |
| B | 11 | 111 | 17968 | 99.02 | 926 | 907 | 172.3 |
| C | 14 | 238 | 143997 | 705.64 | 880 | 887 | 202.8 |
| C | 2 | 16 | 41741 | 201.44 | 880 | 887 | 202.8 |
| C | 3 | 233 | 40564 | 195.64 | 880 | 887 | 202.8 |
| D | 1 | 52 | 900074 | 4323.05 | 875 | 856 | 208.0 |
| D | 12 | 233 | 59601 | 282.42 | 875 | 856 | 208.0 |
| D | 2 | 234 | 23207 | 107.45 | 875 | 856 | 208.0 |
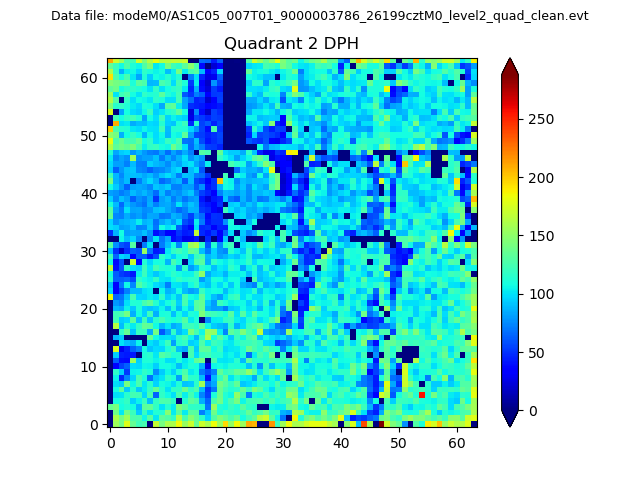
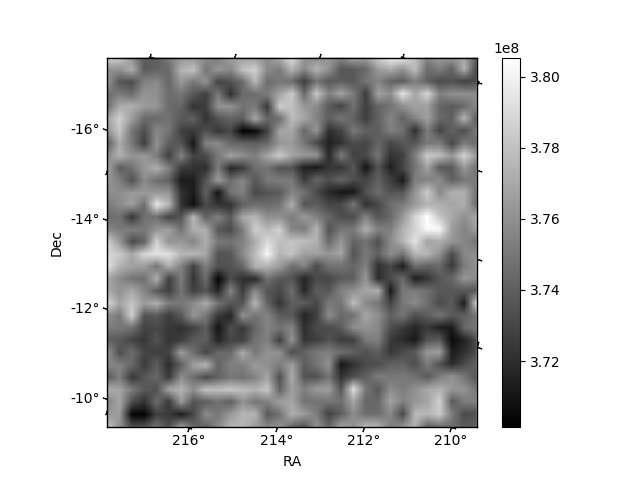
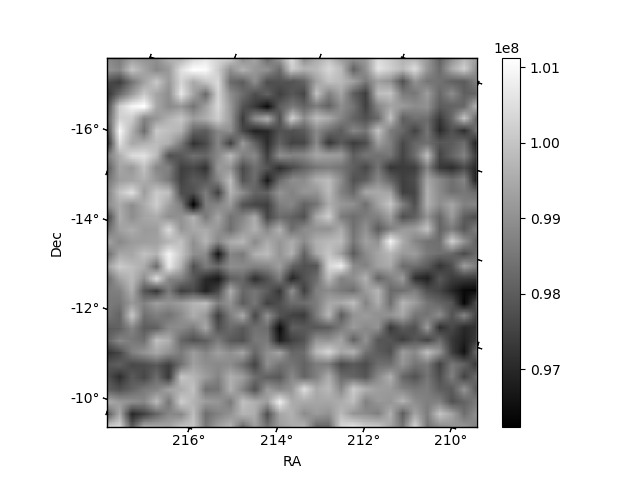
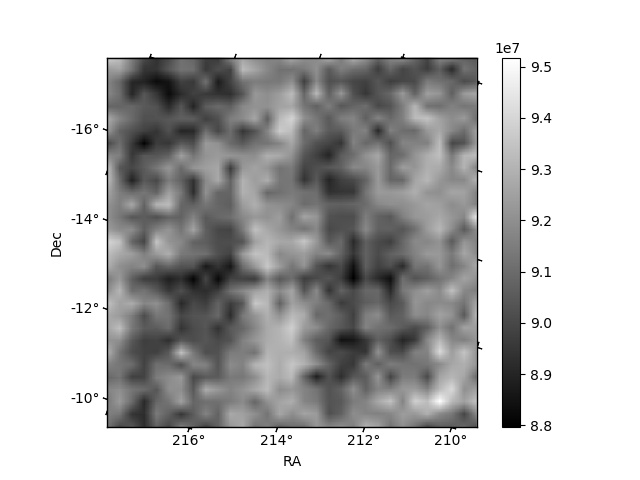
Histogram calculated using DETX and DETY for each event in the final _common_clean file
| Quadrant A | 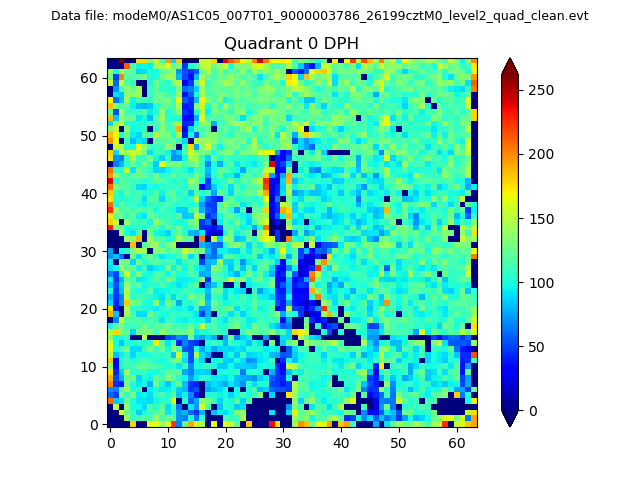 |
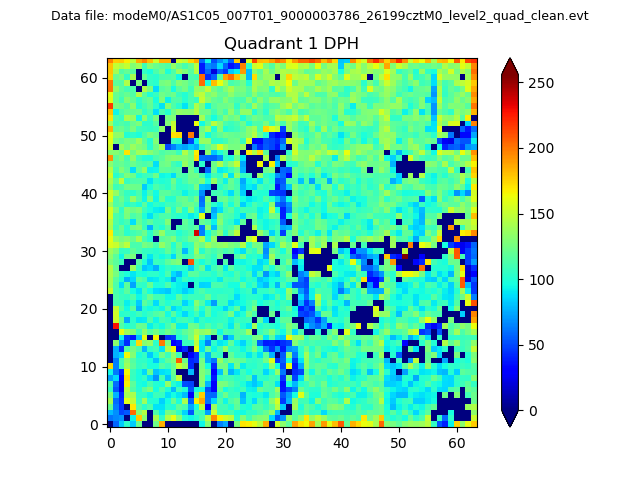 |
Quadrant B |
|---|---|---|---|
| Quadrant D | 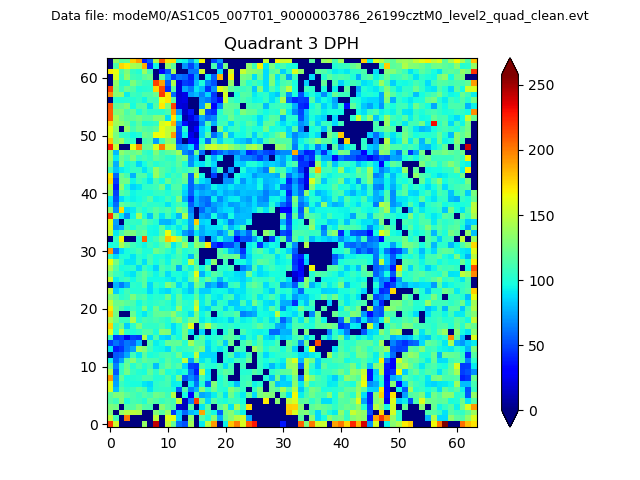 |
 |
Quadrant C |
| Plot type | Count rate plots | Images |
|---|---|---|
| Comparison with Poisson distribution Blue bars denote a histogram of data divided into 1 sec bins. Red curve is a Poisson curve with rate = median count rate of data. |
 |
 |
| Quadrant-wise count rates Data is divided into 100 sec bins |
 |
|
| Module-wise count rates for Quadrant A Data is divided into 100 sec bins |
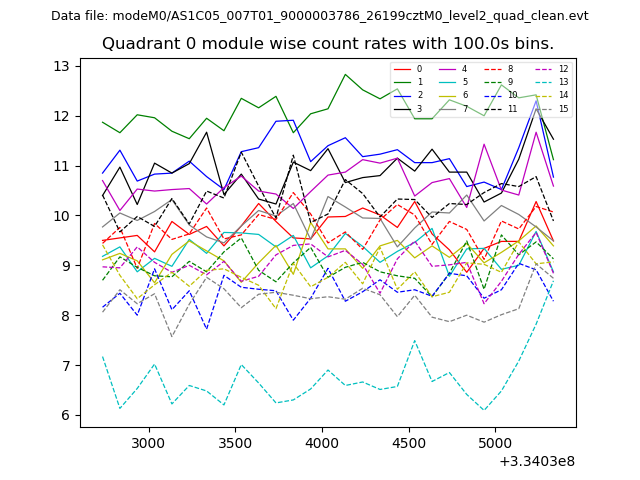 |
 |
| Module-wise count rates for Quadrant B Data is divided into 100 sec bins |
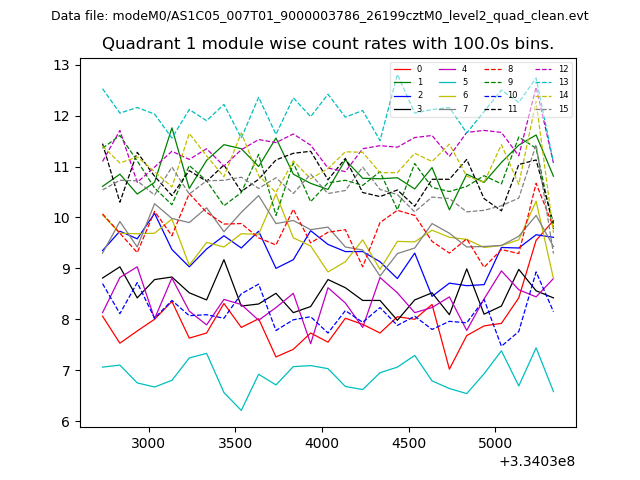 |
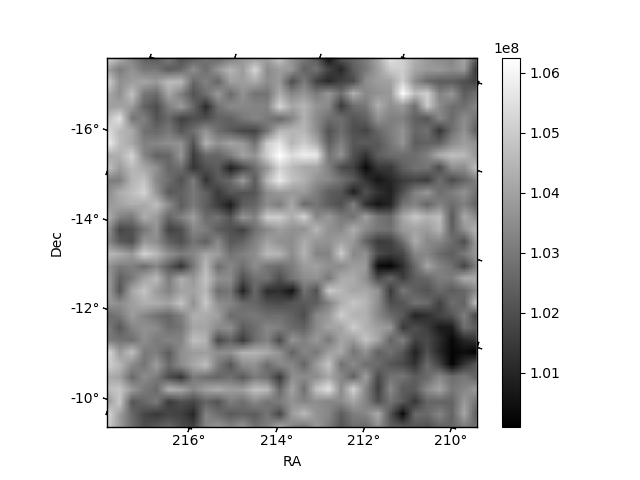 |
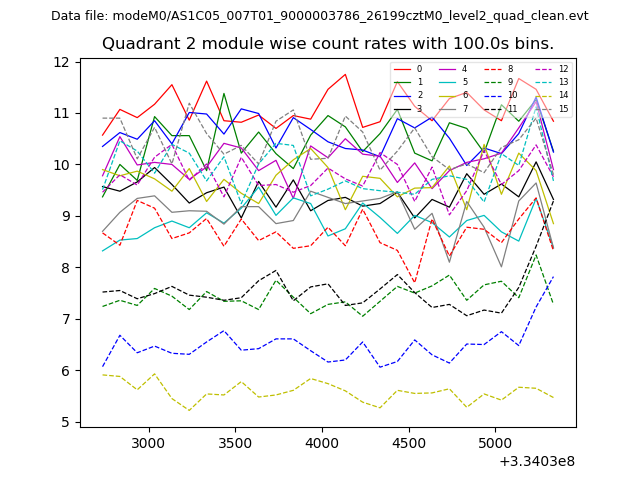
| Module-wise count rates for Quadrant C Data is divided into 100 sec bins |
 |
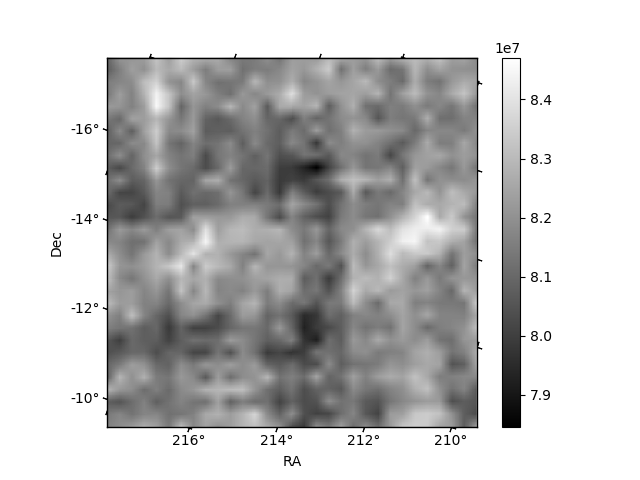 |
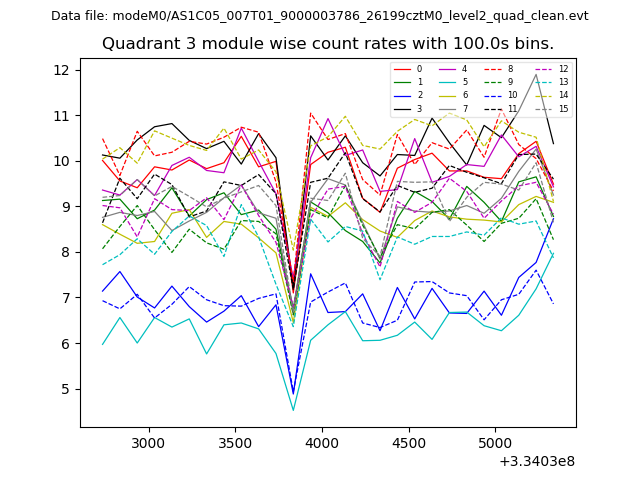
| Module-wise count rates for Quadrant D Data is divided into 100 sec bins |
 |
 |
| Parameter | Plot |
|---|---|
| CZT HV Monitor | 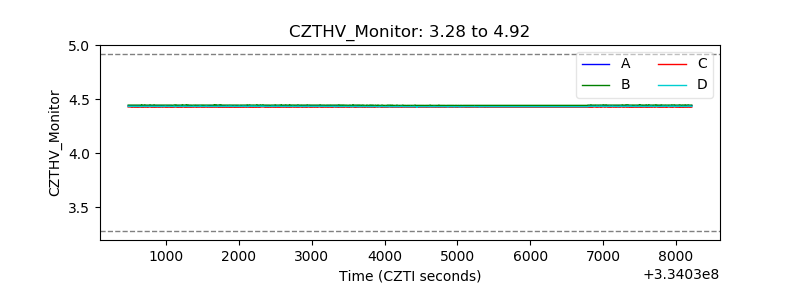 |
| D_VDD | 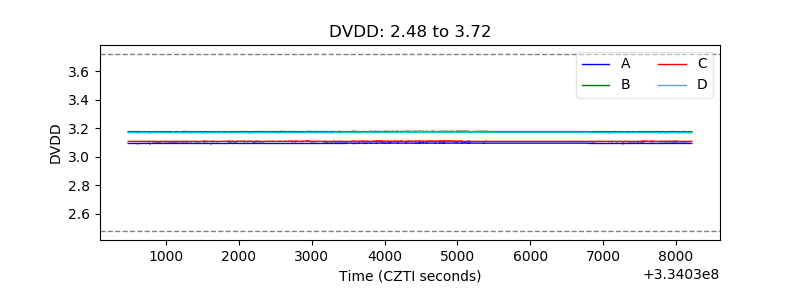 |
| Temperature 1 | 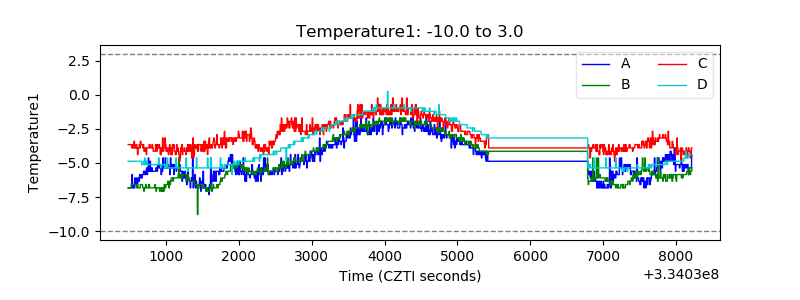 |
| Veto HV Monitor | 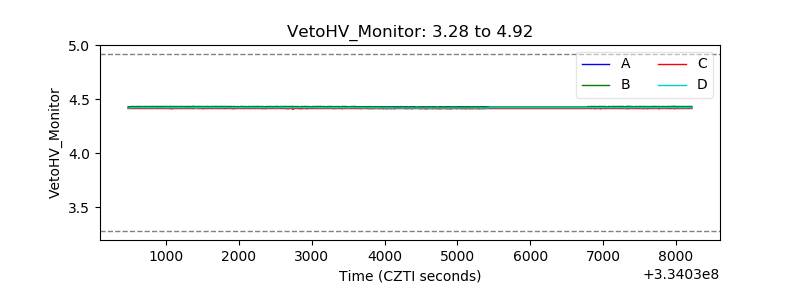 |
| Veto LLD | 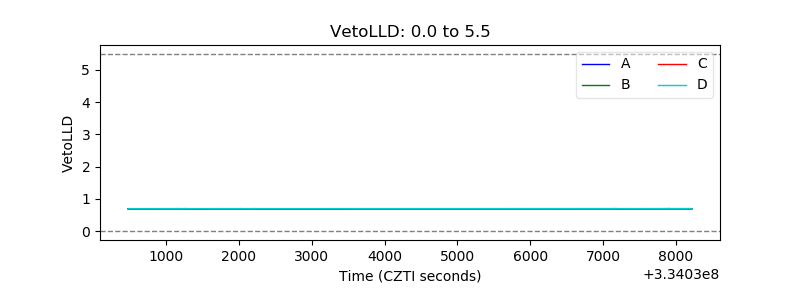 |
| Alpha Counter | 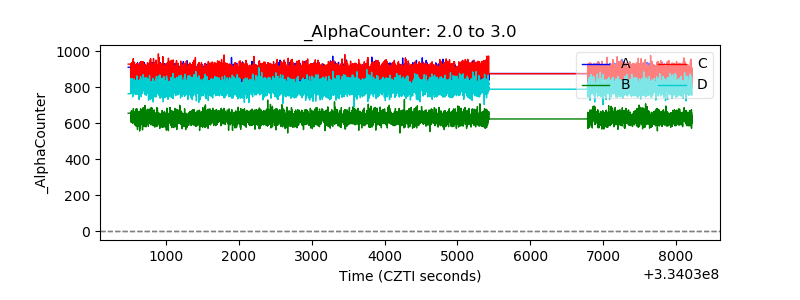 |
| _CPM_Rate |  |
| CZT Counter | 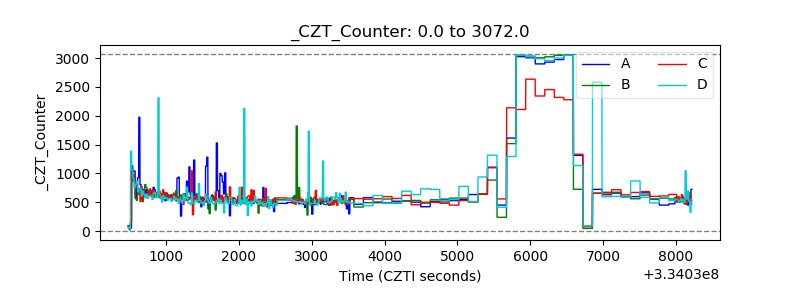 |
| +2.5 Volts monitor |  |
| +5 Volts monitor |  |
| _ROLL_ROT | 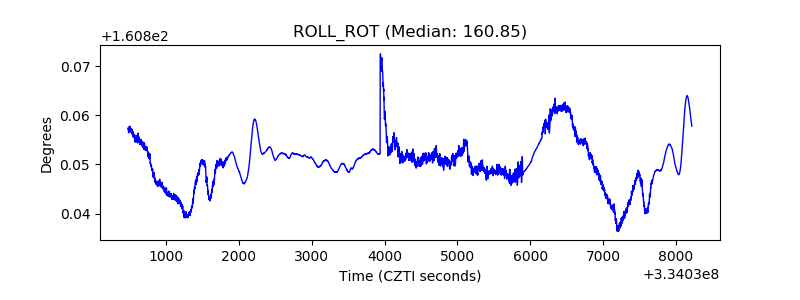 |
| _Roll_DEC | 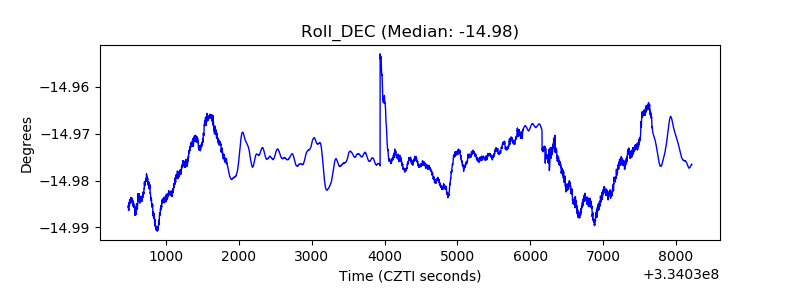 |
| _Roll_RA | 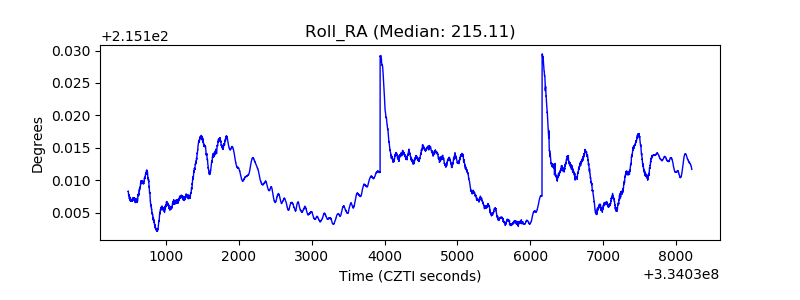 |
| Veto Counter | 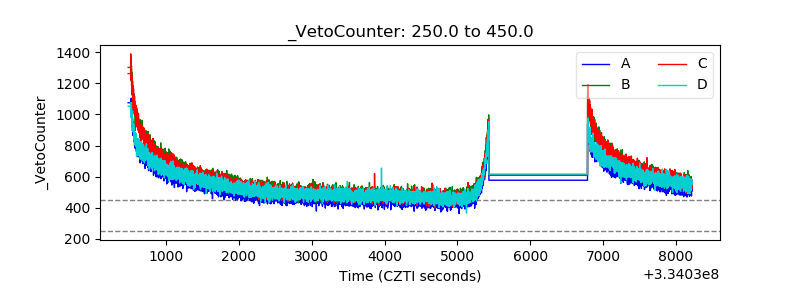 |