| Param | Original file | Final file |
|---|---|---|
| Filename | modeM0/AS1C05_007T01_9000003786_26201cztM0_level2.evt | modeM0/AS1C05_007T01_9000003786_26201cztM0_level2_quad_clean.evt |
| Size (bytes) | 527,950,080 | 91,131,840 |
| Size | 503.5 MB | 86.9 MB |
| Events in quadrant A | 3,716,959 | 596,396 |
| Events in quadrant B | 3,540,540 | 600,165 |
| Events in quadrant C | 3,561,723 | 562,576 |
| Events in quadrant D | 4,733,077 | 551,384 |
| Mode M0 | |||
|---|---|---|---|
| Quadrant | BADHDUFLAG | Total packets | Discarded packets |
| A | 0 | 14810 | 0 |
| B | 0 | 14231 | 0 |
| C | 0 | 14323 | 0 |
| D | 0 | 18464 | 0 |
| Mode M9 | |||
|---|---|---|---|
| Quadrant | BADHDUFLAG | Total packets | Discarded packets |
| A | 0 | 16 | 0 |
| B | 0 | 17 | 0 |
| C | 0 | 17 | 0 |
| D | 0 | 17 | 0 |
| Quadrant | Total seconds | Saturated seconds | Saturation percentage |
|---|---|---|---|
| A | 6442 | 182 | 2.825210% |
| B | 6442 | 150 | 2.328469% |
| C | 6442 | 203 | 3.151195% |
| D | 6442 | 269 | 4.175722% |
Noise dominated data is calculated using 1-second bins in cleaned event files. If a bin has >2000 counts, and if more than 50% of those come from <1% of pixels, then it is considered to be noise-dominated and hence unusable.
| Quadrant | # 1 sec bins | Bins with >0 counts | Bins with >2000 counts | High rate bins dominated by noise | Noise dominated (total time) | Noise dominated (detector-on time) | Marked lightcurve |
|---|---|---|---|---|---|---|---|
| A | 7627 | 6443 | 25 | 25 | 0.33% | 0.39% | 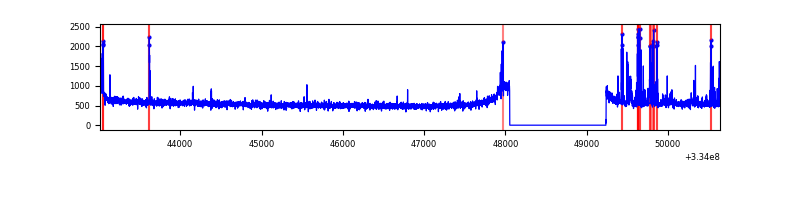 |
| B | 7627 | 6443 | 0 | 0 | 0.00% | 0.00% | 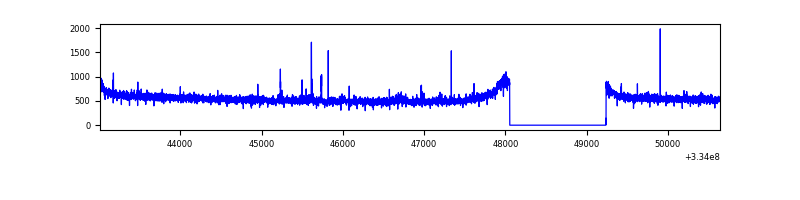 |
| C | 7627 | 6443 | 0 | 0 | 0.00% | 0.00% | 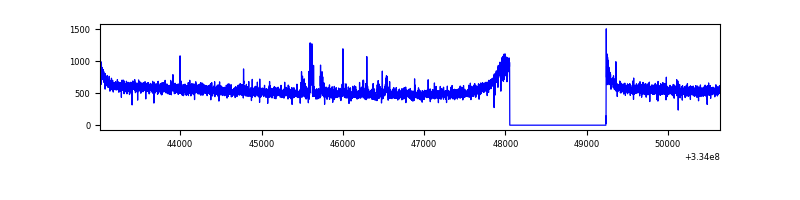 |
| D | 7627 | 6443 | 158 | 158 | 2.07% | 2.45% | 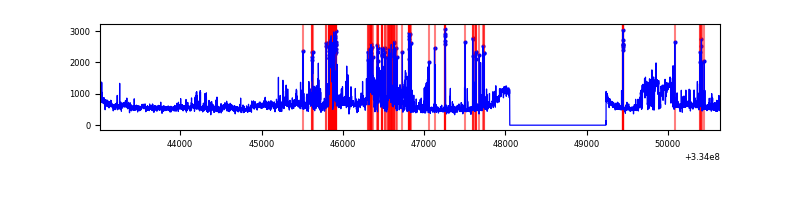 |
Top three noisy pixels from each quadrant. If the there are fewer than three noisy pixels in the level2.evt file, extra rows are filled as -1
| Pixel properties | Quadrant properties | ||||||
|---|---|---|---|---|---|---|---|
| Quadrant | DetID | PixID | Counts | Sigma | Mean | Median | Sigma |
| A | 0 | 13 | 212908 | 1176.42 | 909 | 894 | 180.2 |
| A | 13 | 254 | 9557 | 48.07 | 909 | 894 | 180.2 |
| A | 3 | 137 | 7892 | 38.83 | 909 | 894 | 180.2 |
| B | 0 | 190 | 38324 | 221.25 | 896 | 876 | 169.3 |
| B | 12 | 111 | 20050 | 113.28 | 896 | 876 | 169.3 |
| B | 11 | 111 | 18149 | 102.05 | 896 | 876 | 169.3 |
| C | 14 | 238 | 140913 | 700.52 | 860 | 865 | 199.9 |
| C | 3 | 233 | 63874 | 315.17 | 860 | 865 | 199.9 |
| C | 13 | 61 | 5981 | 25.59 | 860 | 865 | 199.9 |
| D | 1 | 52 | 1122984 | 5432.3 | 868 | 849 | 206.6 |
| D | 12 | 233 | 303698 | 1466.11 | 868 | 849 | 206.6 |
| D | 2 | 234 | 22258 | 103.64 | 868 | 849 | 206.6 |
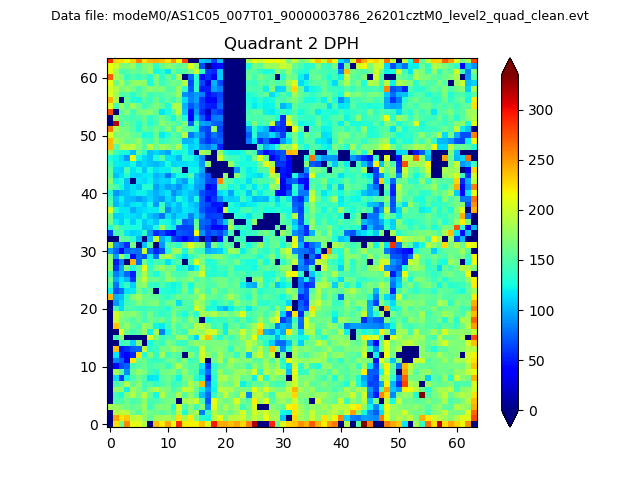
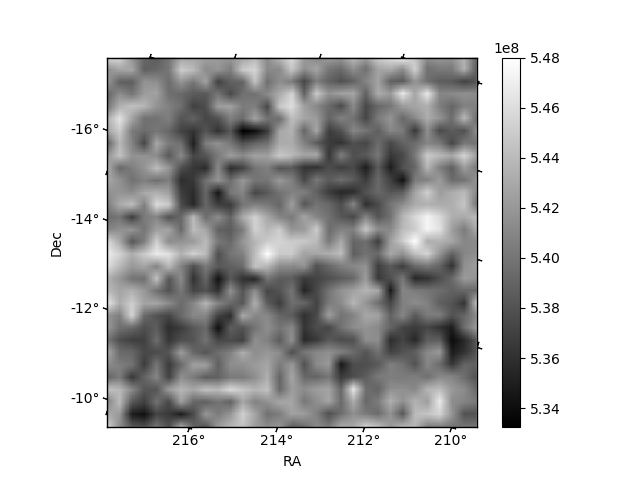
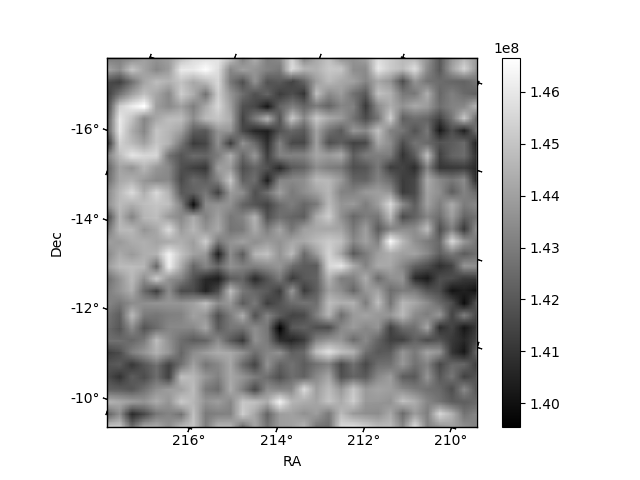
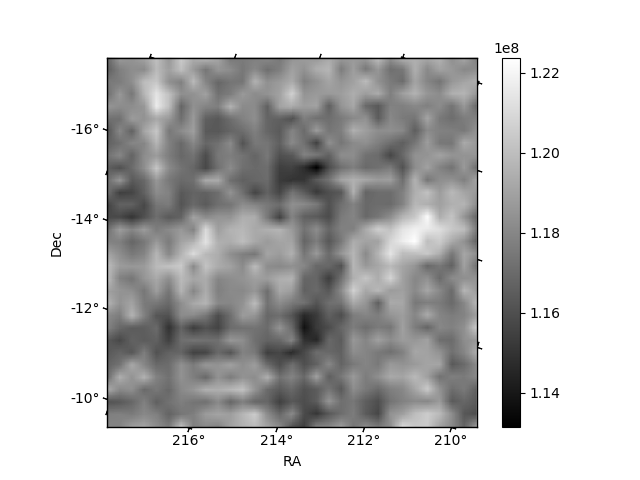
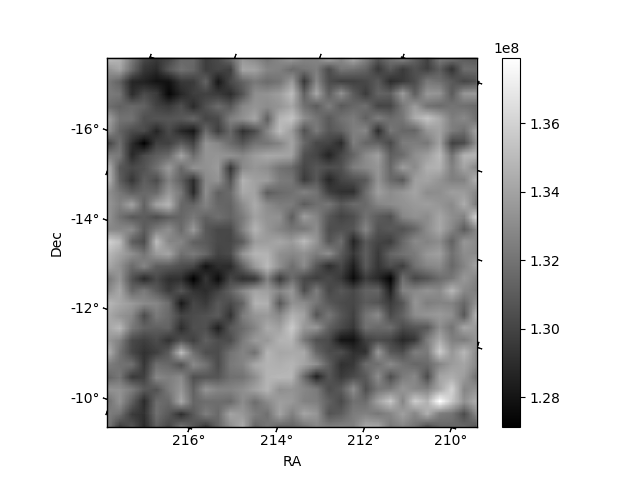
Histogram calculated using DETX and DETY for each event in the final _common_clean file
| Quadrant A | 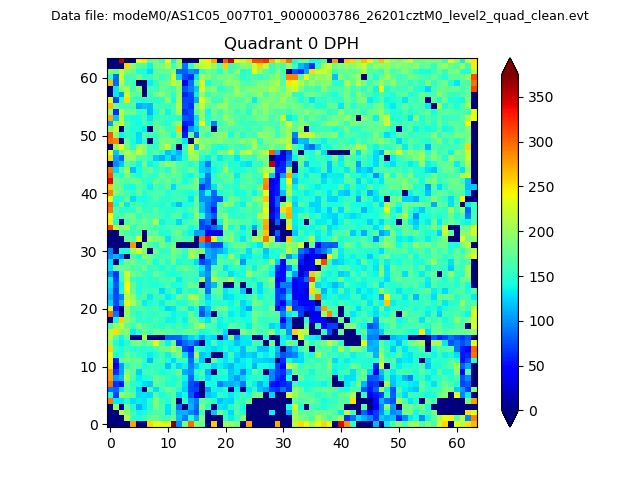 |
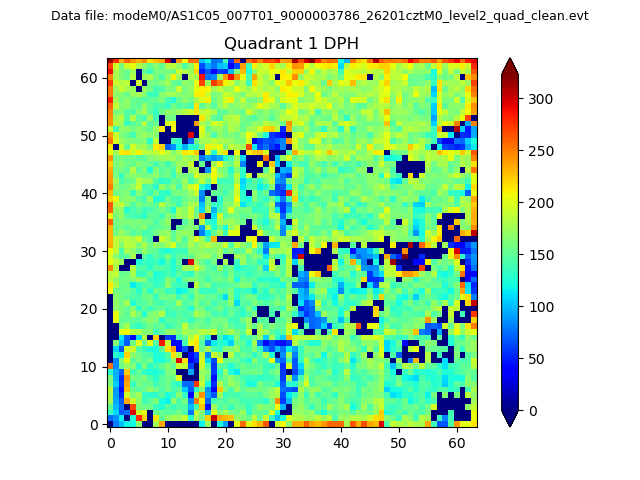 |
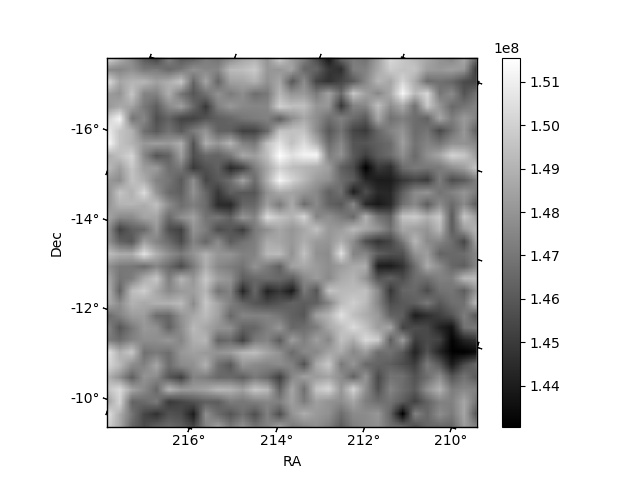
Quadrant B |
|---|---|---|---|
| Quadrant D | 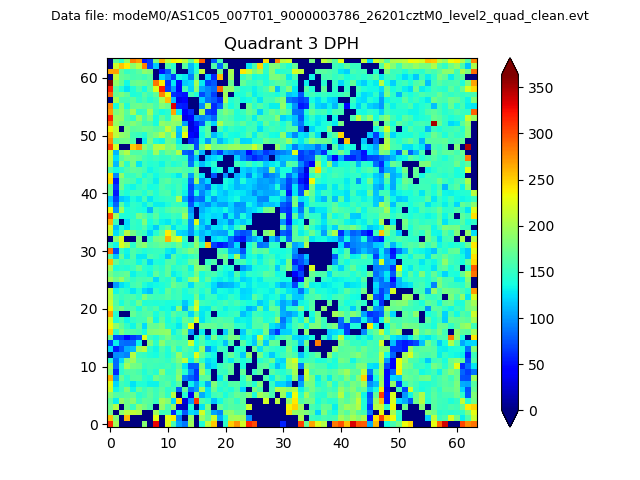 |
 |
Quadrant C |
| Plot type | Count rate plots | Images |
|---|---|---|
| Comparison with Poisson distribution Blue bars denote a histogram of data divided into 1 sec bins. Red curve is a Poisson curve with rate = median count rate of data. |
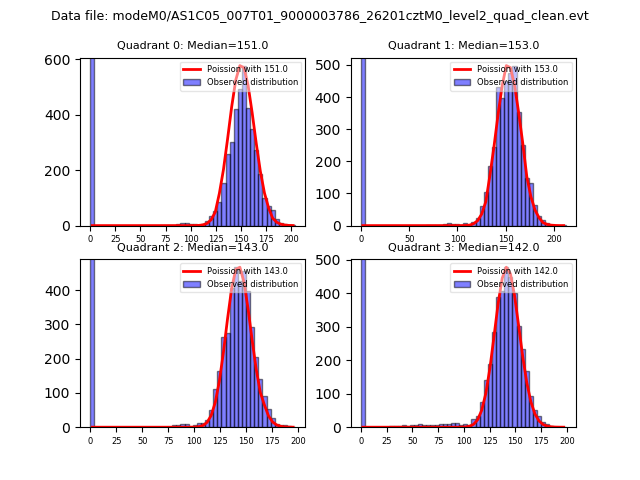 |
 |
| Quadrant-wise count rates Data is divided into 100 sec bins |
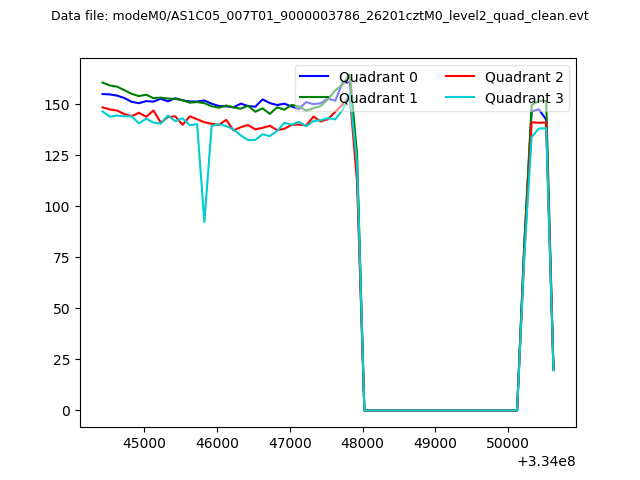 |
|
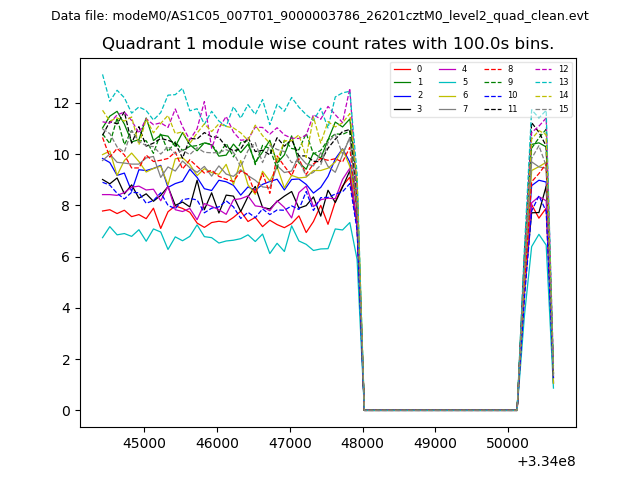
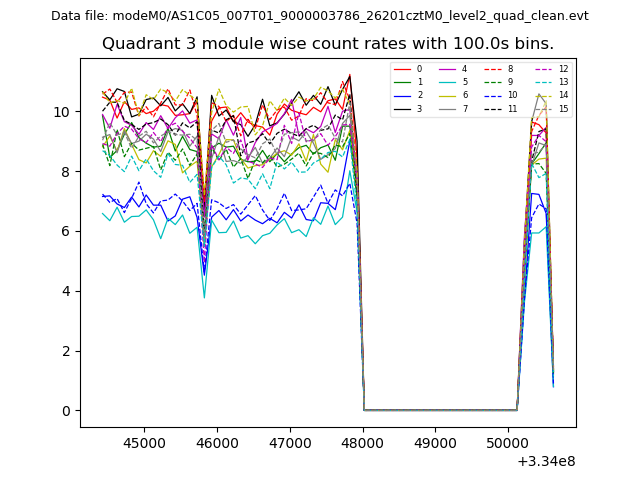
| Module-wise count rates for Quadrant A Data is divided into 100 sec bins |
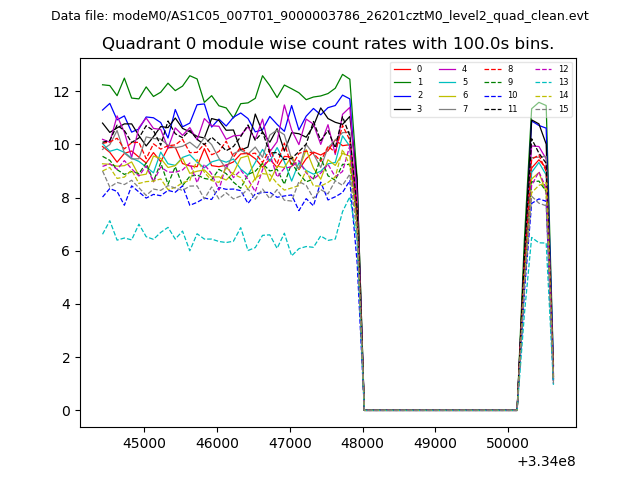 |
 |
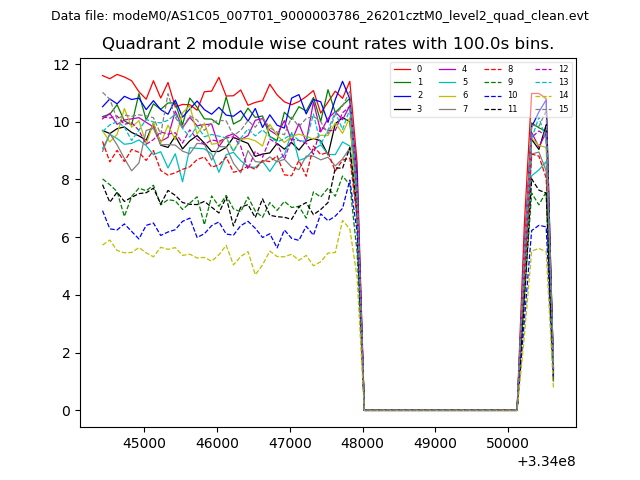
| Module-wise count rates for Quadrant B Data is divided into 100 sec bins |
 |
 |
| Module-wise count rates for Quadrant C Data is divided into 100 sec bins |
 |
 |
| Module-wise count rates for Quadrant D Data is divided into 100 sec bins |
 |
 |
| Parameter | Plot |
|---|---|
| CZT HV Monitor | 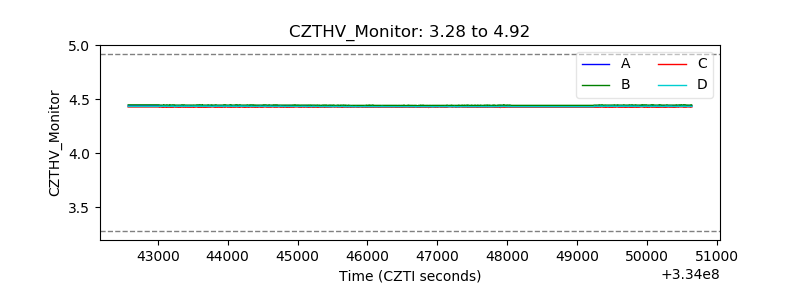 |
| D_VDD | 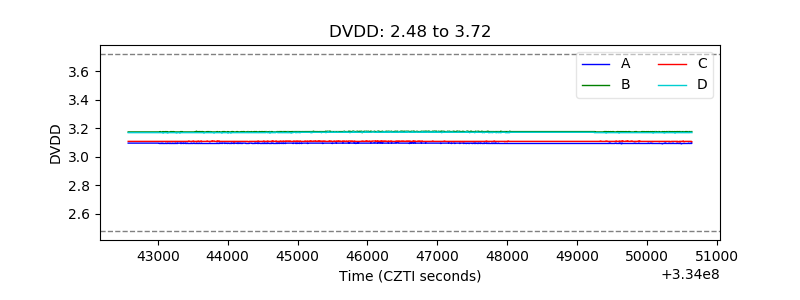 |
| Temperature 1 | 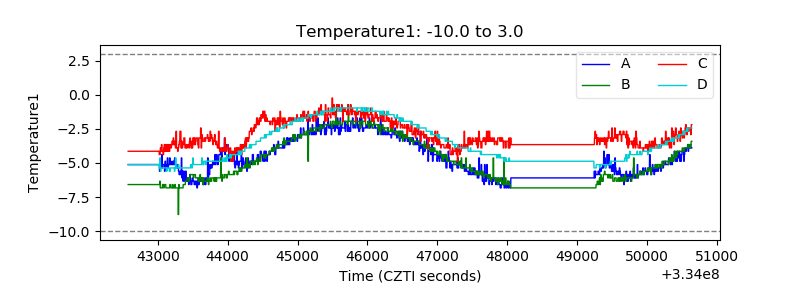 |
| Veto HV Monitor | 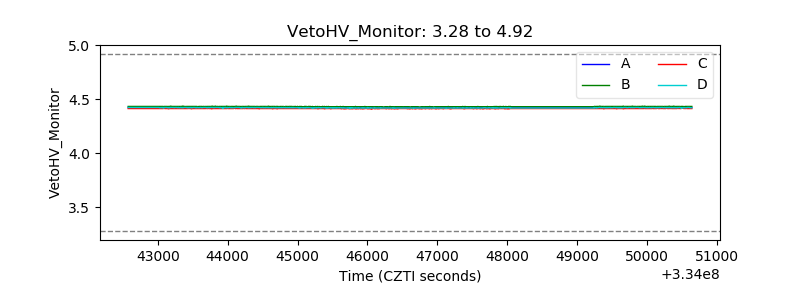 |
| Veto LLD | 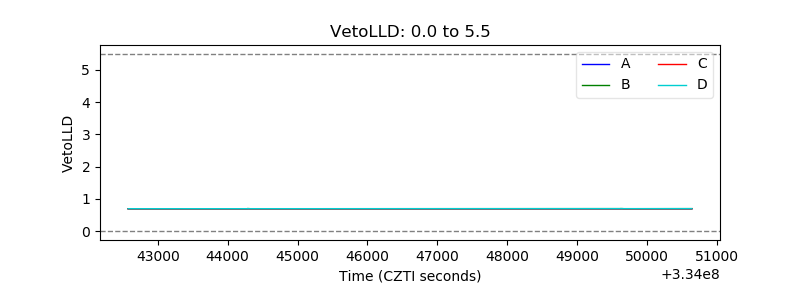 |
| Alpha Counter | 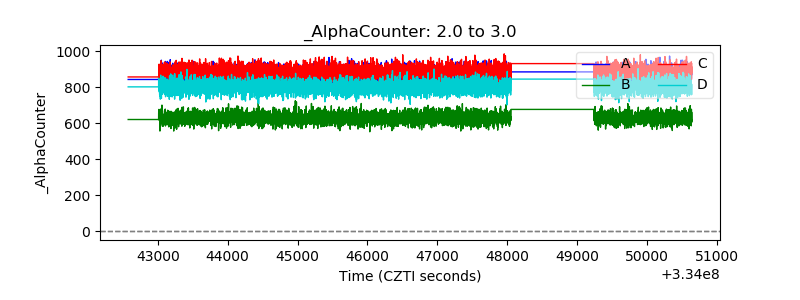 |
| _CPM_Rate |  |
| CZT Counter | 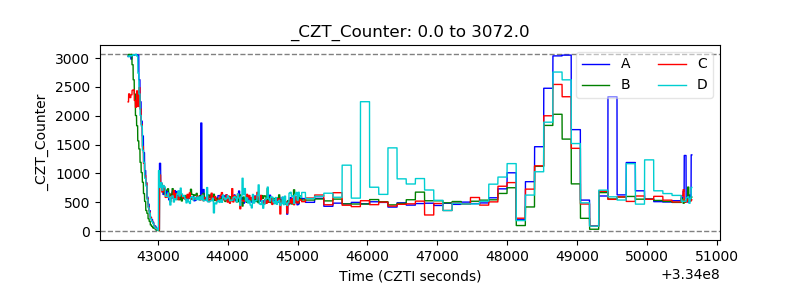 |
| +2.5 Volts monitor | 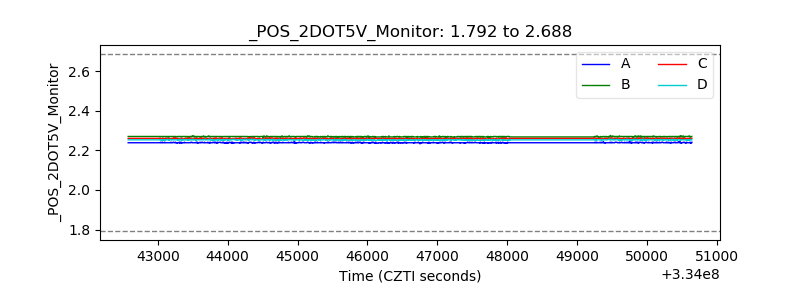 |
| +5 Volts monitor |  |
| _ROLL_ROT | 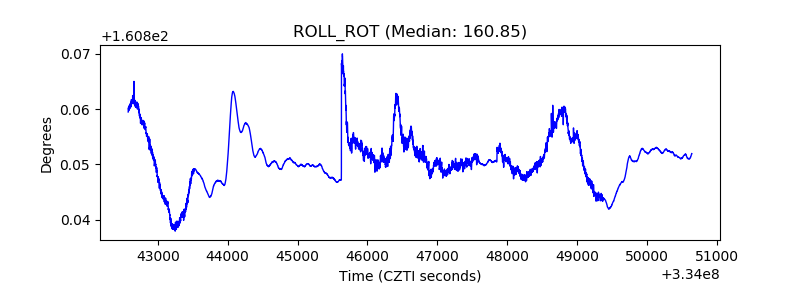 |
| _Roll_DEC | 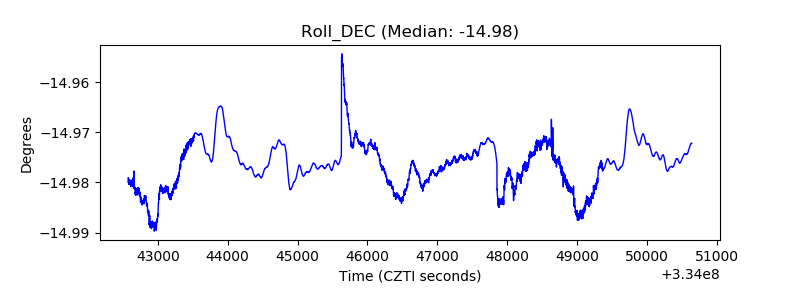 |
| _Roll_RA |  |
| Veto Counter | 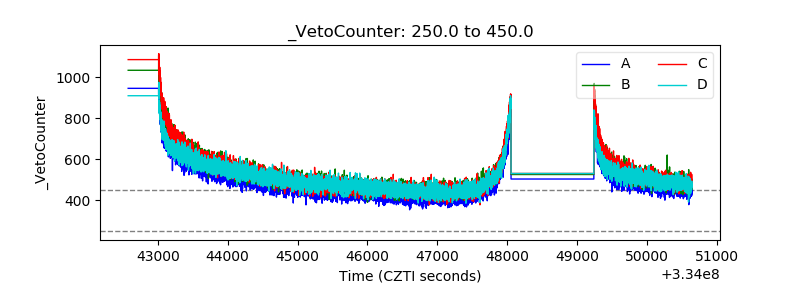 |