| Param | Original file | Final file |
|---|---|---|
| Filename | modeM0/AS1C05_007T01_9000003786_26202cztM0_level2.evt | modeM0/AS1C05_007T01_9000003786_26202cztM0_level2_quad_clean.evt |
| Size (bytes) | 538,237,440 | 94,576,320 |
| Size | 513.3 MB | 90.2 MB |
| Events in quadrant A | 3,860,204 | 613,899 |
| Events in quadrant B | 3,490,968 | 619,357 |
| Events in quadrant C | 3,504,570 | 583,212 |
| Events in quadrant D | 4,985,888 | 575,942 |
| Mode M0 | |||
|---|---|---|---|
| Quadrant | BADHDUFLAG | Total packets | Discarded packets |
| A | 0 | 15519 | 0 |
| B | 0 | 14275 | 0 |
| C | 0 | 14324 | 0 |
| D | 0 | 19402 | 0 |
| Mode M9 | |||
|---|---|---|---|
| Quadrant | BADHDUFLAG | Total packets | Discarded packets |
| A | 0 | 12 | 0 |
| B | 0 | 13 | 0 |
| C | 0 | 13 | 0 |
| D | 0 | 13 | 0 |
| Quadrant | Total seconds | Saturated seconds | Saturation percentage |
|---|---|---|---|
| A | 6767 | 195 | 2.881631% |
| B | 6767 | 169 | 2.497414% |
| C | 6767 | 187 | 2.763411% |
| D | 6767 | 231 | 3.413625% |
Noise dominated data is calculated using 1-second bins in cleaned event files. If a bin has >2000 counts, and if more than 50% of those come from <1% of pixels, then it is considered to be noise-dominated and hence unusable.
| Quadrant | # 1 sec bins | Bins with >0 counts | Bins with >2000 counts | High rate bins dominated by noise | Noise dominated (total time) | Noise dominated (detector-on time) | Marked lightcurve |
|---|---|---|---|---|---|---|---|
| A | 7642 | 6768 | 40 | 40 | 0.52% | 0.59% | 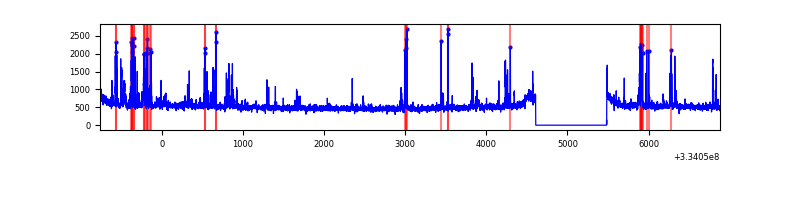 |
| B | 7642 | 6768 | 0 | 0 | 0.00% | 0.00% | 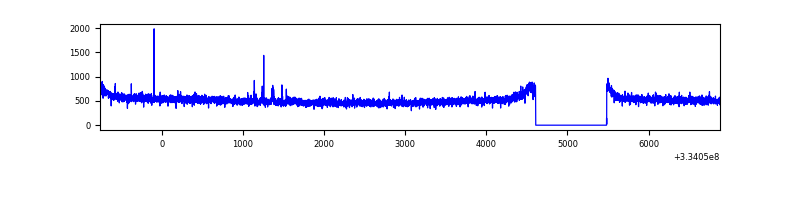 |
| C | 7642 | 6768 | 0 | 0 | 0.00% | 0.00% | 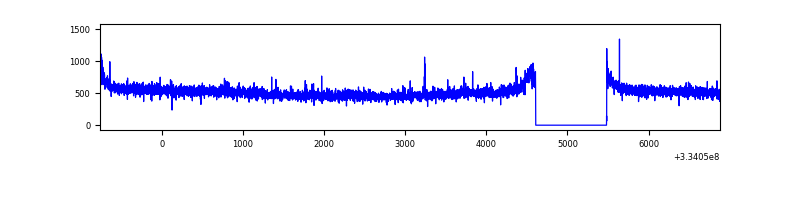 |
| D | 7642 | 6768 | 94 | 94 | 1.23% | 1.39% | 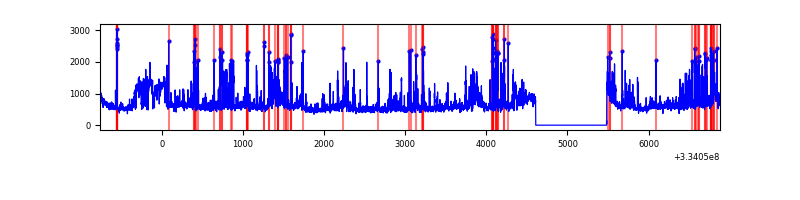 |
Top three noisy pixels from each quadrant. If the there are fewer than three noisy pixels in the level2.evt file, extra rows are filled as -1
| Pixel properties | Quadrant properties | ||||||
|---|---|---|---|---|---|---|---|
| Quadrant | DetID | PixID | Counts | Sigma | Mean | Median | Sigma |
| A | 0 | 13 | 399208 | 2218.69 | 898 | 882 | 179.5 |
| A | 13 | 254 | 10229 | 52.06 | 898 | 882 | 179.5 |
| A | 3 | 137 | 8018 | 39.75 | 898 | 882 | 179.5 |
| B | 0 | 190 | 20565 | 116.33 | 885 | 863 | 169.4 |
| B | 12 | 111 | 20486 | 115.87 | 885 | 863 | 169.4 |
| B | 11 | 111 | 18577 | 104.59 | 885 | 863 | 169.4 |
| C | 14 | 238 | 137458 | 688.83 | 850 | 857 | 198.3 |
| C | 3 | 233 | 44565 | 220.4 | 850 | 857 | 198.3 |
| C | 13 | 61 | 5757 | 24.71 | 850 | 857 | 198.3 |
| D | 1 | 52 | 1641283 | 7989.67 | 862 | 842 | 205.3 |
| D | 12 | 233 | 71319 | 343.25 | 862 | 842 | 205.3 |
| D | 2 | 234 | 24027 | 112.92 | 862 | 842 | 205.3 |
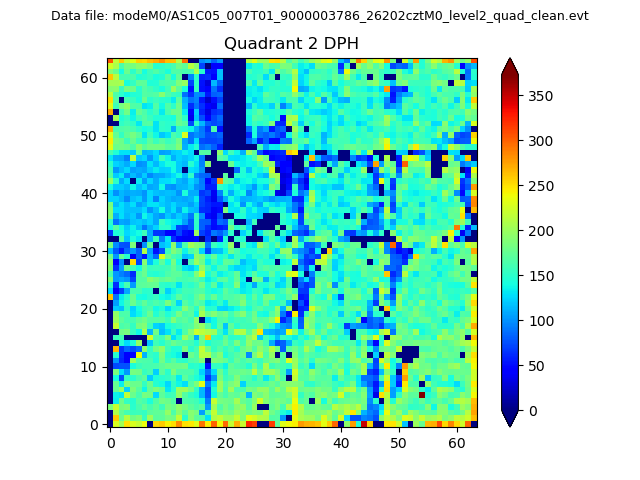
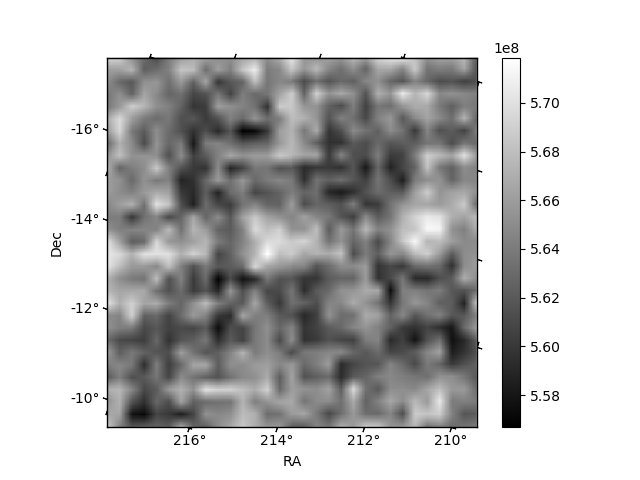
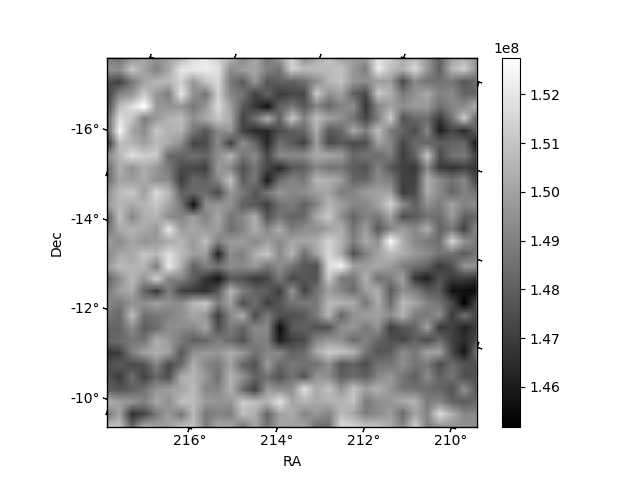
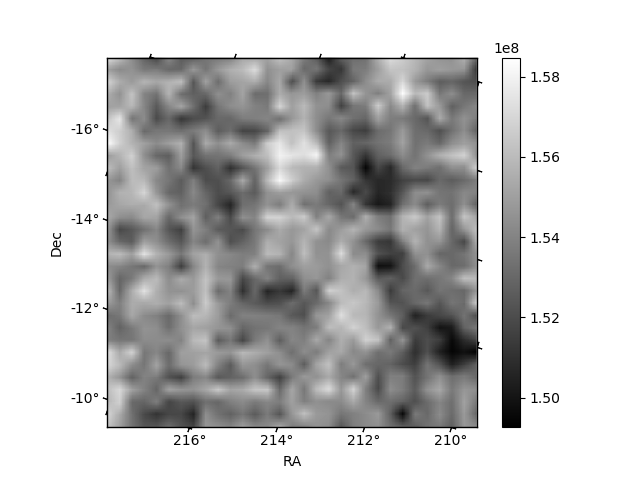
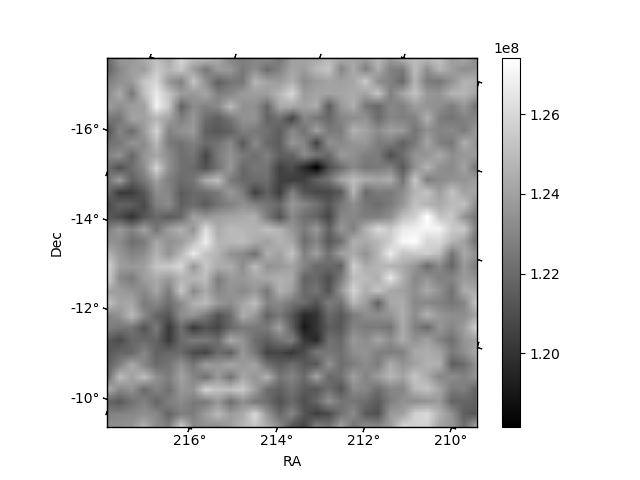
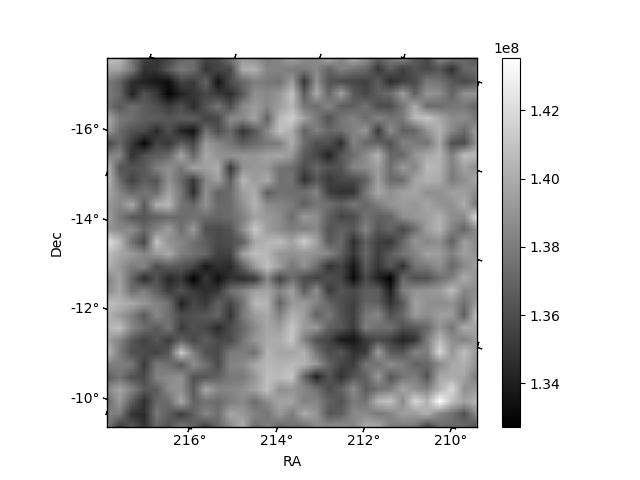
Histogram calculated using DETX and DETY for each event in the final _common_clean file
| Quadrant A | 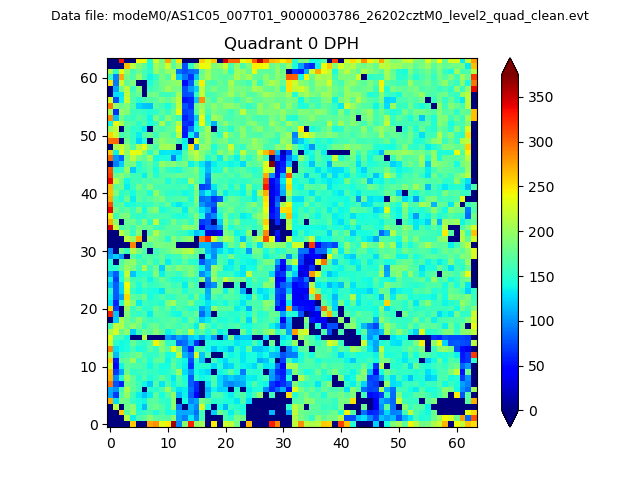 |
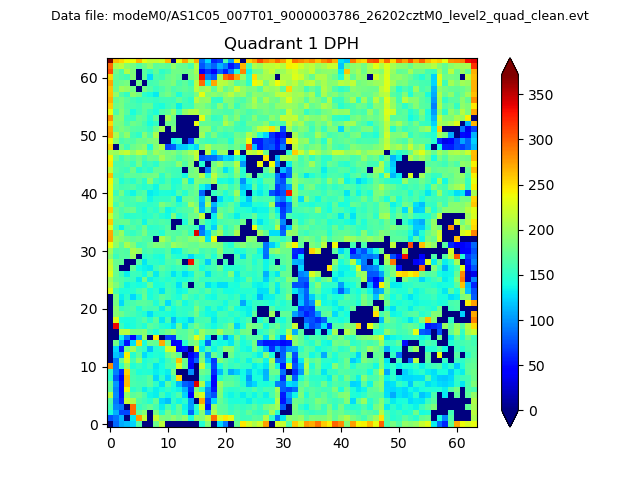 |
Quadrant B |
|---|---|---|---|
| Quadrant D | 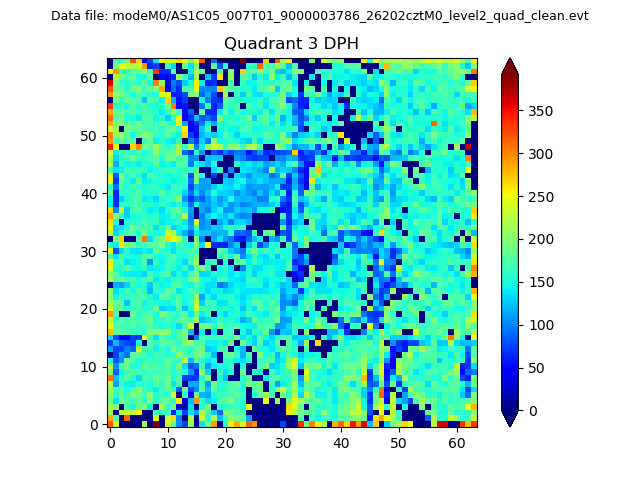 |
 |
Quadrant C |
| Plot type | Count rate plots | Images |
|---|---|---|
| Comparison with Poisson distribution Blue bars denote a histogram of data divided into 1 sec bins. Red curve is a Poisson curve with rate = median count rate of data. |
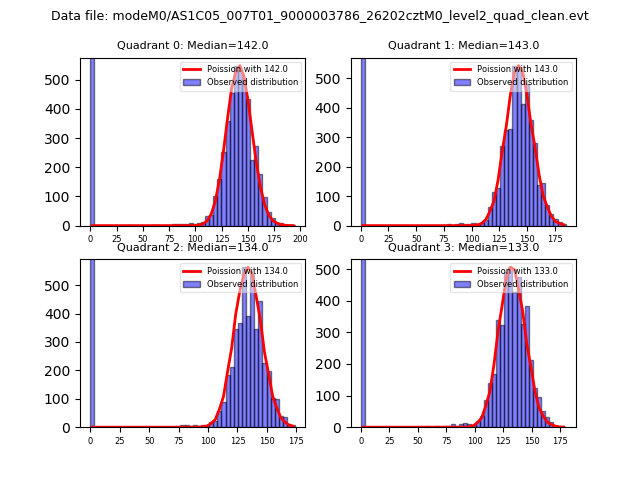 |
 |
| Quadrant-wise count rates Data is divided into 100 sec bins |
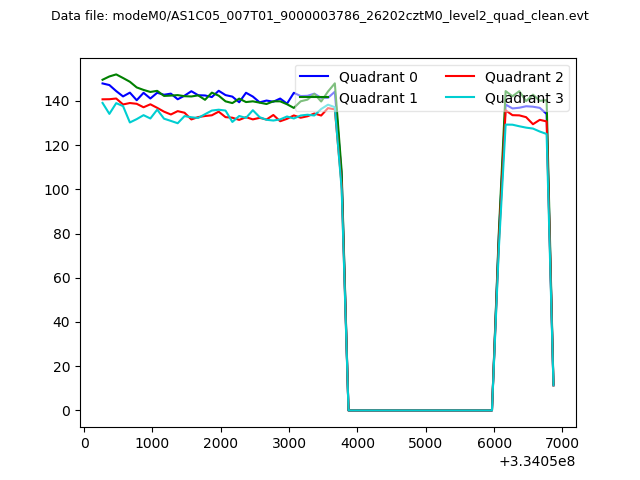 |
|
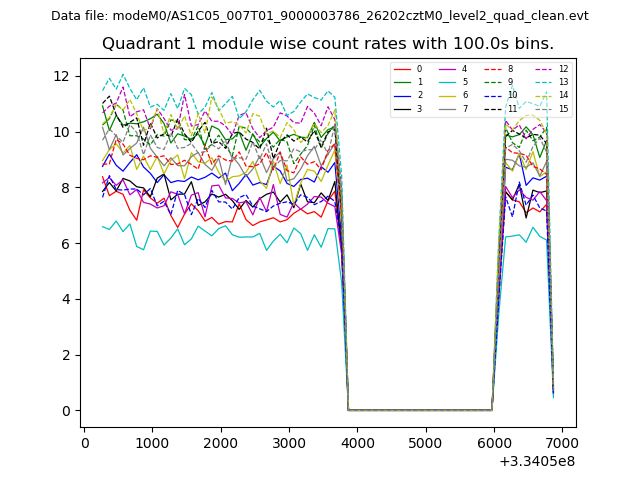
| Module-wise count rates for Quadrant A Data is divided into 100 sec bins |
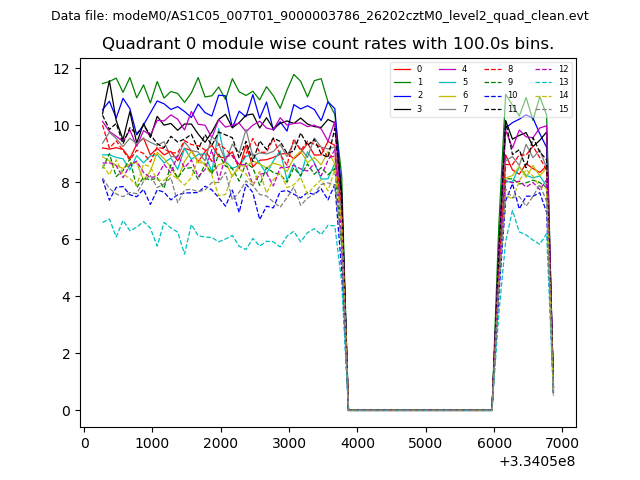 |
 |
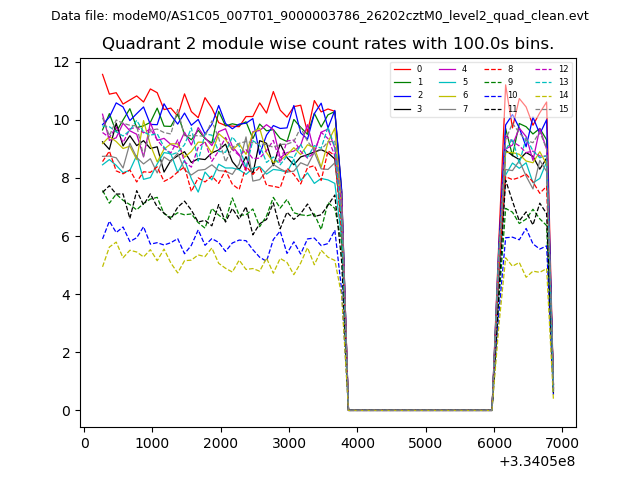
| Module-wise count rates for Quadrant B Data is divided into 100 sec bins |
 |
 |
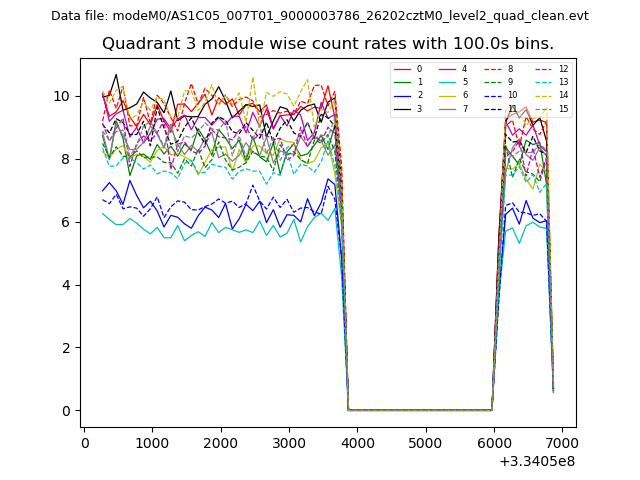
| Module-wise count rates for Quadrant C Data is divided into 100 sec bins |
 |
 |
| Module-wise count rates for Quadrant D Data is divided into 100 sec bins |
 |
 |
| Parameter | Plot |
|---|---|
| CZT HV Monitor | 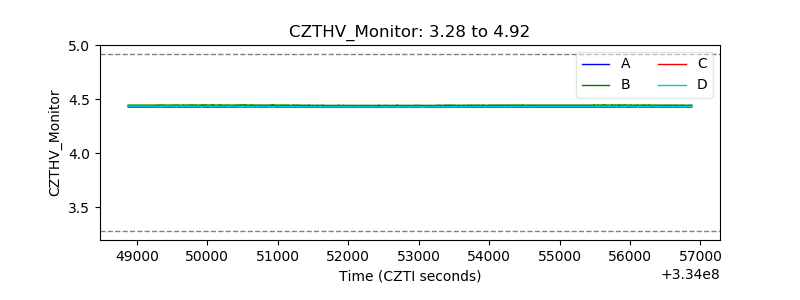 |
| D_VDD | 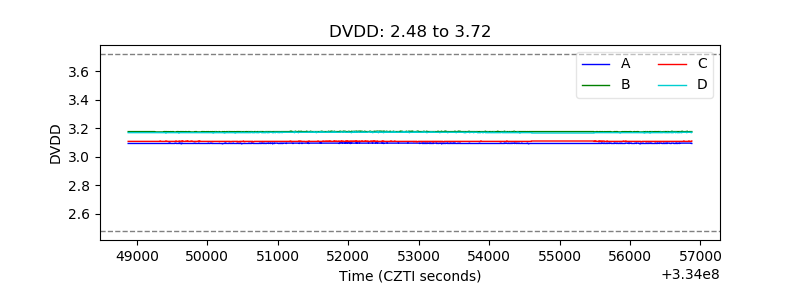 |
| Temperature 1 | 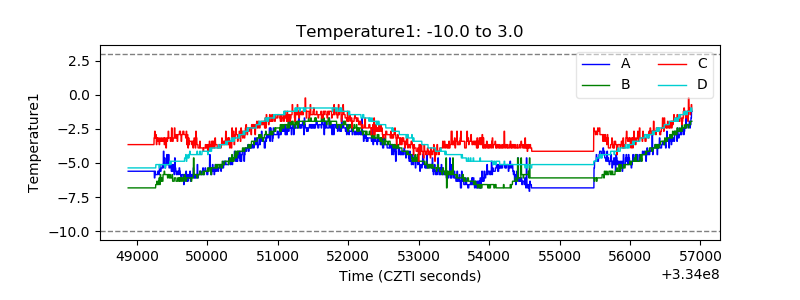 |
| Veto HV Monitor | 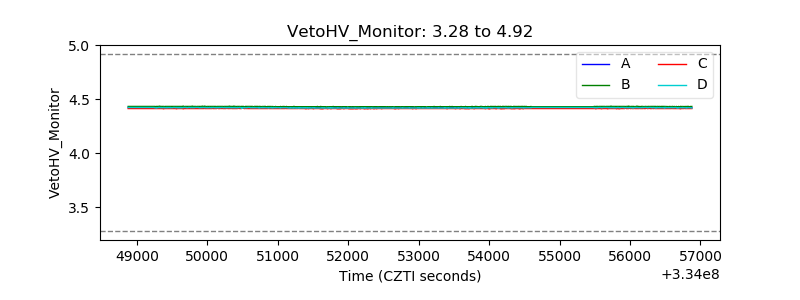 |
| Veto LLD | 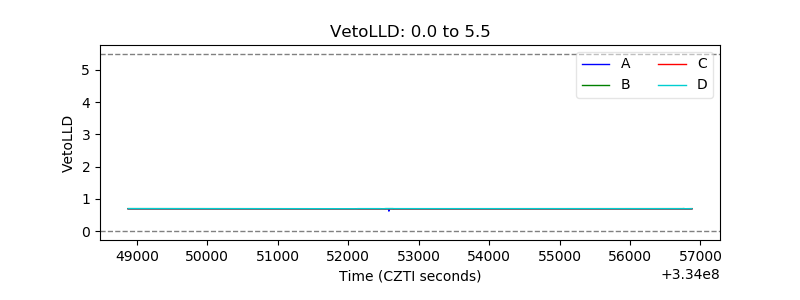 |
| Alpha Counter | 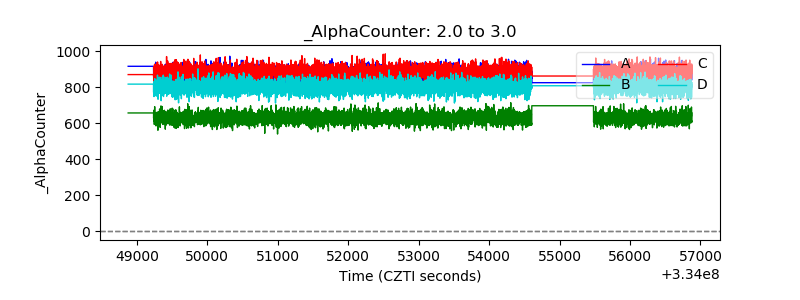 |
| _CPM_Rate | 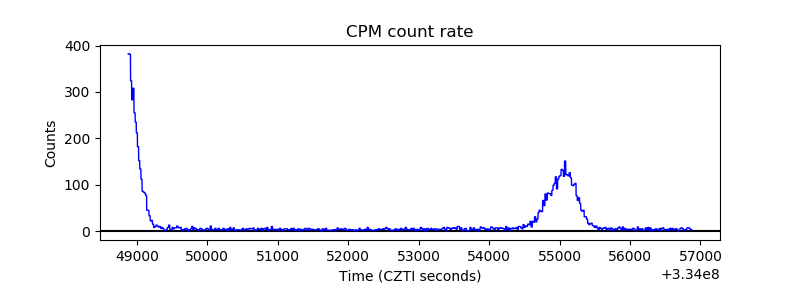 |
| CZT Counter | 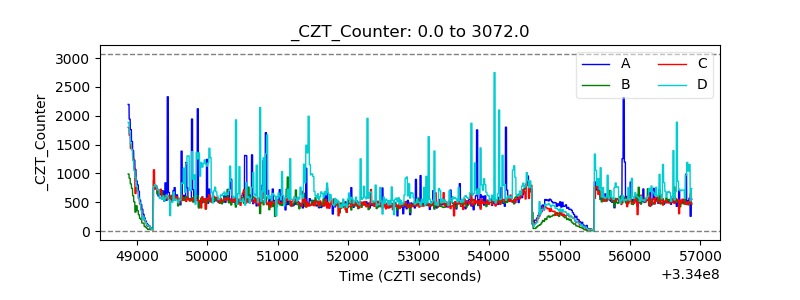 |
| +2.5 Volts monitor |  |
| +5 Volts monitor |  |
| _ROLL_ROT | 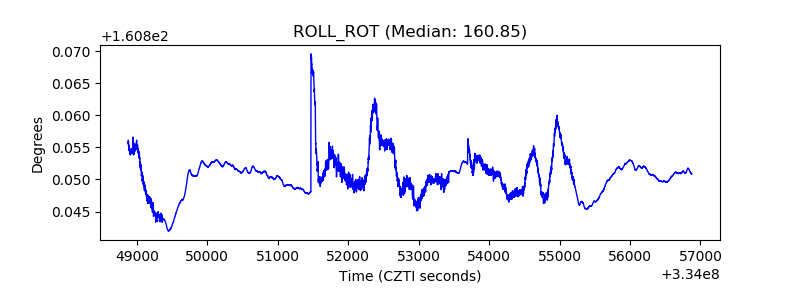 |
| _Roll_DEC | 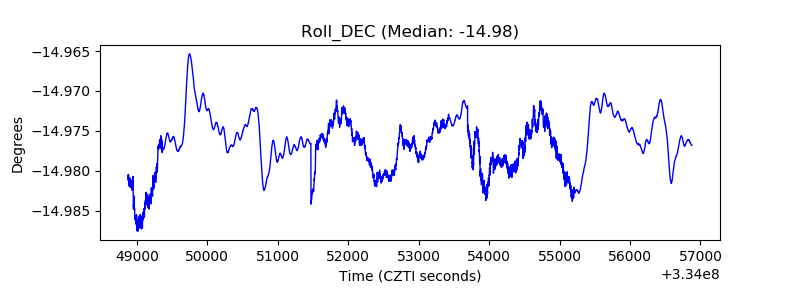 |
| _Roll_RA | 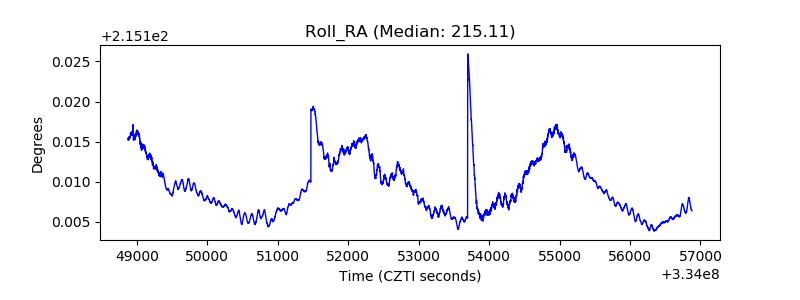 |
| Veto Counter | 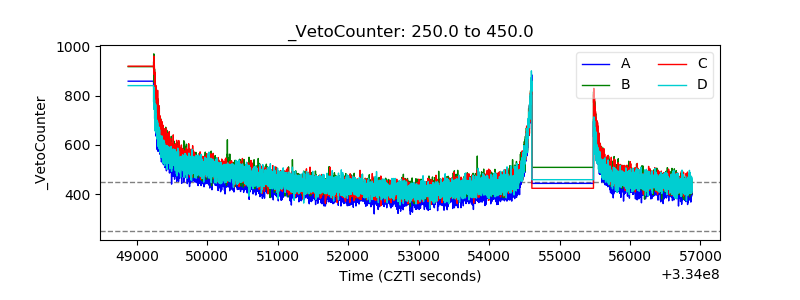 |