| Param | Original file | Final file |
|---|---|---|
| Filename | modeM0/AS1C05_007T01_9000003786_26204cztM0_level2.evt | modeM0/AS1C05_007T01_9000003786_26204cztM0_level2_quad_clean.evt |
| Size (bytes) | 537,347,520 | 98,807,040 |
| Size | 512.5 MB | 94.2 MB |
| Events in quadrant A | 3,510,714 | 644,968 |
| Events in quadrant B | 3,906,167 | 638,568 |
| Events in quadrant C | 3,619,533 | 613,014 |
| Events in quadrant D | 4,761,034 | 606,794 |
| Mode M0 | |||
|---|---|---|---|
| Quadrant | BADHDUFLAG | Total packets | Discarded packets |
| A | 0 | 14792 | 0 |
| B | 0 | 15889 | 0 |
| C | 0 | 15065 | 0 |
| D | 0 | 18682 | 0 |
| Mode M9 | |||
|---|---|---|---|
| Quadrant | BADHDUFLAG | Total packets | Discarded packets |
| A | 0 | 1 | 0 |
| B | 0 | 1 | 0 |
| C | 0 | 1 | 0 |
| D | 0 | 1 | 0 |
| Quadrant | Total seconds | Saturated seconds | Saturation percentage |
|---|---|---|---|
| A | 7013 | 123 | 1.753886% |
| B | 7014 | 278 | 3.963502% |
| C | 7013 | 173 | 2.466847% |
| D | 7013 | 222 | 3.165550% |
Noise dominated data is calculated using 1-second bins in cleaned event files. If a bin has >2000 counts, and if more than 50% of those come from <1% of pixels, then it is considered to be noise-dominated and hence unusable.
| Quadrant | # 1 sec bins | Bins with >0 counts | Bins with >2000 counts | High rate bins dominated by noise | Noise dominated (total time) | Noise dominated (detector-on time) | Marked lightcurve |
|---|---|---|---|---|---|---|---|
| A | 7233 | 7015 | 4 | 4 | 0.06% | 0.06% | 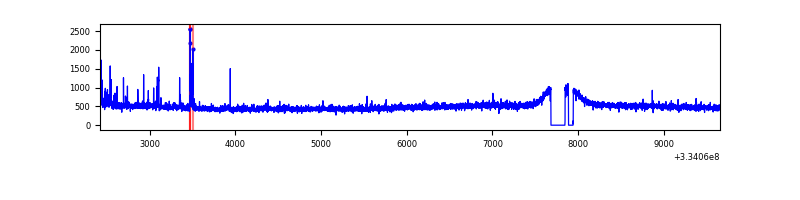 |
| B | 7234 | 7016 | 141 | 141 | 1.95% | 2.01% | 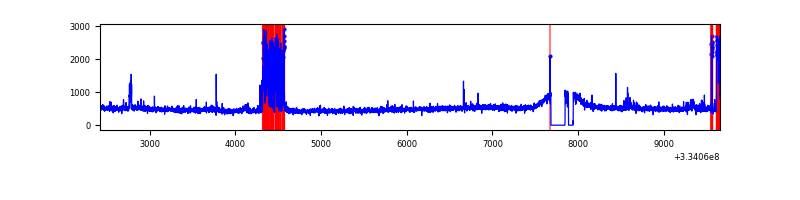 |
| C | 7233 | 7015 | 2 | 2 | 0.03% | 0.03% | 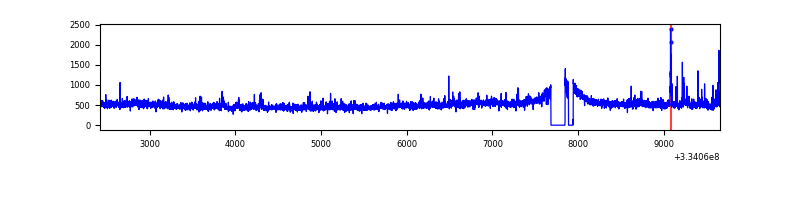 |
| D | 7233 | 7015 | 159 | 159 | 2.20% | 2.27% | 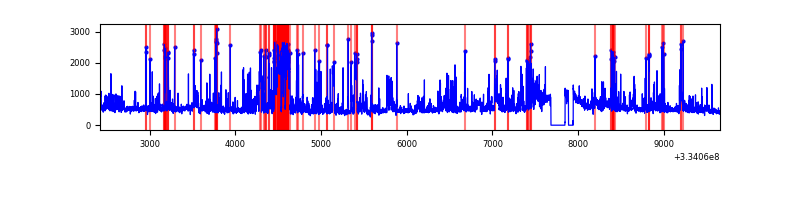 |
Top three noisy pixels from each quadrant. If the there are fewer than three noisy pixels in the level2.evt file, extra rows are filled as -1
| Pixel properties | Quadrant properties | ||||||
|---|---|---|---|---|---|---|---|
| Quadrant | DetID | PixID | Counts | Sigma | Mean | Median | Sigma |
| A | 0 | 13 | 78485 | 434.52 | 890 | 871 | 178.6 |
| A | 13 | 254 | 11724 | 60.76 | 890 | 871 | 178.6 |
| A | 3 | 137 | 8315 | 41.67 | 890 | 871 | 178.6 |
| B | 5 | 172 | 418010 | 2480.8 | 871 | 849 | 168.2 |
| B | 0 | 190 | 47354 | 276.56 | 871 | 849 | 168.2 |
| B | 15 | 35 | 23328 | 133.68 | 871 | 849 | 168.2 |
| C | 3 | 233 | 209326 | 1047.42 | 841 | 846 | 199.0 |
| C | 14 | 238 | 133156 | 664.74 | 841 | 846 | 199.0 |
| C | 13 | 61 | 5876 | 25.27 | 841 | 846 | 199.0 |
| D | 1 | 52 | 1398953 | 6775.51 | 856 | 835 | 206.3 |
| D | 12 | 233 | 57839 | 276.25 | 856 | 835 | 206.3 |
| D | 13 | 104 | 38406 | 182.08 | 856 | 835 | 206.3 |
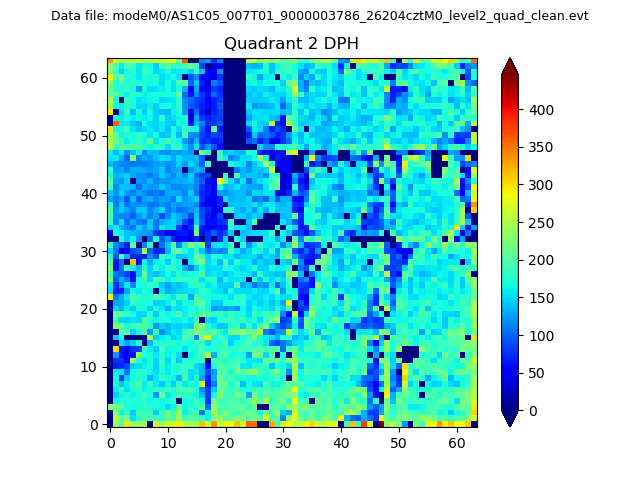
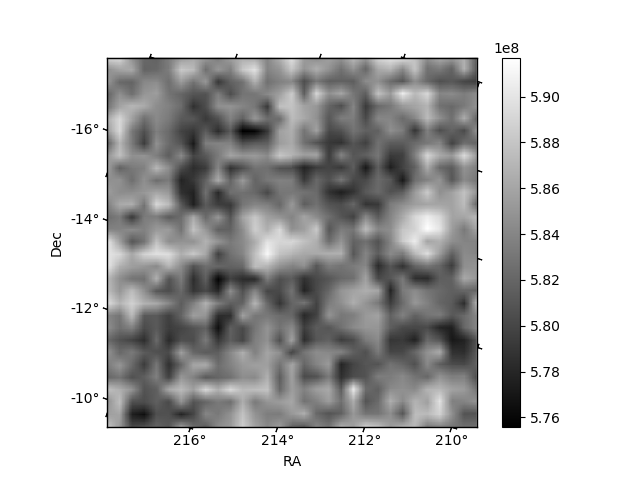
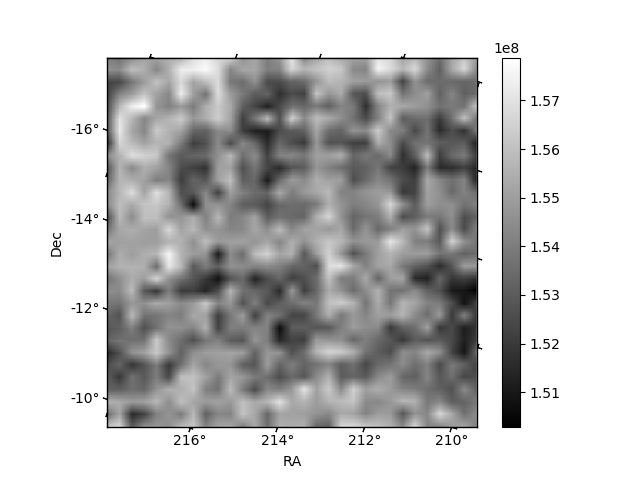
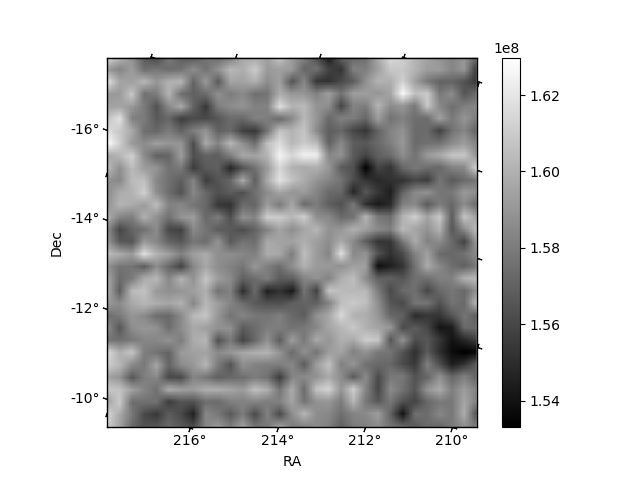
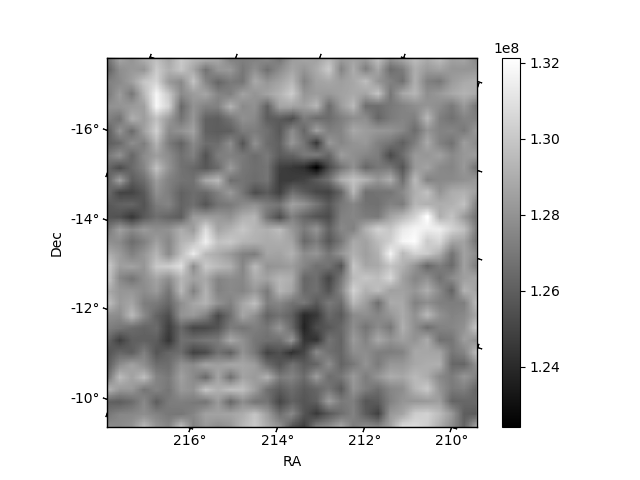
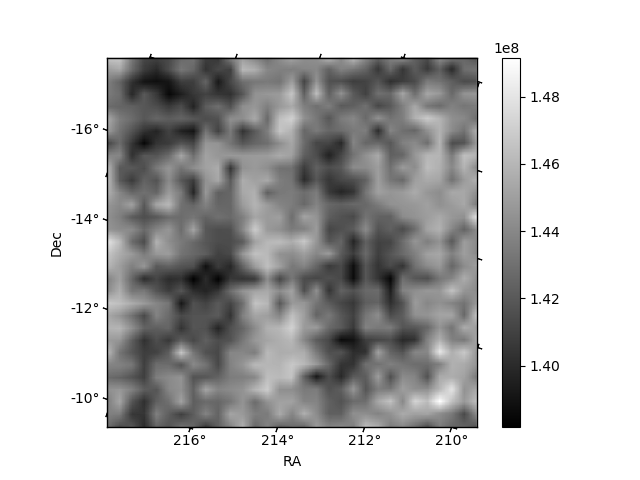
Histogram calculated using DETX and DETY for each event in the final _common_clean file
| Quadrant A | 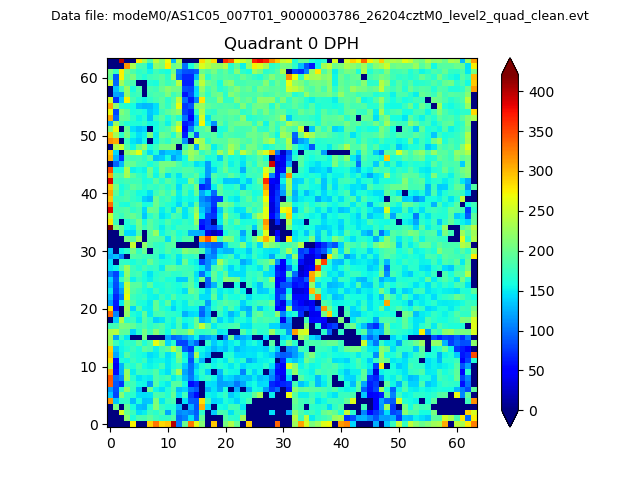 |
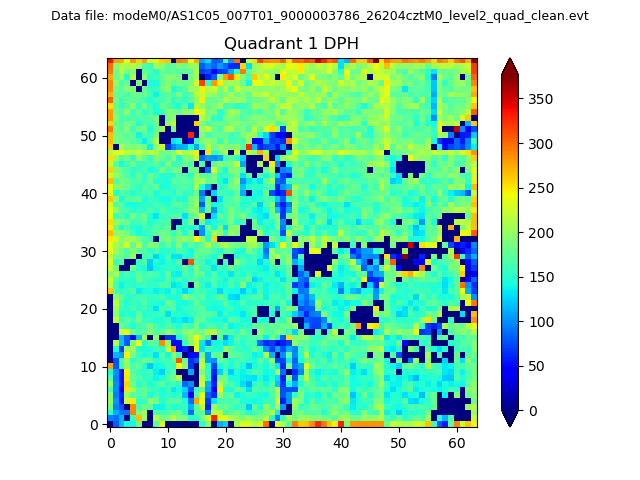 |
Quadrant B |
|---|---|---|---|
| Quadrant D | 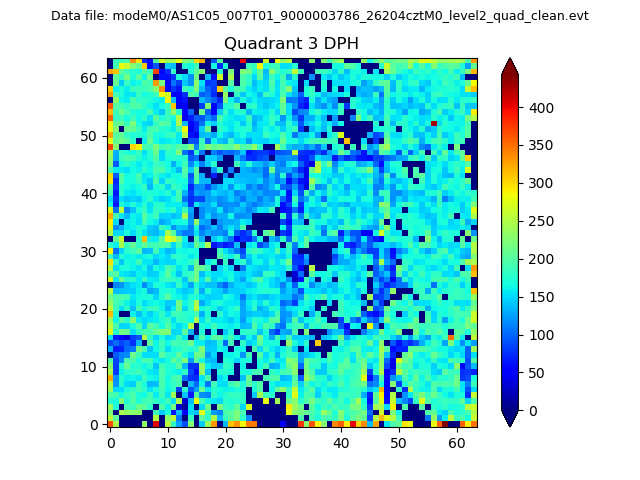 |
 |
Quadrant C |
| Plot type | Count rate plots | Images |
|---|---|---|
| Comparison with Poisson distribution Blue bars denote a histogram of data divided into 1 sec bins. Red curve is a Poisson curve with rate = median count rate of data. |
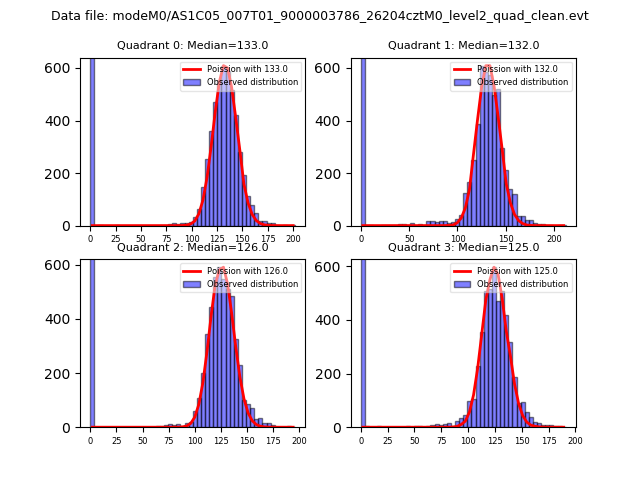 |
 |
| Quadrant-wise count rates Data is divided into 100 sec bins |
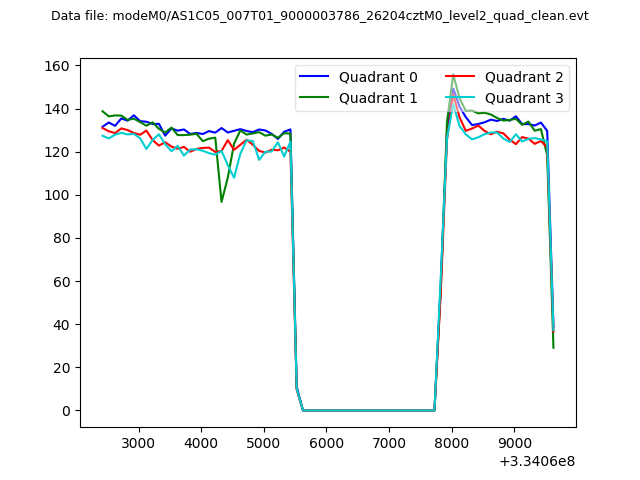 |
|
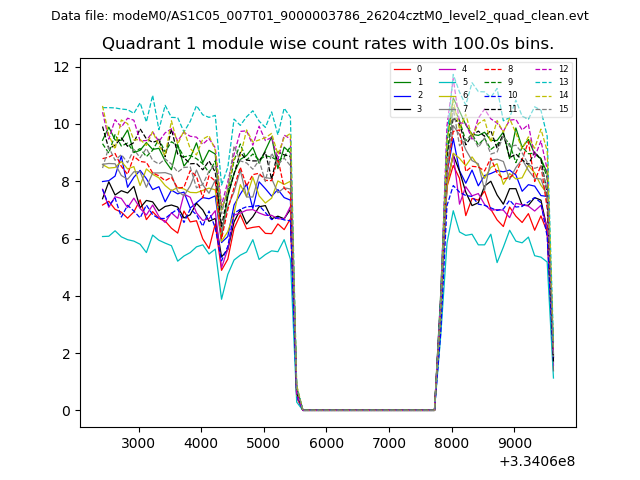
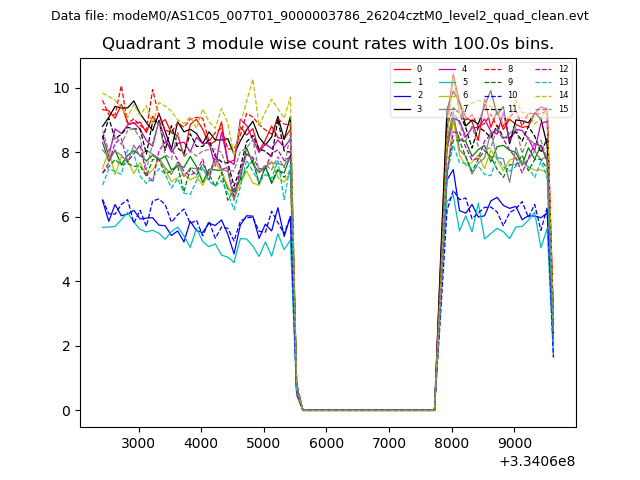
| Module-wise count rates for Quadrant A Data is divided into 100 sec bins |
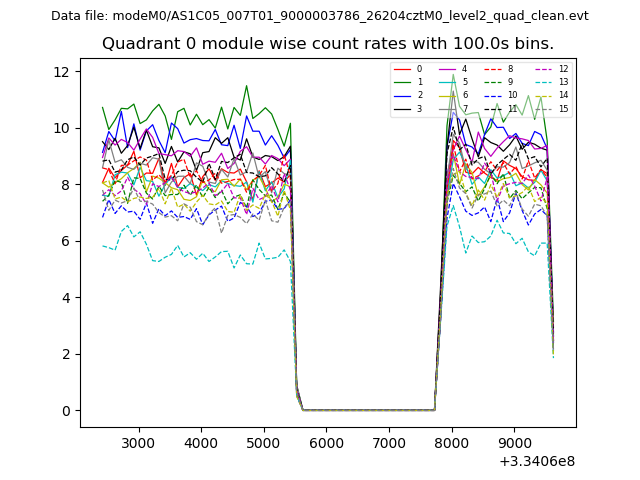 |
 |
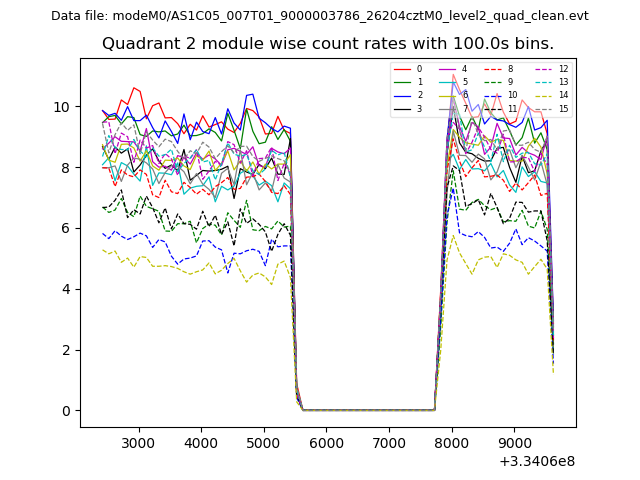
| Module-wise count rates for Quadrant B Data is divided into 100 sec bins |
 |
 |
| Module-wise count rates for Quadrant C Data is divided into 100 sec bins |
 |
 |
| Module-wise count rates for Quadrant D Data is divided into 100 sec bins |
 |
 |
| Parameter | Plot |
|---|---|
| CZT HV Monitor | 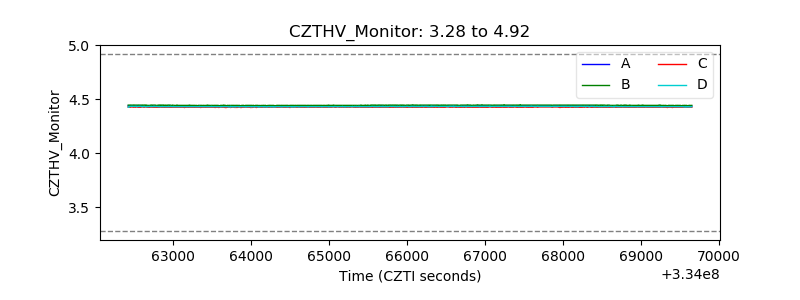 |
| D_VDD | 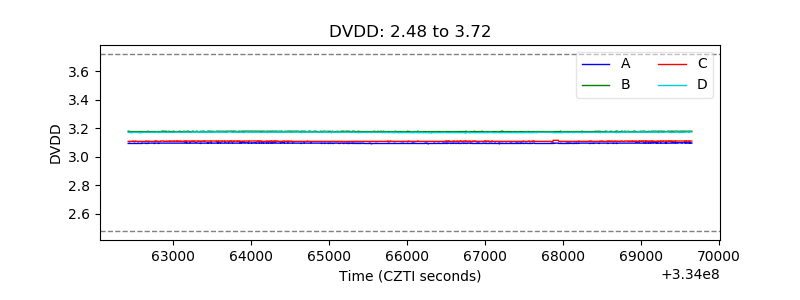 |
| Temperature 1 | 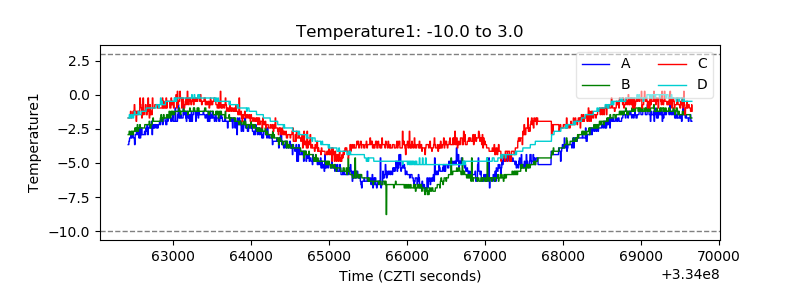 |
| Veto HV Monitor | 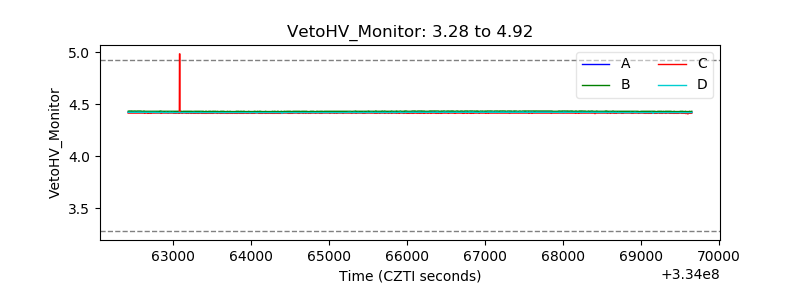 |
| Veto LLD | 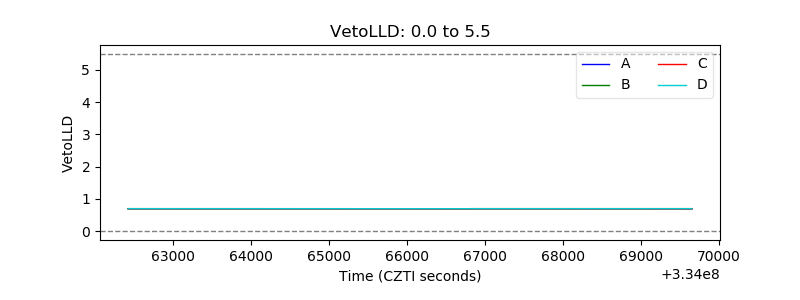 |
| Alpha Counter | 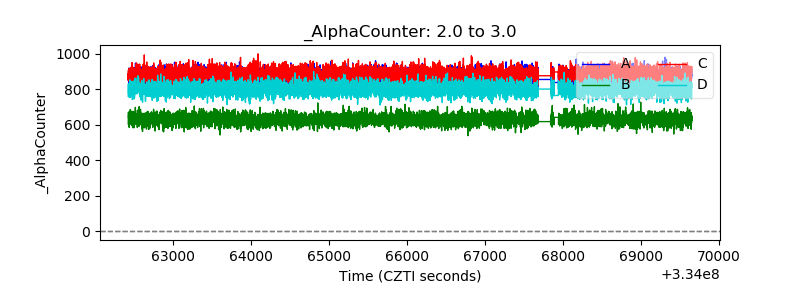 |
| _CPM_Rate | 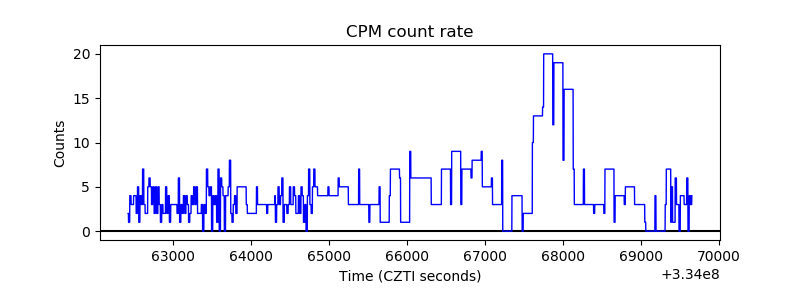 |
| CZT Counter | 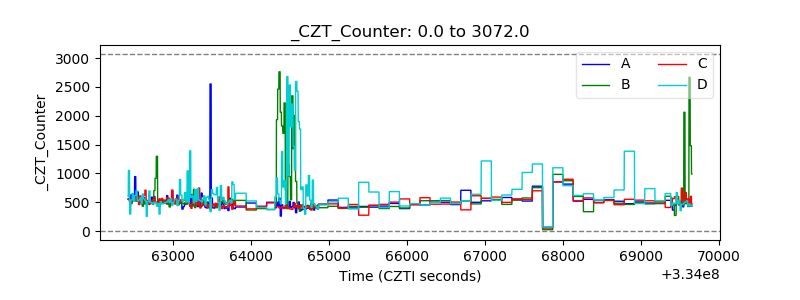 |
| +2.5 Volts monitor |  |
| +5 Volts monitor |  |
| _ROLL_ROT | 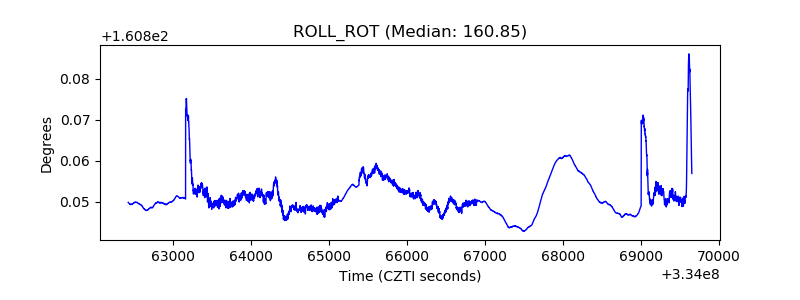 |
| _Roll_DEC | 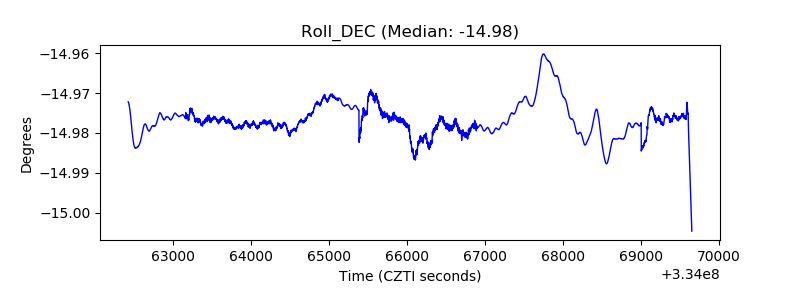 |
| _Roll_RA | 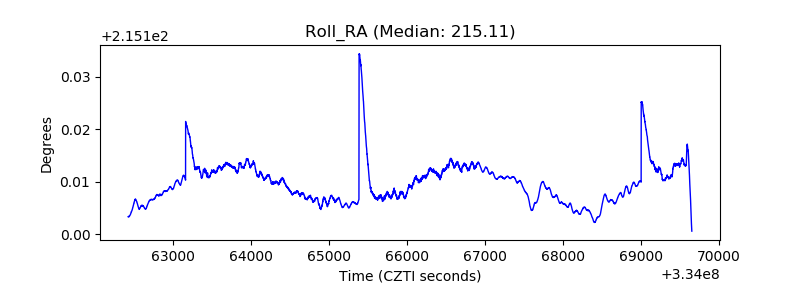 |
| Veto Counter | 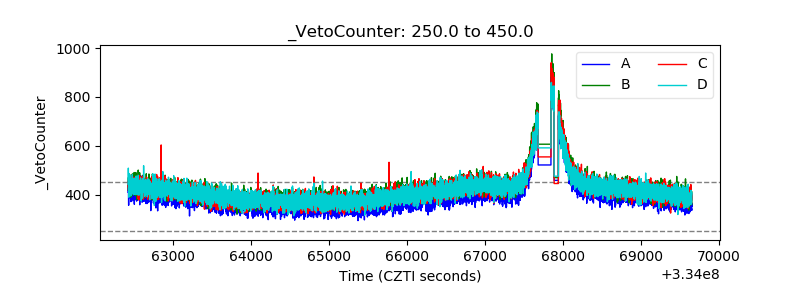 |