| Param | Original file | Final file |
|---|---|---|
| Filename | modeM0/AS1C05_007T01_9000003786_26205cztM0_level2.evt | modeM0/AS1C05_007T01_9000003786_26205cztM0_level2_quad_clean.evt |
| Size (bytes) | 93,196,800 | 24,243,840 |
| Size | 88.9 MB | 23.1 MB |
| Events in quadrant A | 596,759 | 164,727 |
| Events in quadrant B | 713,158 | 162,990 |
| Events in quadrant C | 694,453 | 155,407 |
| Events in quadrant D | 730,468 | 156,827 |
| Mode M0 | |||
|---|---|---|---|
| Quadrant | BADHDUFLAG | Total packets | Discarded packets |
| A | 0 | 2512 | 0 |
| B | 0 | 2864 | 0 |
| C | 0 | 2800 | 0 |
| D | 0 | 2950 | 0 |
| Quadrant | Total seconds | Saturated seconds | Saturation percentage |
|---|---|---|---|
| A | 1249 | 1 | 0.080064% |
| B | 1249 | 39 | 3.122498% |
| C | 1249 | 12 | 0.960769% |
| D | 1249 | 14 | 1.120897% |
Noise dominated data is calculated using 1-second bins in cleaned event files. If a bin has >2000 counts, and if more than 50% of those come from <1% of pixels, then it is considered to be noise-dominated and hence unusable.
| Quadrant | # 1 sec bins | Bins with >0 counts | Bins with >2000 counts | High rate bins dominated by noise | Noise dominated (total time) | Noise dominated (detector-on time) | Marked lightcurve |
|---|---|---|---|---|---|---|---|
| A | 1249 | 1249 | 0 | 0 | 0.00% | 0.00% | 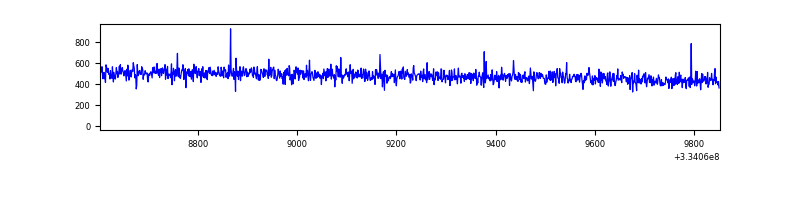 |
| B | 1249 | 1249 | 41 | 41 | 3.28% | 3.28% | 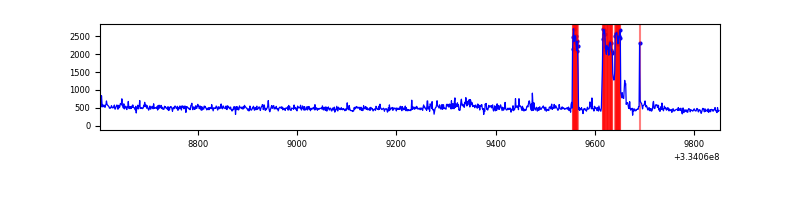 |
| C | 1249 | 1249 | 2 | 2 | 0.16% | 0.16% | 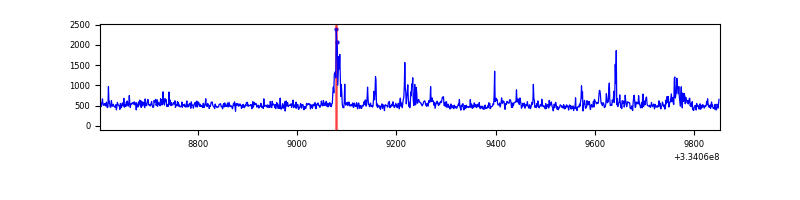 |
| D | 1249 | 1249 | 11 | 11 | 0.88% | 0.88% | 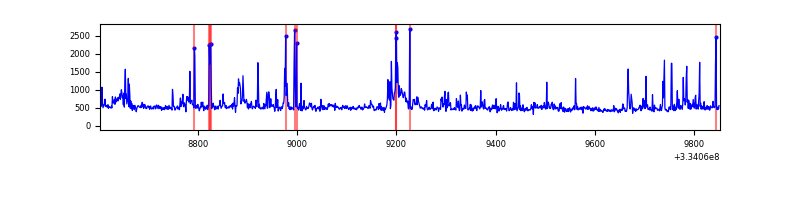 |
Top three noisy pixels from each quadrant. If the there are fewer than three noisy pixels in the level2.evt file, extra rows are filled as -1
| Pixel properties | Quadrant properties | ||||||
|---|---|---|---|---|---|---|---|
| Quadrant | DetID | PixID | Counts | Sigma | Mean | Median | Sigma |
| A | 13 | 254 | 2176 | 62.93 | 153 | 150 | 32.2 |
| A | 0 | 13 | 1411 | 39.17 | 153 | 150 | 32.2 |
| A | 3 | 137 | 1369 | 37.86 | 153 | 150 | 32.2 |
| B | 5 | 172 | 109441 | 3566.25 | 148 | 144 | 30.6 |
| B | 15 | 35 | 16482 | 533.09 | 148 | 144 | 30.6 |
| B | 0 | 190 | 6126 | 195.19 | 148 | 144 | 30.6 |
| C | 3 | 233 | 110642 | 3087.39 | 143 | 143 | 35.8 |
| C | 14 | 238 | 23668 | 657.3 | 143 | 143 | 35.8 |
| C | 13 | 61 | 1051 | 25.37 | 143 | 143 | 35.8 |
| D | 1 | 52 | 150328 | 4045.69 | 149 | 145 | 37.1 |
| D | 15 | 145 | 7924 | 209.55 | 149 | 145 | 37.1 |
| D | 2 | 234 | 5674 | 148.94 | 149 | 145 | 37.1 |
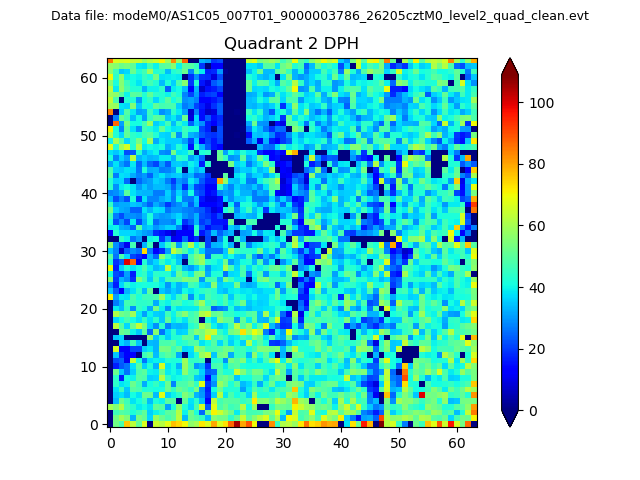
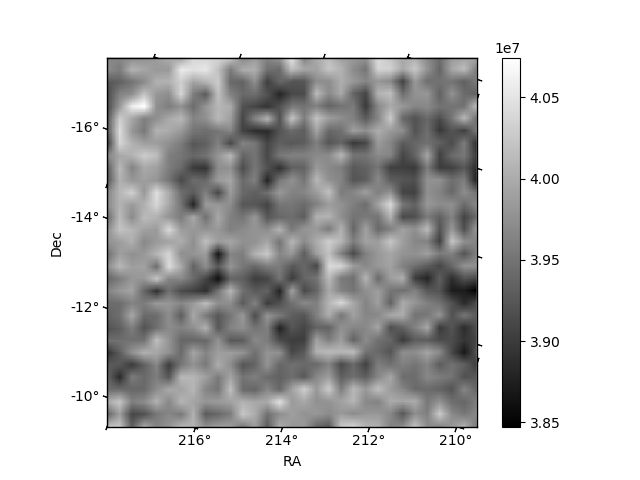
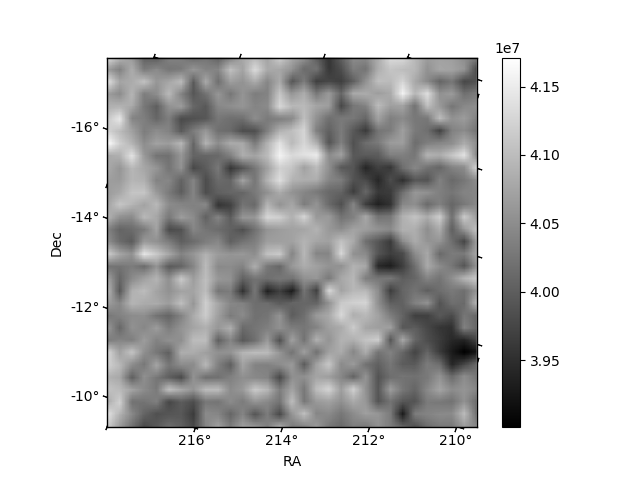
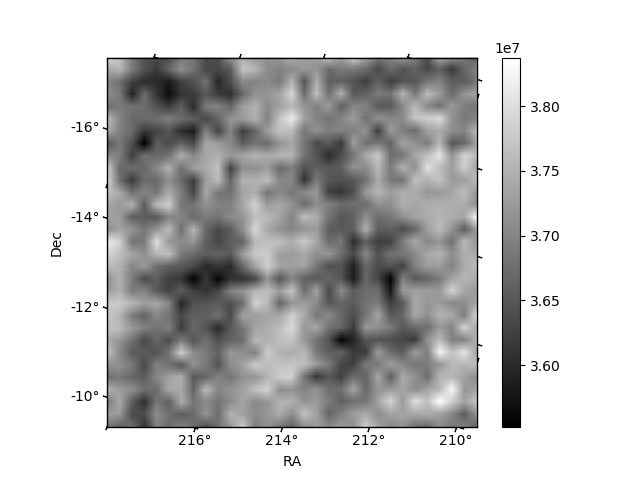
Histogram calculated using DETX and DETY for each event in the final _common_clean file
| Quadrant A | 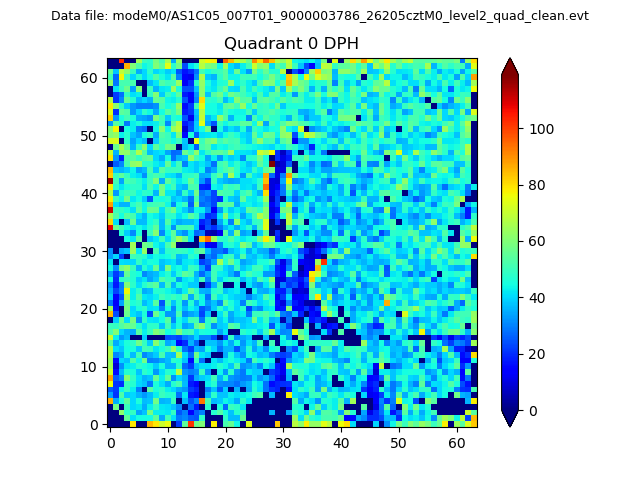 |
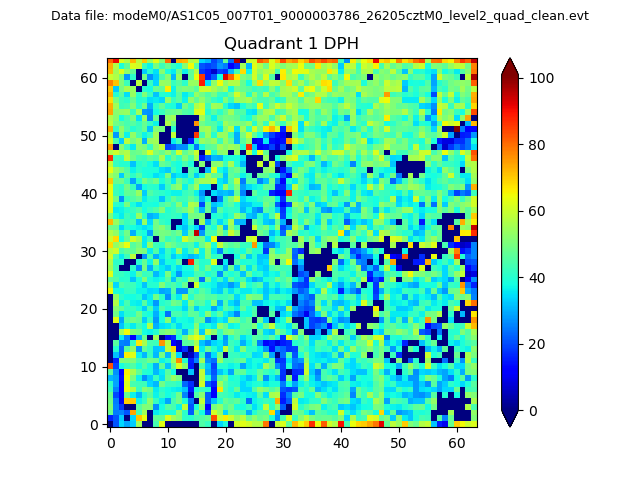 |
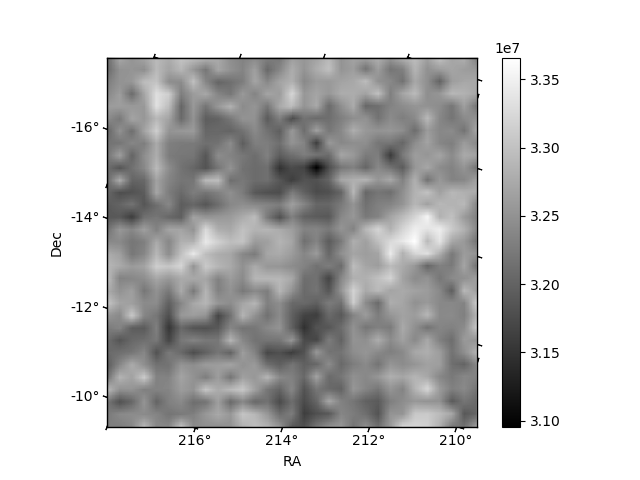
Quadrant B |
|---|---|---|---|
| Quadrant D | 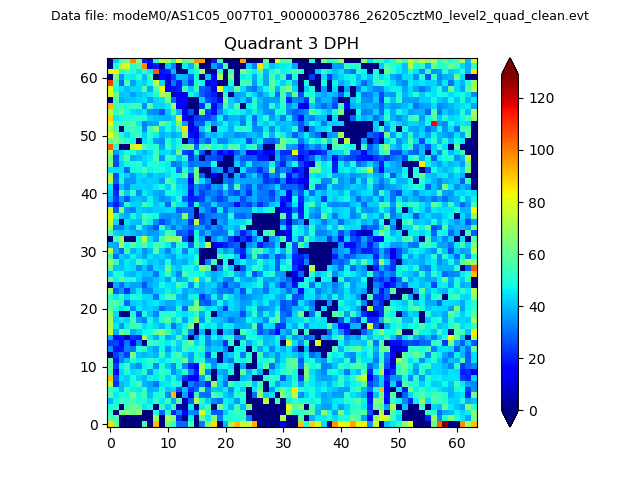 |
 |
Quadrant C |
| Plot type | Count rate plots | Images |
|---|---|---|
| Comparison with Poisson distribution Blue bars denote a histogram of data divided into 1 sec bins. Red curve is a Poisson curve with rate = median count rate of data. |
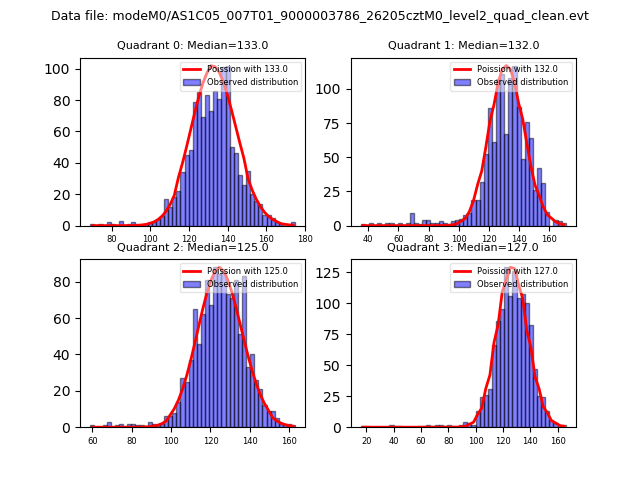 |
 |
| Quadrant-wise count rates Data is divided into 100 sec bins |
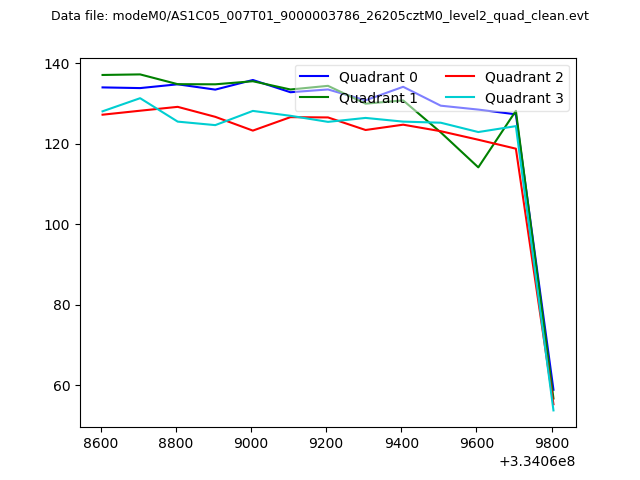 |
|
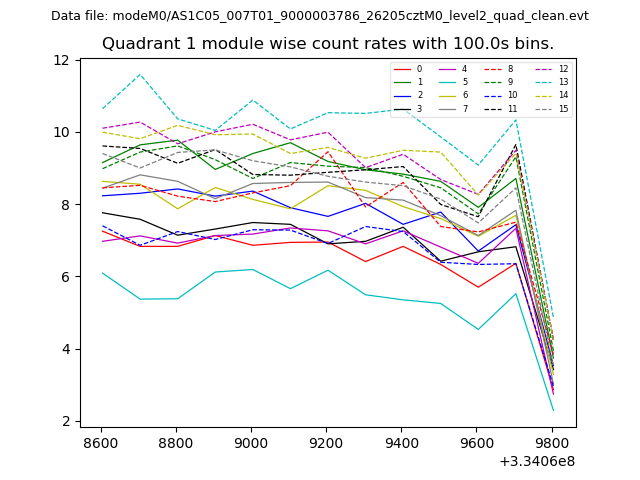
| Module-wise count rates for Quadrant A Data is divided into 100 sec bins |
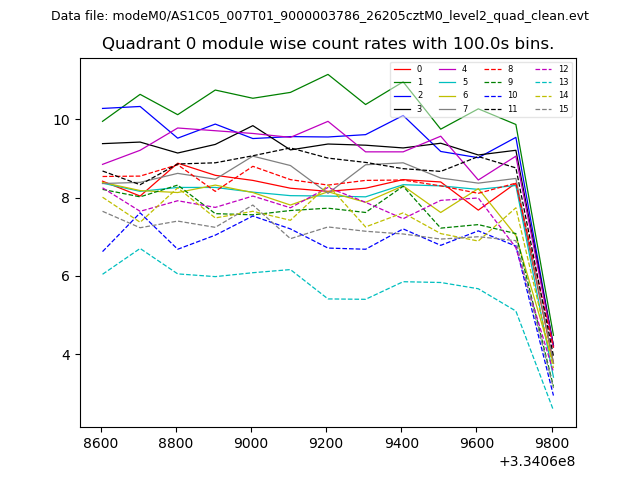 |
 |
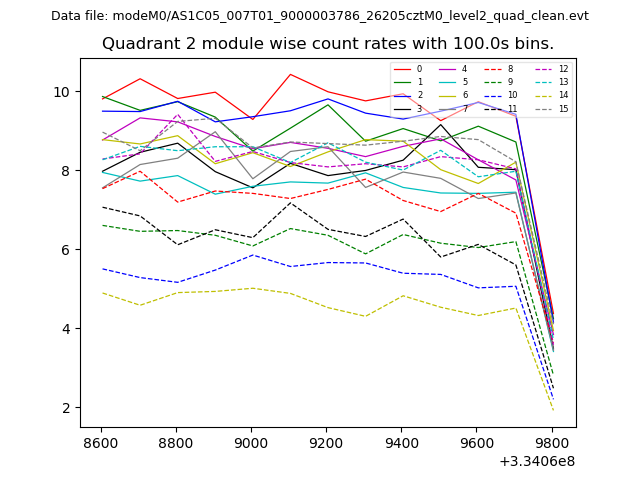
| Module-wise count rates for Quadrant B Data is divided into 100 sec bins |
 |
 |
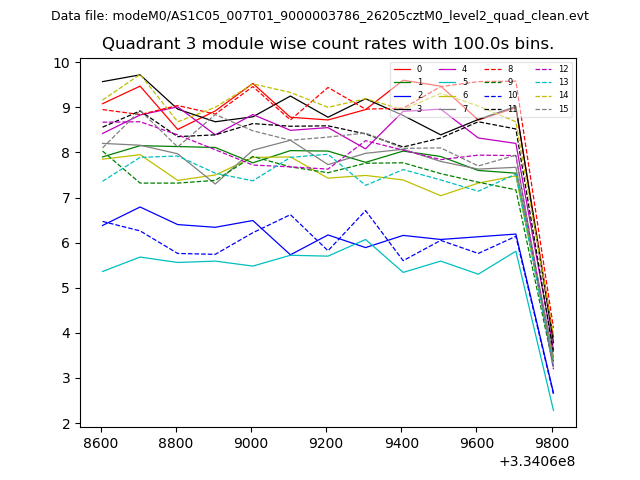
| Module-wise count rates for Quadrant C Data is divided into 100 sec bins |
 |
 |
| Module-wise count rates for Quadrant D Data is divided into 100 sec bins |
 |
 |
| Parameter | Plot |
|---|---|
| CZT HV Monitor | 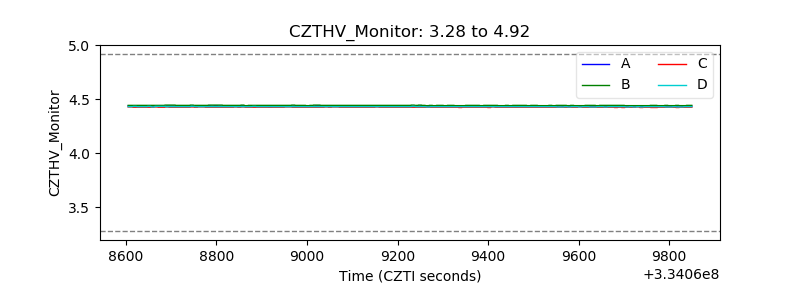 |
| D_VDD | 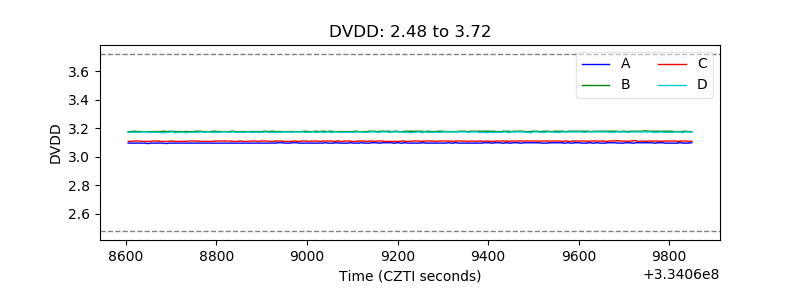 |
| Temperature 1 | 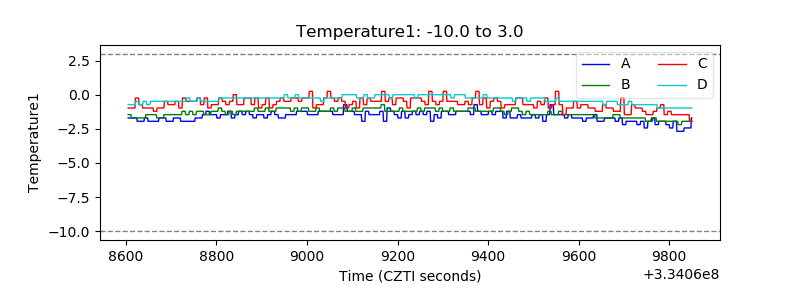 |
| Veto HV Monitor |  |
| Veto LLD | 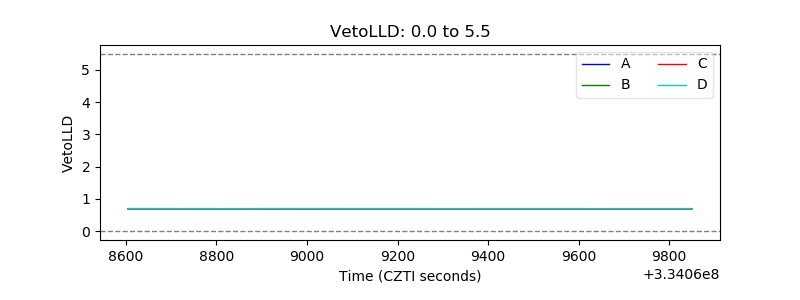 |
| Alpha Counter | 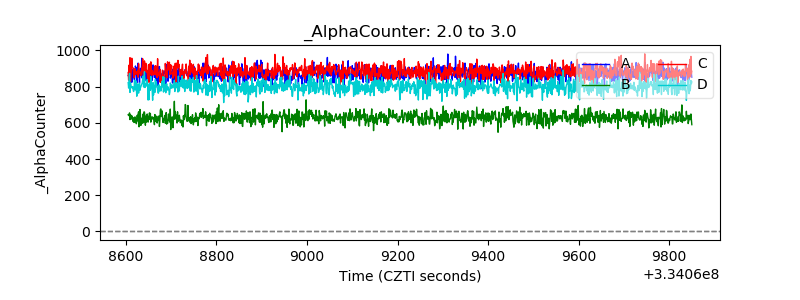 |
| _CPM_Rate | 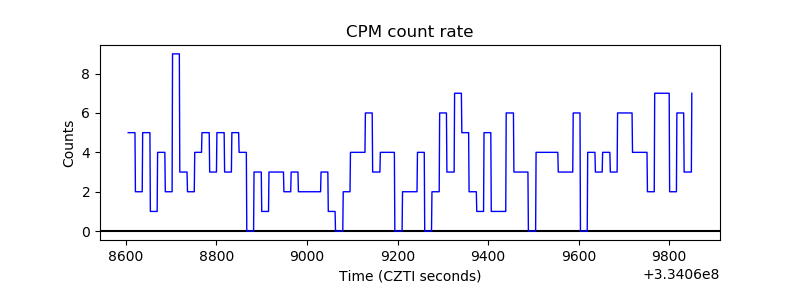 |
| CZT Counter | 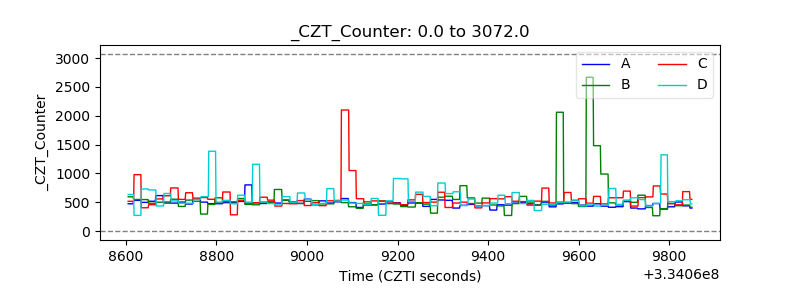 |
| +2.5 Volts monitor | 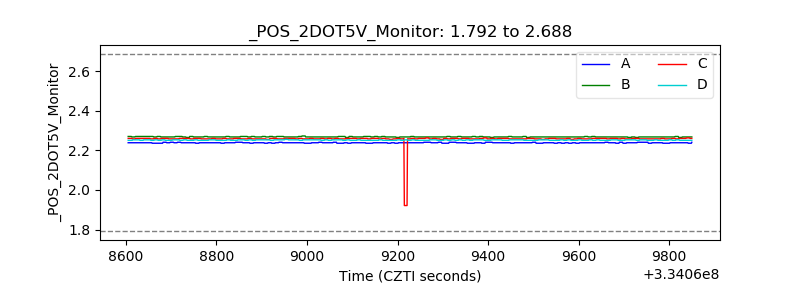 |
| +5 Volts monitor |  |
| _ROLL_ROT |  |
| _Roll_DEC | 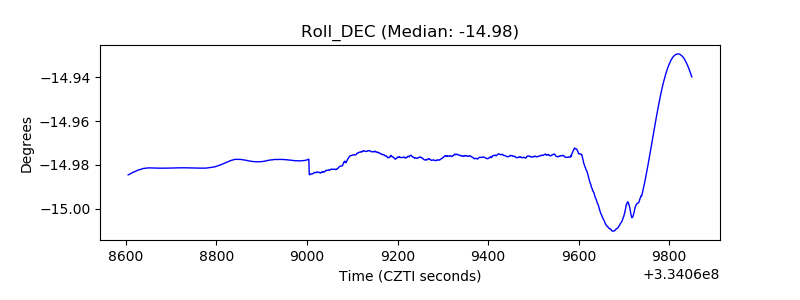 |
| _Roll_RA | 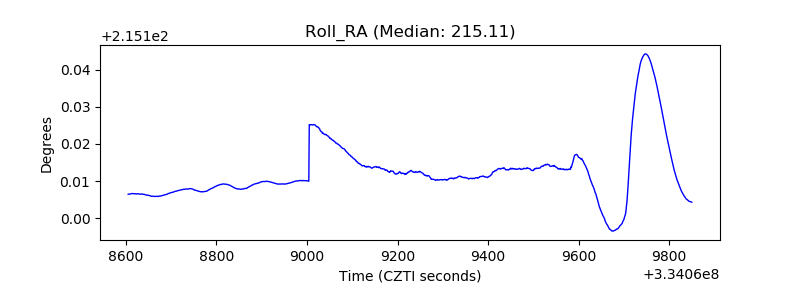 |
| Veto Counter |  |