| Param | Original file | Final file |
|---|---|---|
| Filename | modeM0/AS1C05_019T04_9000003788_26205cztM0_level2.evt | modeM0/AS1C05_019T04_9000003788_26205cztM0_level2_quad_clean.evt |
| Size (bytes) | 348,825,600 | 89,936,640 |
| Size | 332.7 MB | 85.8 MB |
| Events in quadrant A | 2,372,457 | 607,490 |
| Events in quadrant B | 2,381,307 | 611,234 |
| Events in quadrant C | 2,397,545 | 590,274 |
| Events in quadrant D | 3,091,876 | 583,799 |
| Mode M9 | |||
|---|---|---|---|
| Quadrant | BADHDUFLAG | Total packets | Discarded packets |
| A | 0 | 3 | 0 |
| B | 0 | 3 | 0 |
| C | 0 | 3 | 0 |
| D | 0 | 3 | 0 |
| Mode M0 | |||
|---|---|---|---|
| Quadrant | BADHDUFLAG | Total packets | Discarded packets |
| A | 0 | 10079 | 0 |
| B | 0 | 10086 | 0 |
| C | 0 | 10063 | 0 |
| D | 0 | 12274 | 0 |
| Quadrant | Total seconds | Saturated seconds | Saturation percentage |
|---|---|---|---|
| A | 4711 | 94 | 1.995330% |
| B | 4711 | 148 | 3.141584% |
| C | 4711 | 131 | 2.780726% |
| D | 4711 | 157 | 3.332626% |
Noise dominated data is calculated using 1-second bins in cleaned event files. If a bin has >2000 counts, and if more than 50% of those come from <1% of pixels, then it is considered to be noise-dominated and hence unusable.
| Quadrant | # 1 sec bins | Bins with >0 counts | Bins with >2000 counts | High rate bins dominated by noise | Noise dominated (total time) | Noise dominated (detector-on time) | Marked lightcurve |
|---|---|---|---|---|---|---|---|
| A | 5021 | 4712 | 10 | 10 | 0.20% | 0.21% | 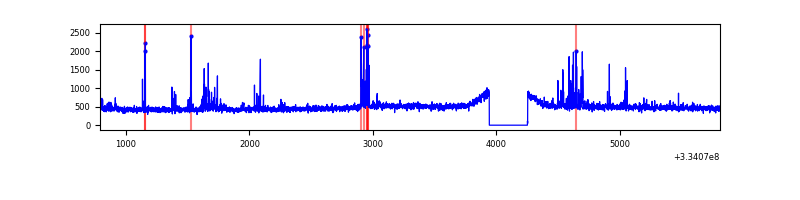 |
| B | 5021 | 4712 | 39 | 39 | 0.78% | 0.83% | 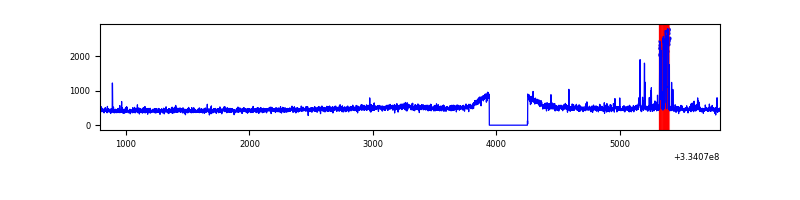 |
| C | 5021 | 4712 | 2 | 2 | 0.04% | 0.04% | 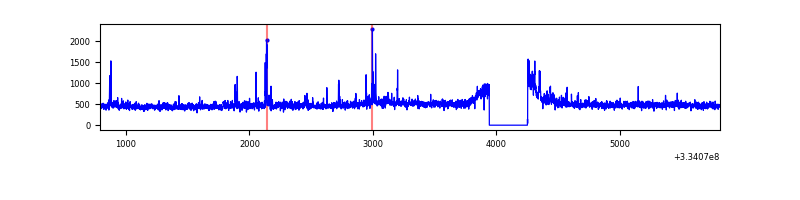 |
| D | 5021 | 4712 | 95 | 95 | 1.89% | 2.02% | 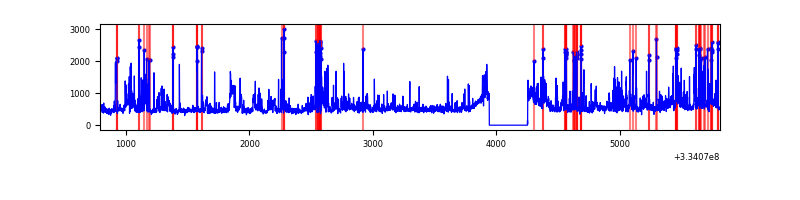 |
Top three noisy pixels from each quadrant. If the there are fewer than three noisy pixels in the level2.evt file, extra rows are filled as -1
| Pixel properties | Quadrant properties | ||||||
|---|---|---|---|---|---|---|---|
| Quadrant | DetID | PixID | Counts | Sigma | Mean | Median | Sigma |
| A | 0 | 13 | 147063 | 1250.22 | 577 | 563 | 117.2 |
| A | 13 | 254 | 7517 | 59.35 | 577 | 563 | 117.2 |
| A | 3 | 137 | 5444 | 41.65 | 577 | 563 | 117.2 |
| B | 5 | 172 | 128281 | 1154.21 | 571 | 556 | 110.7 |
| B | 12 | 111 | 13804 | 119.72 | 571 | 556 | 110.7 |
| B | 11 | 111 | 12209 | 105.3 | 571 | 556 | 110.7 |
| C | 3 | 233 | 152996 | 1167.46 | 553 | 556 | 130.6 |
| C | 14 | 238 | 88016 | 669.81 | 553 | 556 | 130.6 |
| C | 13 | 61 | 3875 | 25.42 | 553 | 556 | 130.6 |
| D | 1 | 52 | 842694 | 6291.67 | 557 | 542 | 133.9 |
| D | 12 | 233 | 132734 | 987.6 | 557 | 542 | 133.9 |
| D | 2 | 234 | 19763 | 143.6 | 557 | 542 | 133.9 |
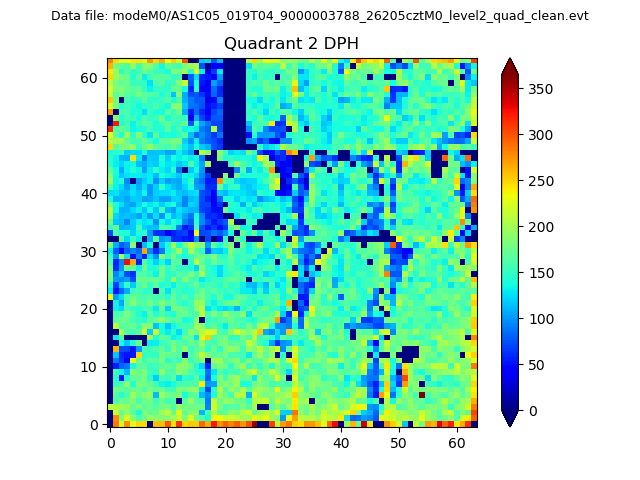
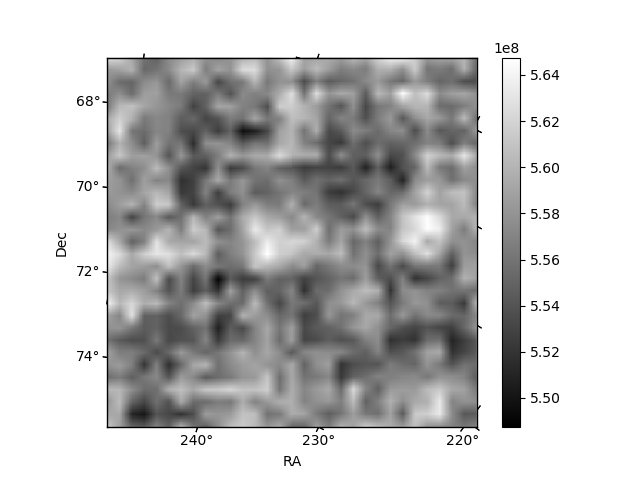
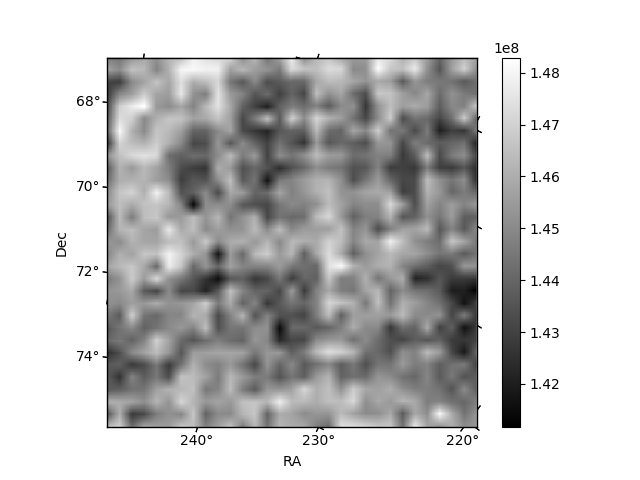
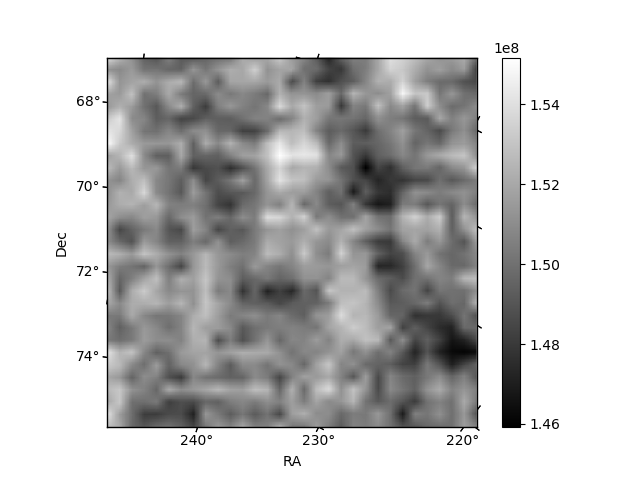
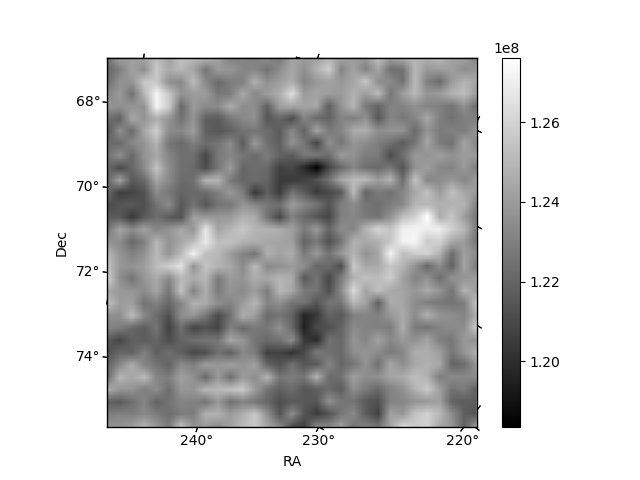
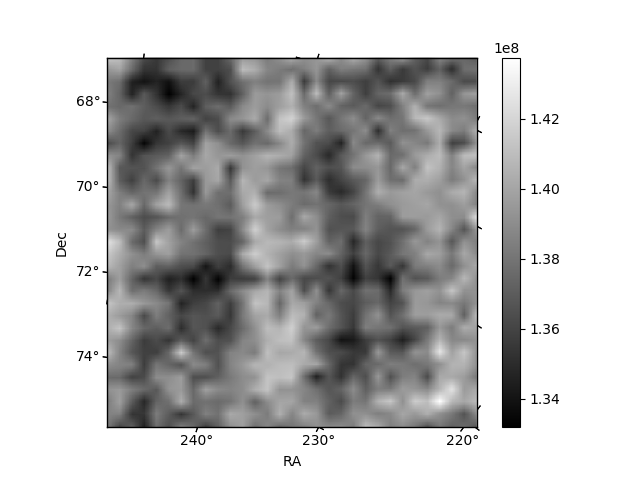
Histogram calculated using DETX and DETY for each event in the final _common_clean file
| Quadrant A | 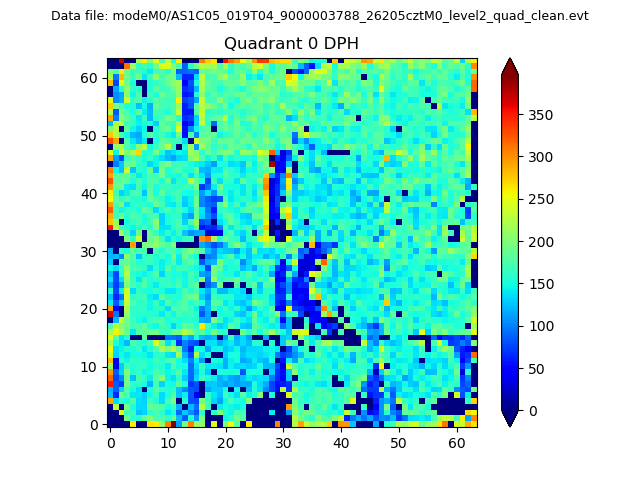 |
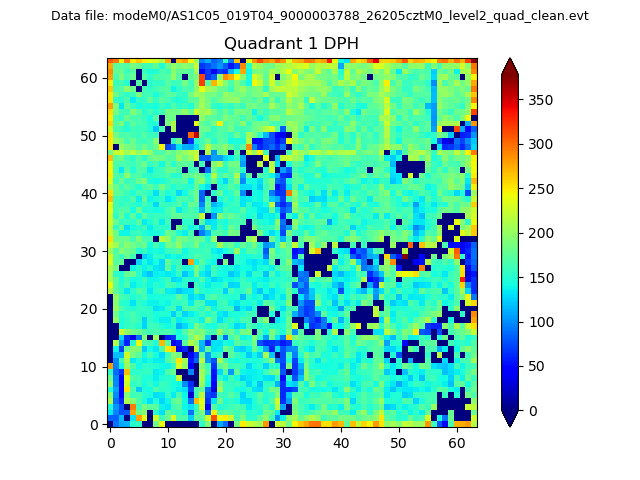 |
Quadrant B |
|---|---|---|---|
| Quadrant D | 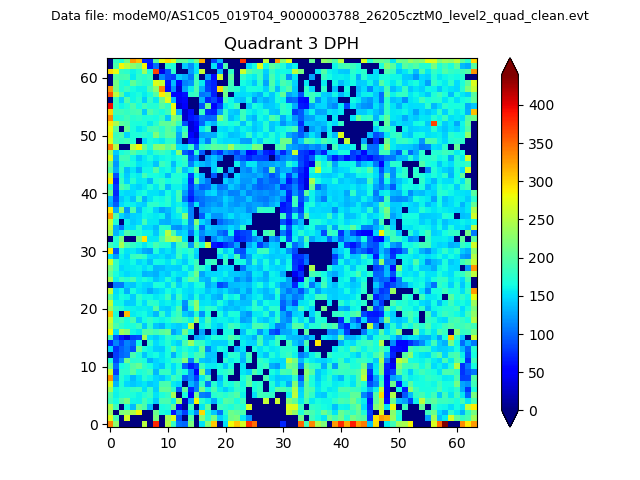 |
 |
Quadrant C |
| Plot type | Count rate plots | Images |
|---|---|---|
| Comparison with Poisson distribution Blue bars denote a histogram of data divided into 1 sec bins. Red curve is a Poisson curve with rate = median count rate of data. |
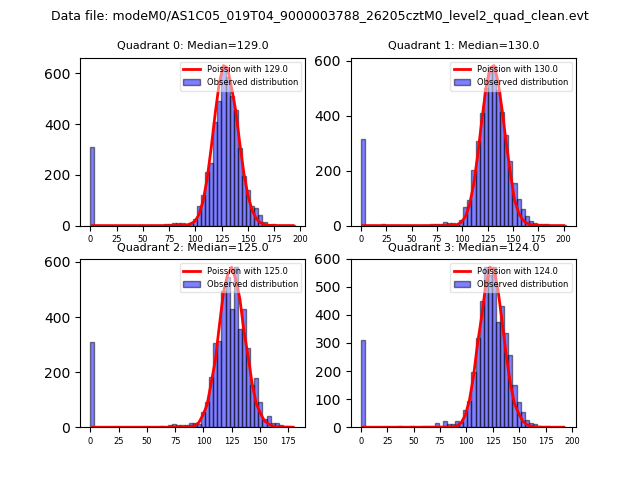 |
 |
| Quadrant-wise count rates Data is divided into 100 sec bins |
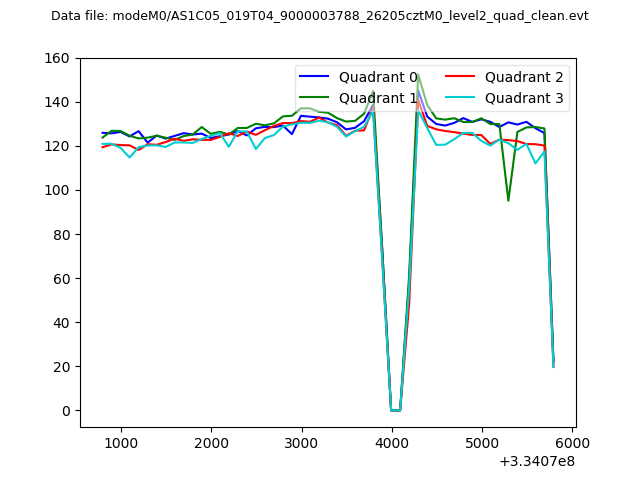 |
|
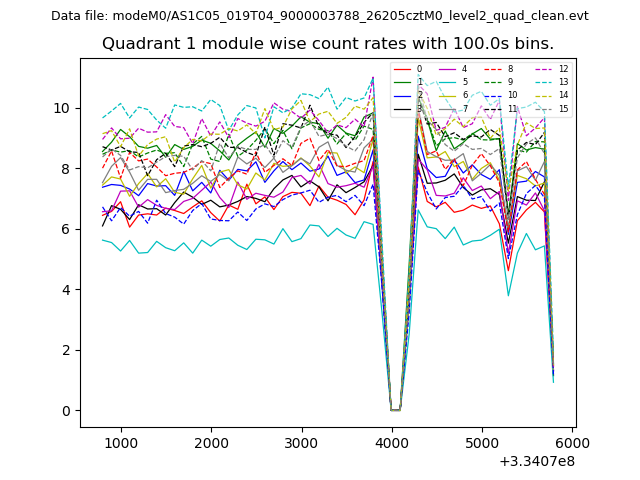
| Module-wise count rates for Quadrant A Data is divided into 100 sec bins |
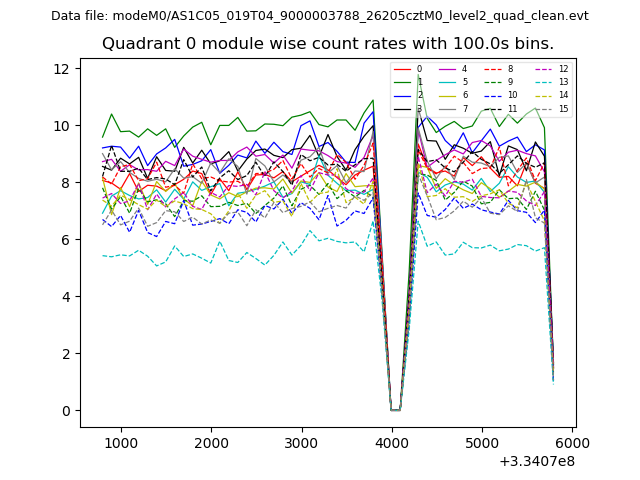 |
 |
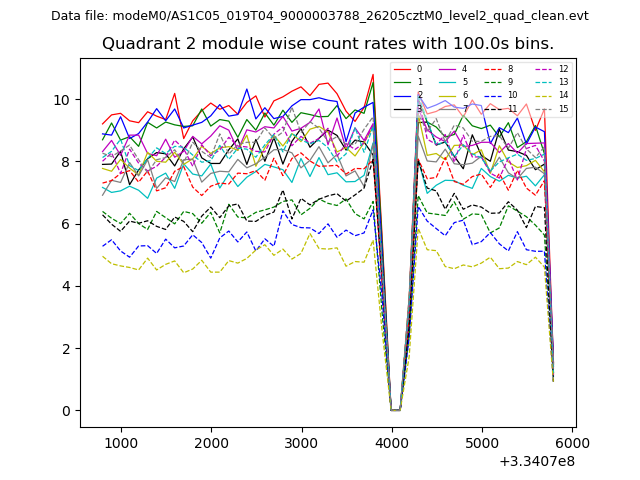
| Module-wise count rates for Quadrant B Data is divided into 100 sec bins |
 |
 |
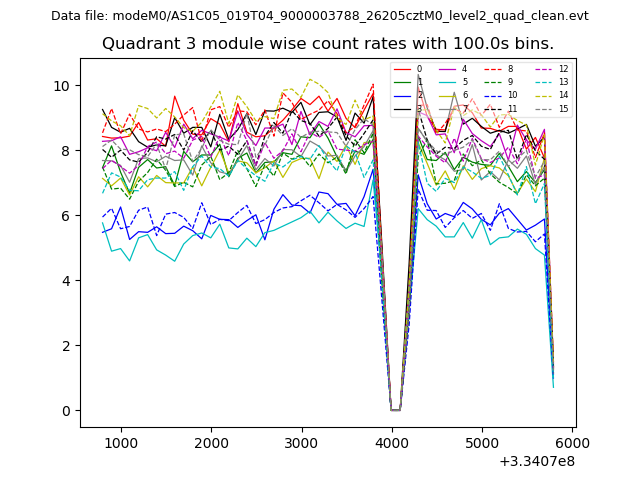
| Module-wise count rates for Quadrant C Data is divided into 100 sec bins |
 |
 |
| Module-wise count rates for Quadrant D Data is divided into 100 sec bins |
 |
 |
| Parameter | Plot |
|---|---|
| CZT HV Monitor | 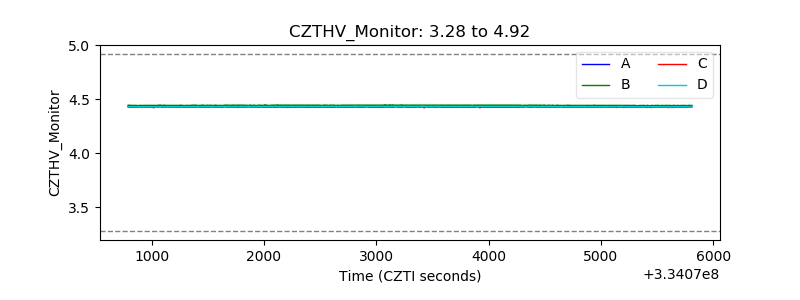 |
| D_VDD | 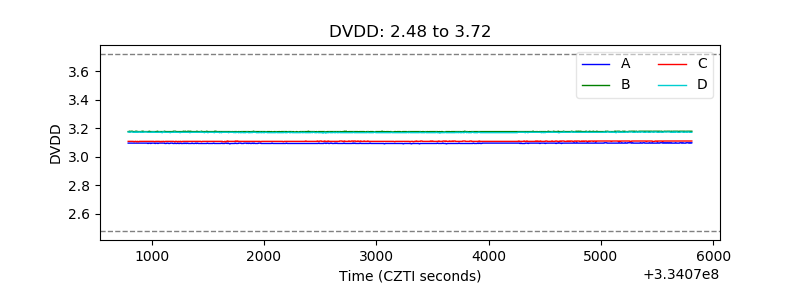 |
| Temperature 1 | 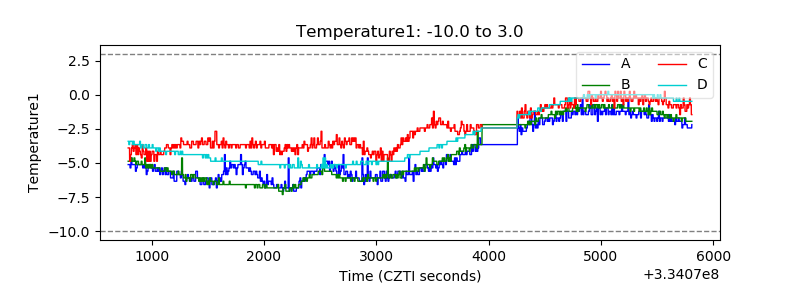 |
| Veto HV Monitor | 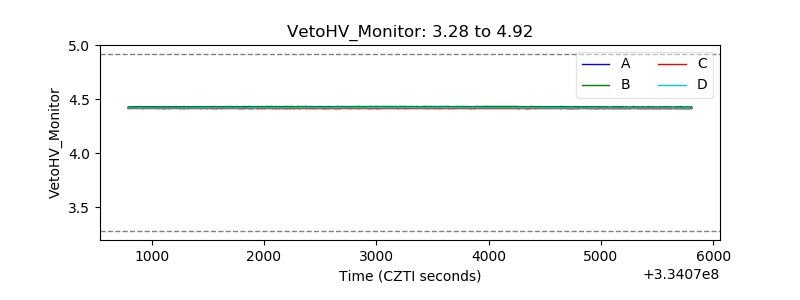 |
| Veto LLD | 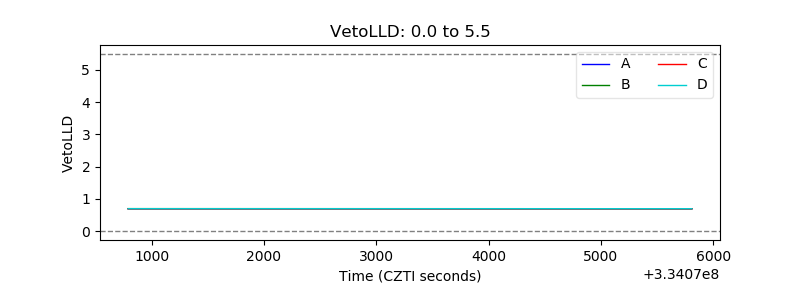 |
| Alpha Counter | 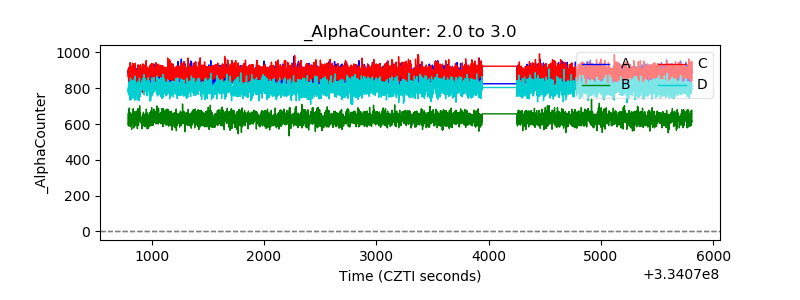 |
| _CPM_Rate | 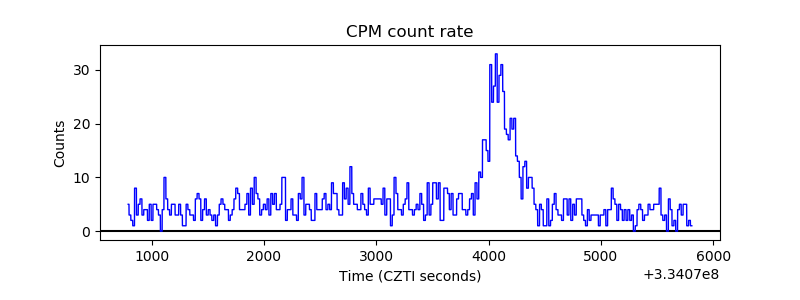 |
| CZT Counter | 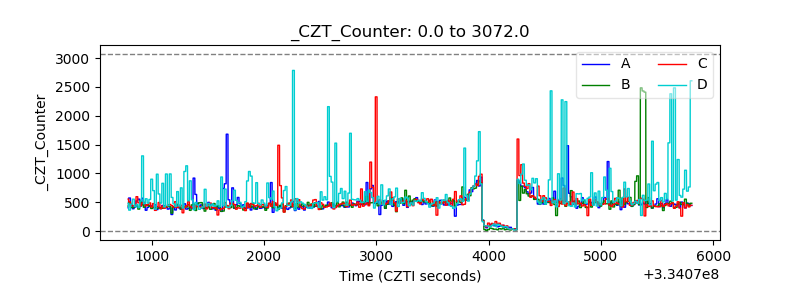 |
| +2.5 Volts monitor | 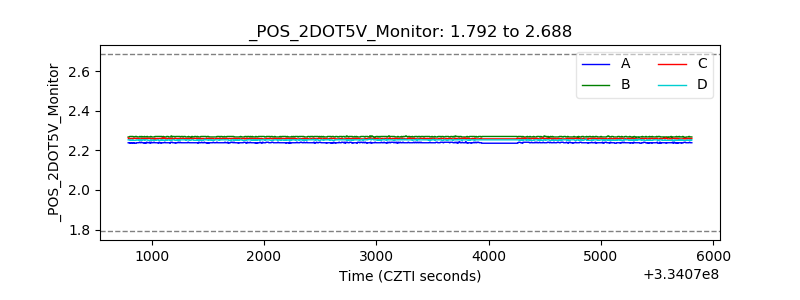 |
| +5 Volts monitor | 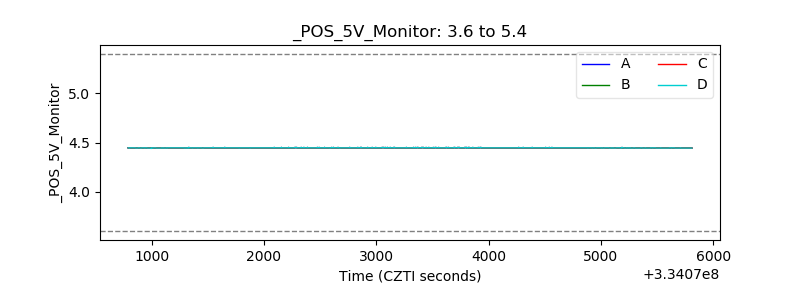 |
| _ROLL_ROT | 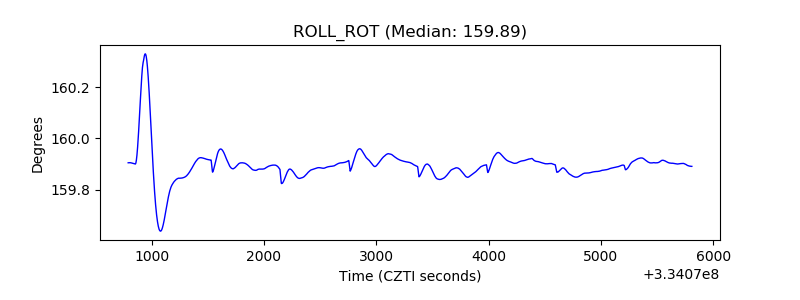 |
| _Roll_DEC | 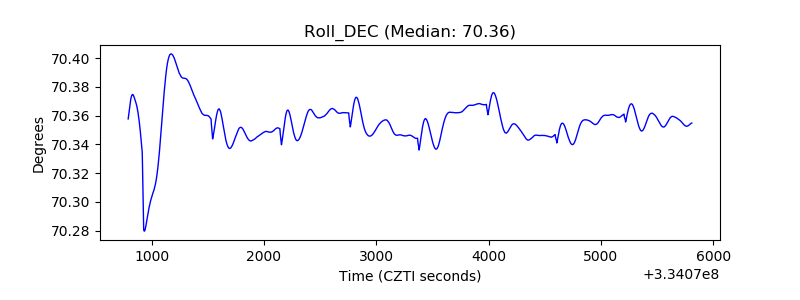 |
| _Roll_RA | 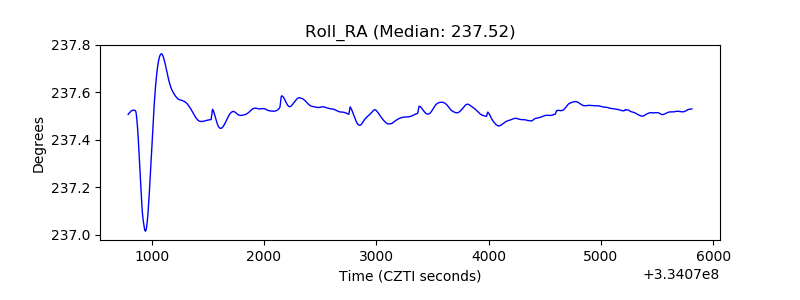 |
| Veto Counter | 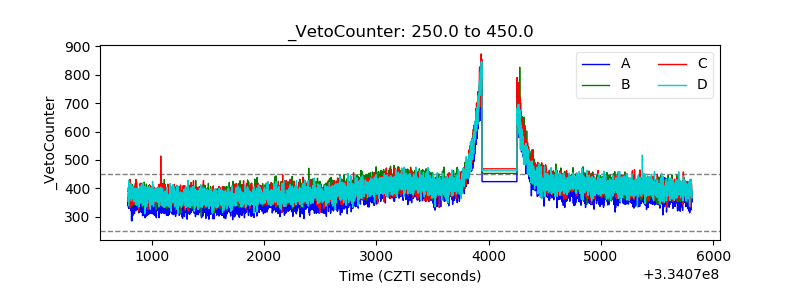 |