| Param | Original file | Final file |
|---|---|---|
| Filename | modeM0/AS1C05_019T04_9000003788_26207cztM0_level2.evt | modeM0/AS1C05_019T04_9000003788_26207cztM0_level2_quad_clean.evt |
| Size (bytes) | 915,868,800 | 238,155,840 |
| Size | 873.4 MB | 227.1 MB |
| Events in quadrant A | 6,713,979 | 1,605,223 |
| Events in quadrant B | 6,288,048 | 1,623,891 |
| Events in quadrant C | 6,112,271 | 1,562,379 |
| Events in quadrant D | 7,764,183 | 1,545,143 |
| Mode M9 | |||
|---|---|---|---|
| Quadrant | BADHDUFLAG | Total packets | Discarded packets |
| A | 0 | 13 | 0 |
| B | 0 | 13 | 0 |
| C | 0 | 13 | 0 |
| D | 0 | 13 | 0 |
| Mode M0 | |||
|---|---|---|---|
| Quadrant | BADHDUFLAG | Total packets | Discarded packets |
| A | 0 | 28494 | 0 |
| B | 0 | 26978 | 0 |
| C | 0 | 26228 | 0 |
| D | 0 | 31878 | 0 |
| Quadrant | Total seconds | Saturated seconds | Saturation percentage |
|---|---|---|---|
| A | 12696 | 183 | 1.441399% |
| B | 12697 | 149 | 1.173506% |
| C | 12696 | 126 | 0.992439% |
| D | 12696 | 390 | 3.071834% |
Noise dominated data is calculated using 1-second bins in cleaned event files. If a bin has >2000 counts, and if more than 50% of those come from <1% of pixels, then it is considered to be noise-dominated and hence unusable.
| Quadrant | # 1 sec bins | Bins with >0 counts | Bins with >2000 counts | High rate bins dominated by noise | Noise dominated (total time) | Noise dominated (detector-on time) | Marked lightcurve |
|---|---|---|---|---|---|---|---|
| A | 13921 | 12698 | 88 | 88 | 0.63% | 0.69% | 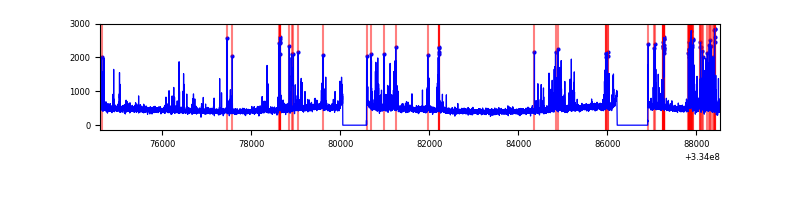 |
| B | 13922 | 12699 | 83 | 83 | 0.60% | 0.65% |  |
| C | 13921 | 12698 | 11 | 11 | 0.08% | 0.09% | 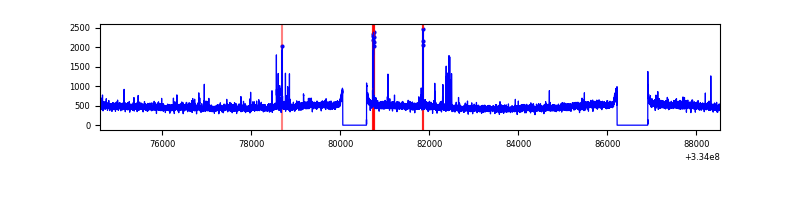 |
| D | 13921 | 12698 | 332 | 332 | 2.38% | 2.61% | 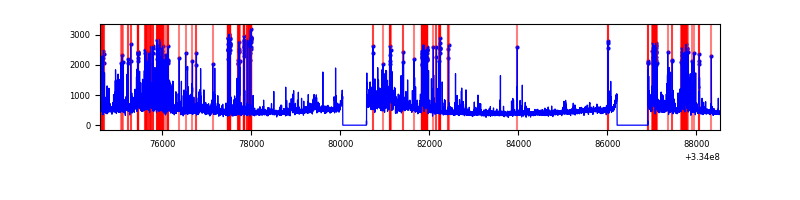 |
Top three noisy pixels from each quadrant. If the there are fewer than three noisy pixels in the level2.evt file, extra rows are filled as -1
| Pixel properties | Quadrant properties | ||||||
|---|---|---|---|---|---|---|---|
| Quadrant | DetID | PixID | Counts | Sigma | Mean | Median | Sigma |
| A | 0 | 13 | 924526 | 3066.57 | 1500 | 1466 | 301.0 |
| A | 13 | 254 | 21330 | 65.99 | 1500 | 1466 | 301.0 |
| A | 3 | 137 | 13485 | 39.93 | 1500 | 1466 | 301.0 |
| B | 5 | 172 | 359507 | 1273.7 | 1492 | 1452 | 281.1 |
| B | 0 | 190 | 48417 | 167.07 | 1492 | 1452 | 281.1 |
| B | 12 | 111 | 33823 | 115.15 | 1492 | 1452 | 281.1 |
| C | 14 | 238 | 230496 | 677.69 | 1447 | 1451 | 338.0 |
| C | 3 | 233 | 140410 | 411.14 | 1447 | 1451 | 338.0 |
| C | 2 | 16 | 83775 | 243.58 | 1447 | 1451 | 338.0 |
| D | 1 | 52 | 1399496 | 3879.81 | 1453 | 1417 | 360.3 |
| D | 12 | 233 | 771725 | 2137.68 | 1453 | 1417 | 360.3 |
| D | 2 | 234 | 58388 | 158.1 | 1453 | 1417 | 360.3 |
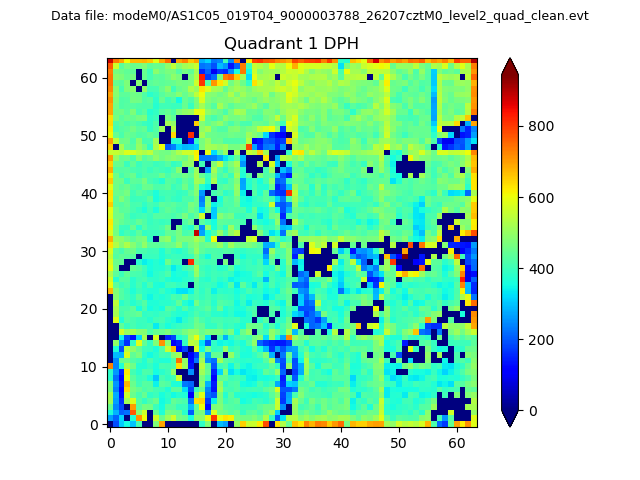
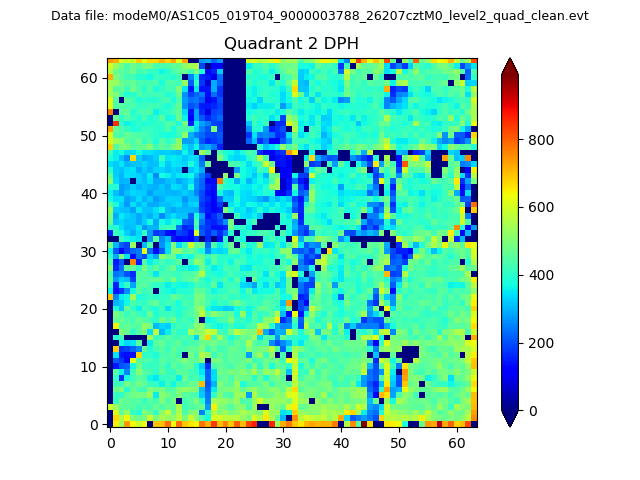
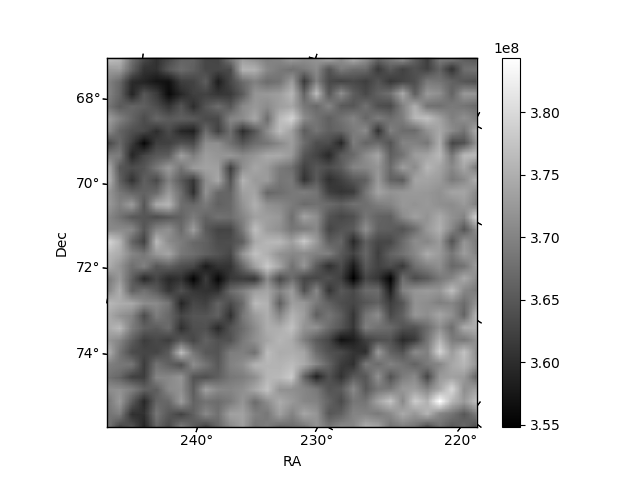
Histogram calculated using DETX and DETY for each event in the final _common_clean file
| Quadrant A |  |
 |
Quadrant B |
|---|---|---|---|
| Quadrant D | 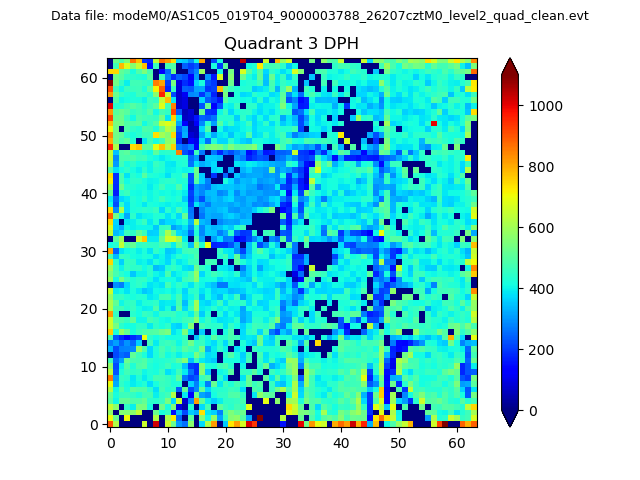 |
 |
Quadrant C |
| Plot type | Count rate plots | Images |
|---|---|---|
| Comparison with Poisson distribution Blue bars denote a histogram of data divided into 1 sec bins. Red curve is a Poisson curve with rate = median count rate of data. |
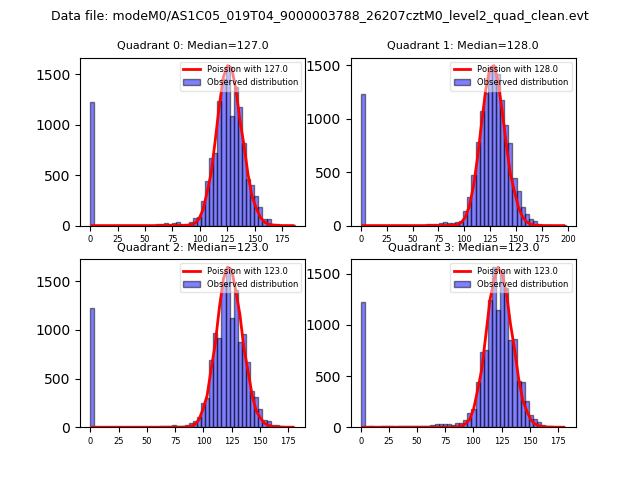 |
 |
| Quadrant-wise count rates Data is divided into 100 sec bins |
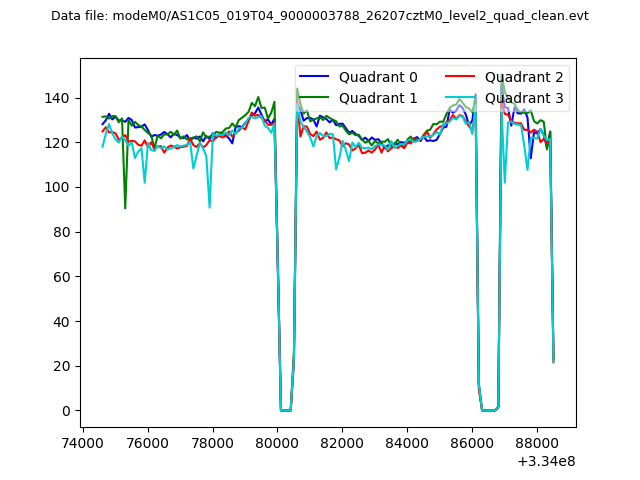 |
|
| Module-wise count rates for Quadrant A Data is divided into 100 sec bins |
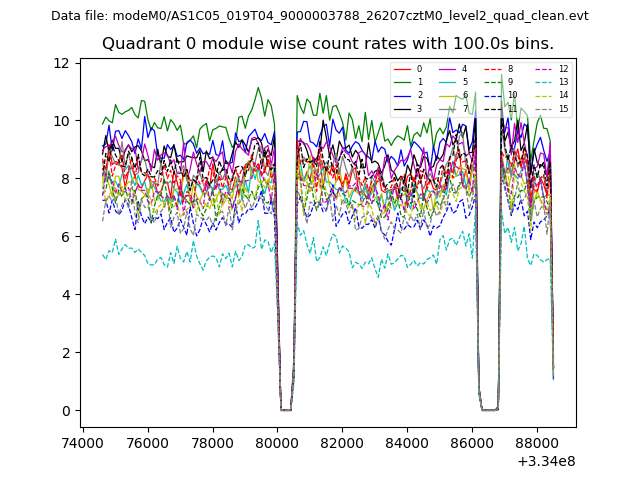 |
 |
| Module-wise count rates for Quadrant B Data is divided into 100 sec bins |
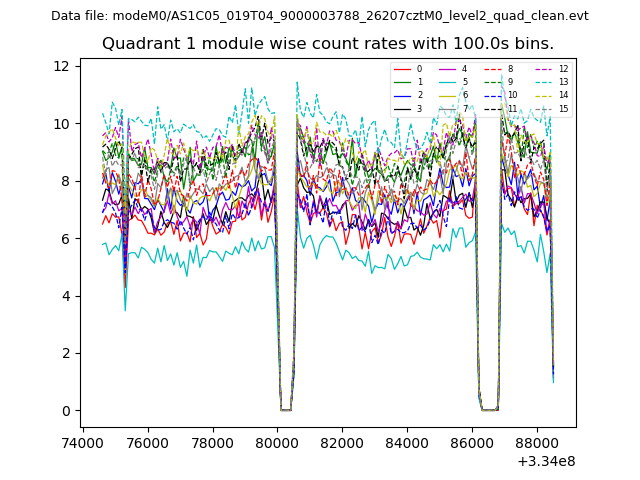 |
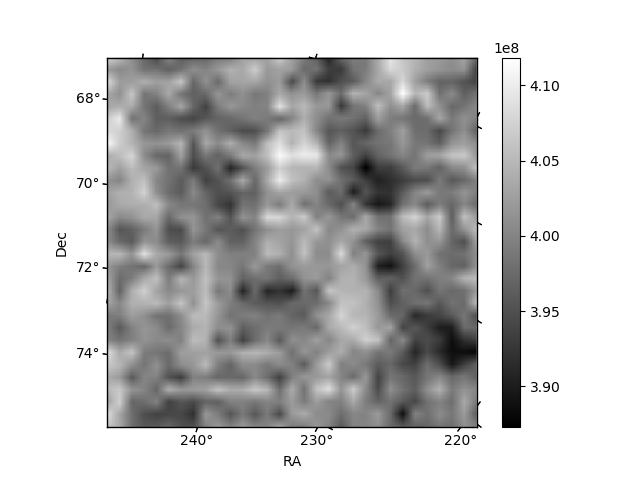 |
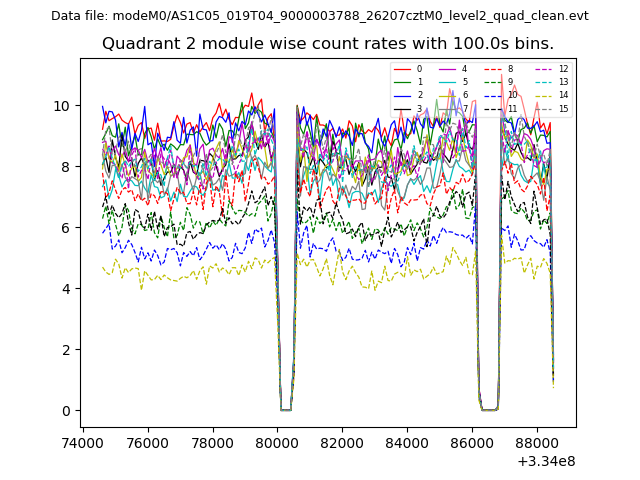
| Module-wise count rates for Quadrant C Data is divided into 100 sec bins |
 |
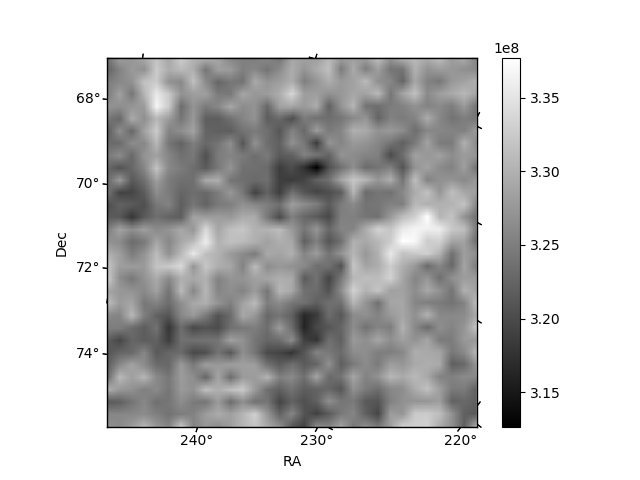 |
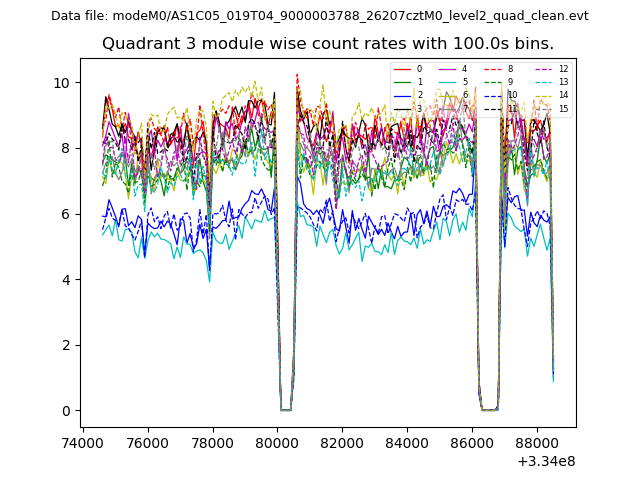
| Module-wise count rates for Quadrant D Data is divided into 100 sec bins |
 |
 |
| Parameter | Plot |
|---|---|
| CZT HV Monitor | 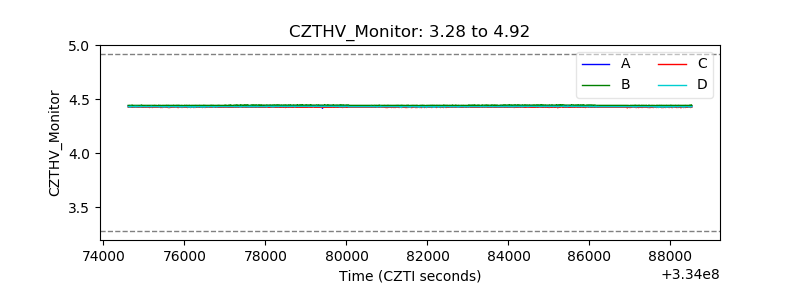 |
| D_VDD | 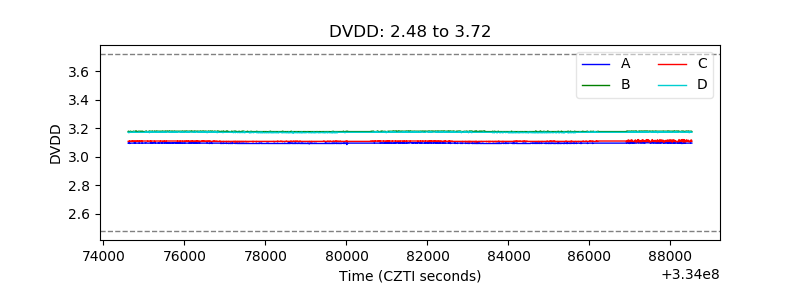 |
| Temperature 1 | 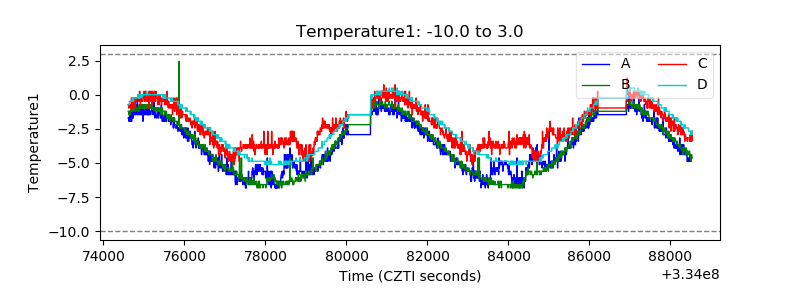 |
| Veto HV Monitor |  |
| Veto LLD | 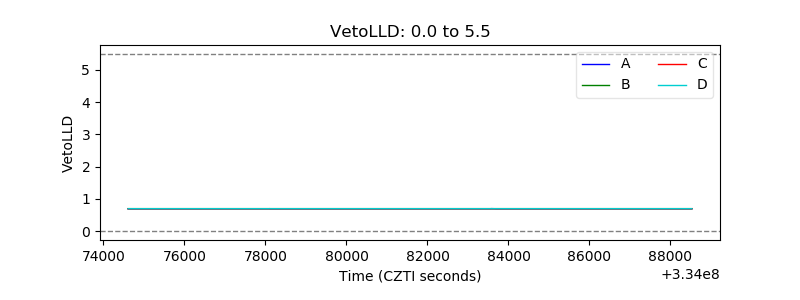 |
| Alpha Counter | 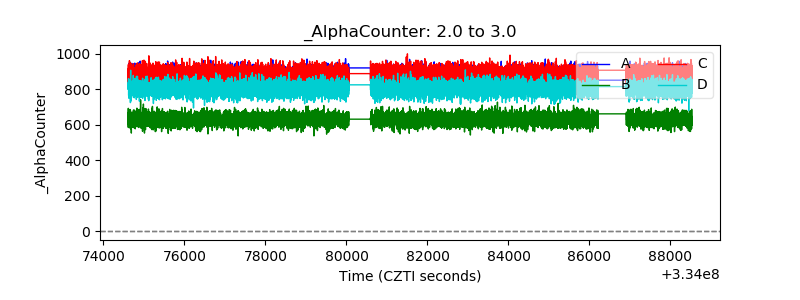 |
| _CPM_Rate | 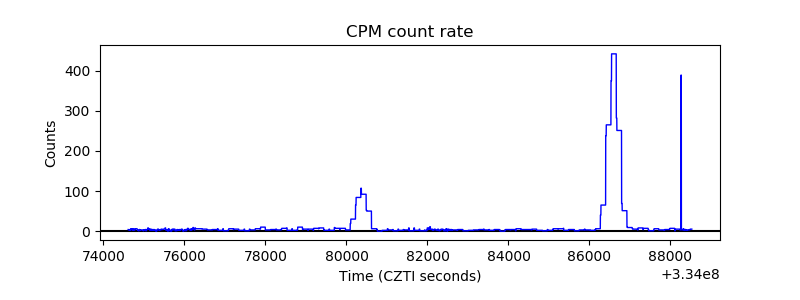 |
| CZT Counter | 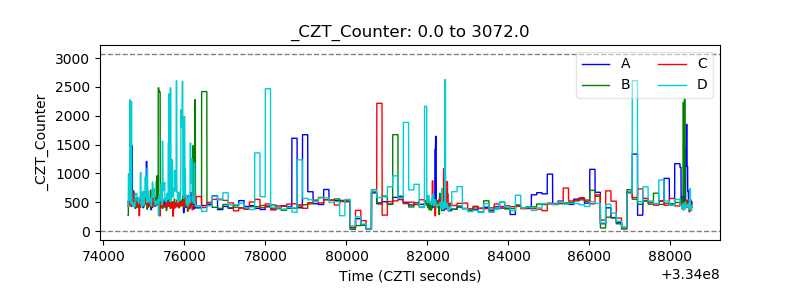 |
| +2.5 Volts monitor |  |
| +5 Volts monitor |  |
| _ROLL_ROT | 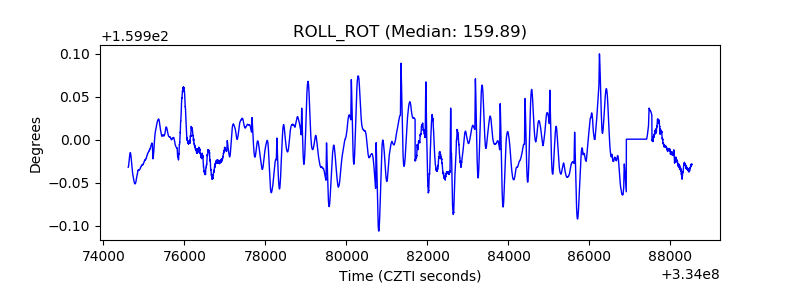 |
| _Roll_DEC |  |
| _Roll_RA |  |
| Veto Counter | 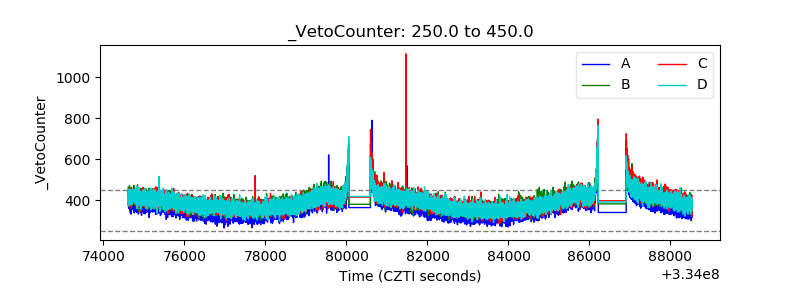 |