| Param | Original file | Final file |
|---|---|---|
| Filename | modeM0/AS1C05_019T04_9000003788_26208cztM0_level2.evt | modeM0/AS1C05_019T04_9000003788_26208cztM0_level2_quad_clean.evt |
| Size (bytes) | 498,240,000 | 128,730,240 |
| Size | 475.2 MB | 122.8 MB |
| Events in quadrant A | 4,150,975 | 859,195 |
| Events in quadrant B | 3,356,010 | 880,986 |
| Events in quadrant C | 3,283,874 | 848,882 |
| Events in quadrant D | 3,837,865 | 837,236 |
| Mode M9 | |||
|---|---|---|---|
| Quadrant | BADHDUFLAG | Total packets | Discarded packets |
| A | 0 | 11 | 0 |
| B | 0 | 12 | 0 |
| C | 0 | 12 | 0 |
| D | 0 | 12 | 0 |
| Mode M0 | |||
|---|---|---|---|
| Quadrant | BADHDUFLAG | Total packets | Discarded packets |
| A | 0 | 16819 | 0 |
| B | 0 | 14431 | 0 |
| C | 0 | 14112 | 0 |
| D | 0 | 16234 | 0 |
| Quadrant | Total seconds | Saturated seconds | Saturation percentage |
|---|---|---|---|
| A | 6789 | 189 | 2.783915% |
| B | 6789 | 61 | 0.898512% |
| C | 6788 | 60 | 0.883913% |
| D | 6788 | 157 | 2.312905% |
Noise dominated data is calculated using 1-second bins in cleaned event files. If a bin has >2000 counts, and if more than 50% of those come from <1% of pixels, then it is considered to be noise-dominated and hence unusable.
| Quadrant | # 1 sec bins | Bins with >0 counts | Bins with >2000 counts | High rate bins dominated by noise | Noise dominated (total time) | Noise dominated (detector-on time) | Marked lightcurve |
|---|---|---|---|---|---|---|---|
| A | 7659 | 6790 | 148 | 148 | 1.93% | 2.18% | 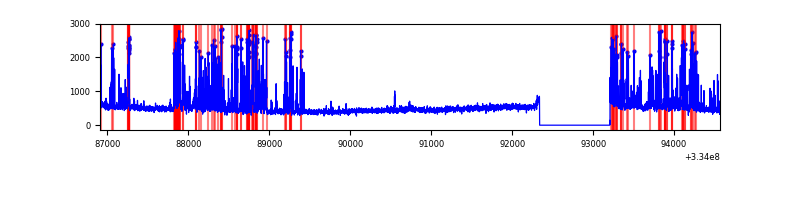 |
| B | 7659 | 6790 | 24 | 24 | 0.31% | 0.35% | 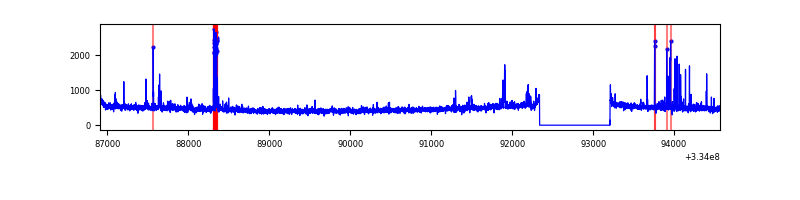 |
| C | 7658 | 6789 | 0 | 0 | 0.00% | 0.00% | 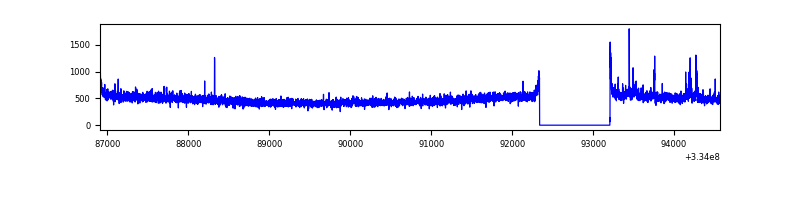 |
| D | 7658 | 6789 | 110 | 110 | 1.44% | 1.62% | 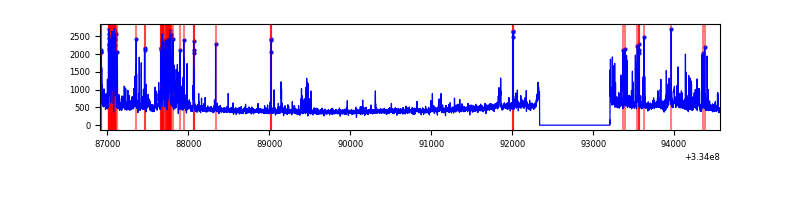 |
Top three noisy pixels from each quadrant. If the there are fewer than three noisy pixels in the level2.evt file, extra rows are filled as -1
| Pixel properties | Quadrant properties | ||||||
|---|---|---|---|---|---|---|---|
| Quadrant | DetID | PixID | Counts | Sigma | Mean | Median | Sigma |
| A | 0 | 13 | 1024803 | 6334.68 | 802 | 784 | 161.7 |
| A | 4 | 2 | 25970 | 155.8 | 802 | 784 | 161.7 |
| A | 13 | 254 | 11801 | 68.15 | 802 | 784 | 161.7 |
| B | 5 | 172 | 87501 | 568.27 | 807 | 786 | 152.6 |
| B | 0 | 190 | 83556 | 542.42 | 807 | 786 | 152.6 |
| B | 12 | 111 | 18100 | 113.46 | 807 | 786 | 152.6 |
| C | 14 | 238 | 122524 | 665.15 | 784 | 788 | 183.0 |
| C | 2 | 16 | 46390 | 249.16 | 784 | 788 | 183.0 |
| C | 3 | 233 | 27251 | 144.59 | 784 | 788 | 183.0 |
| D | 12 | 233 | 433003 | 2246.87 | 786 | 765 | 192.4 |
| D | 1 | 52 | 256610 | 1329.94 | 786 | 765 | 192.4 |
| D | 7 | 38 | 74120 | 381.31 | 786 | 765 | 192.4 |
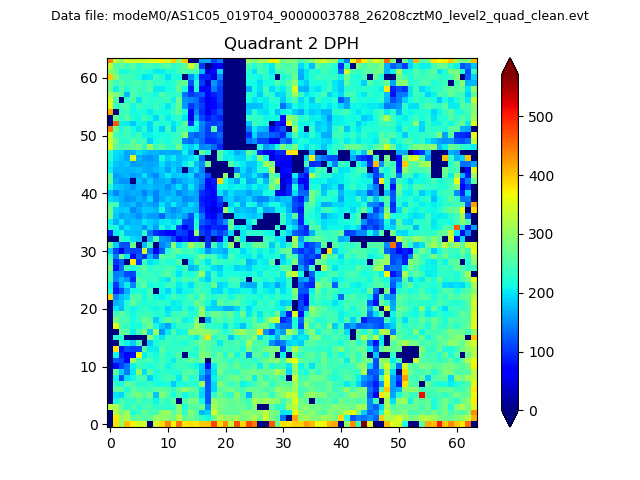
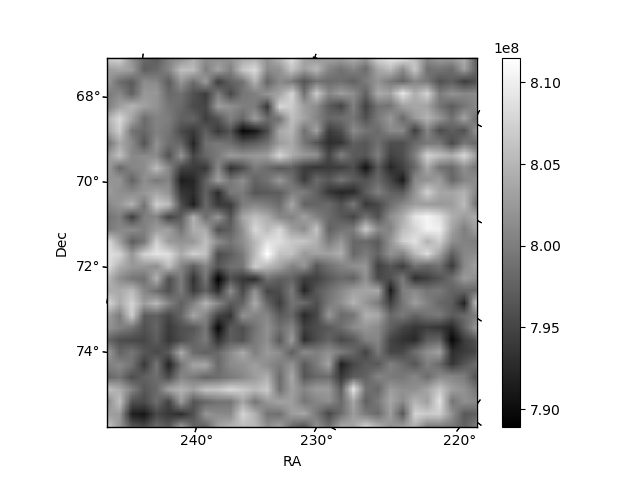
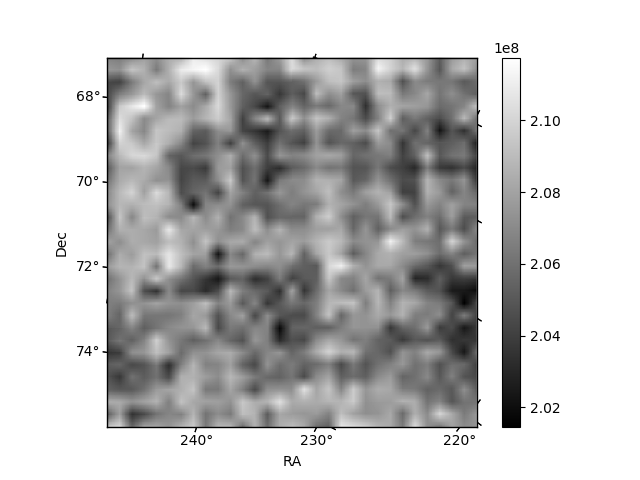
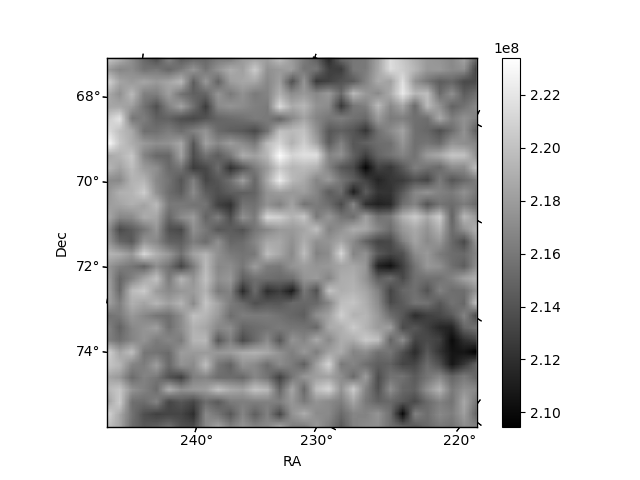
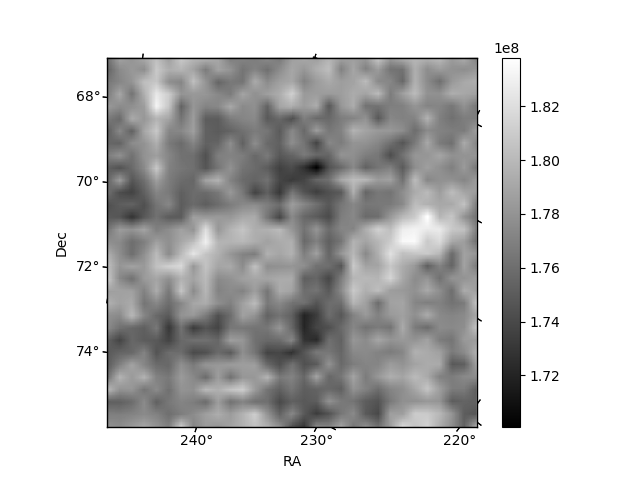
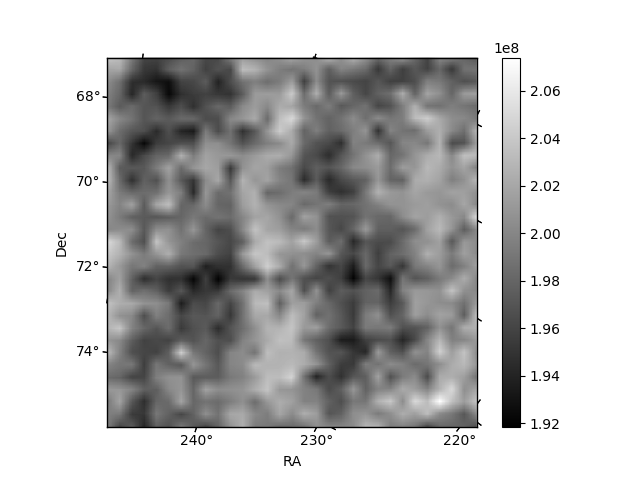
Histogram calculated using DETX and DETY for each event in the final _common_clean file
| Quadrant A | 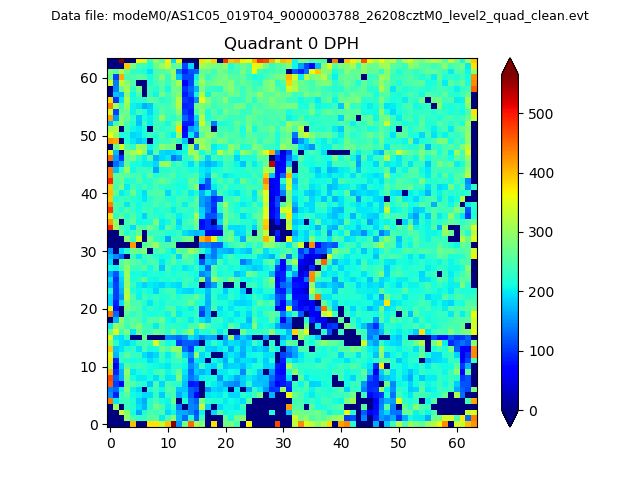 |
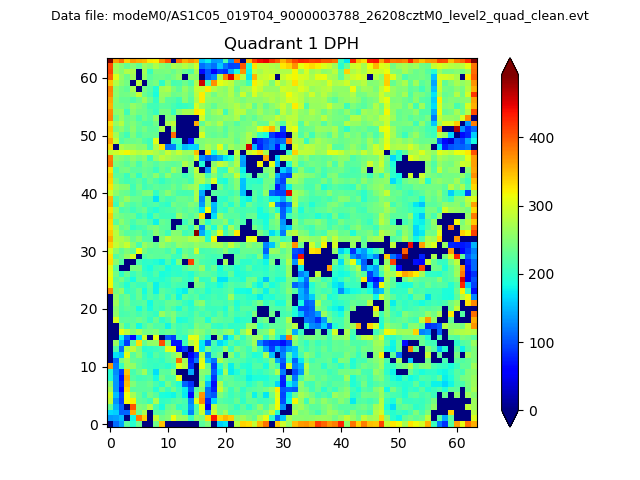 |
Quadrant B |
|---|---|---|---|
| Quadrant D | 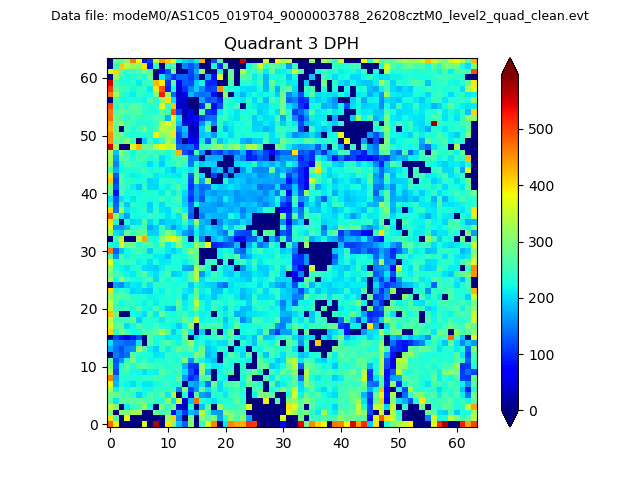 |
 |
Quadrant C |
| Plot type | Count rate plots | Images |
|---|---|---|
| Comparison with Poisson distribution Blue bars denote a histogram of data divided into 1 sec bins. Red curve is a Poisson curve with rate = median count rate of data. |
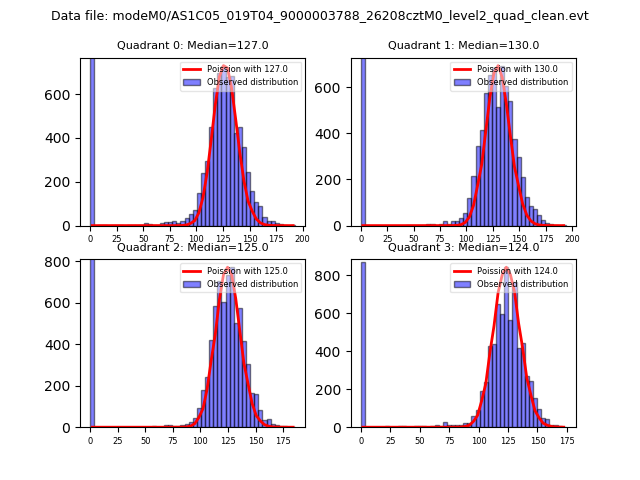 |
 |
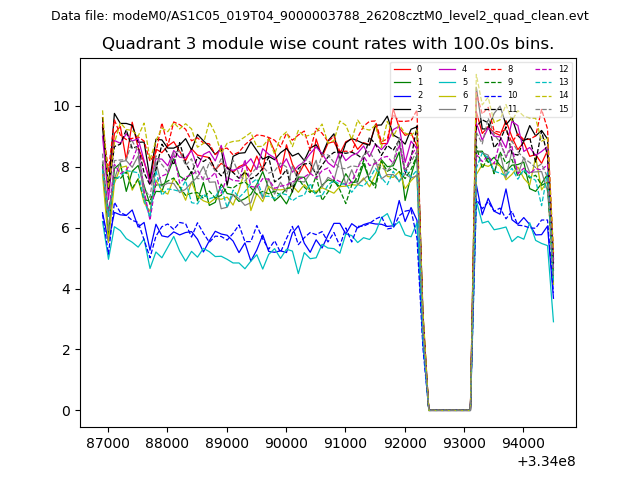
| Quadrant-wise count rates Data is divided into 100 sec bins |
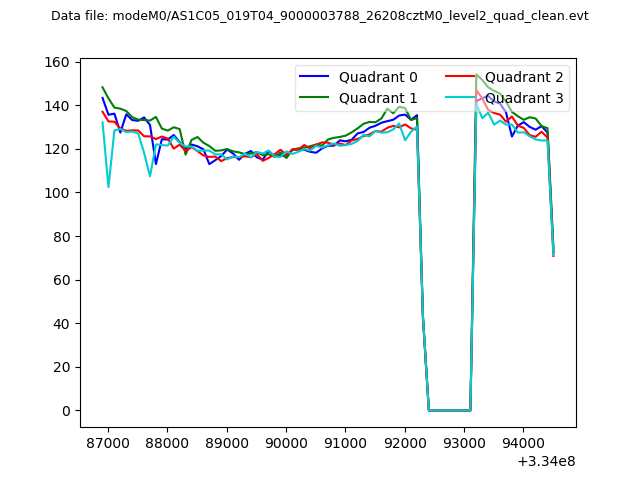 |
|
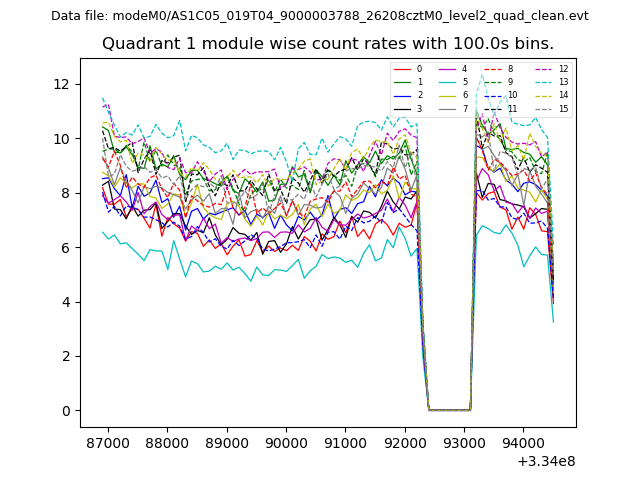
| Module-wise count rates for Quadrant A Data is divided into 100 sec bins |
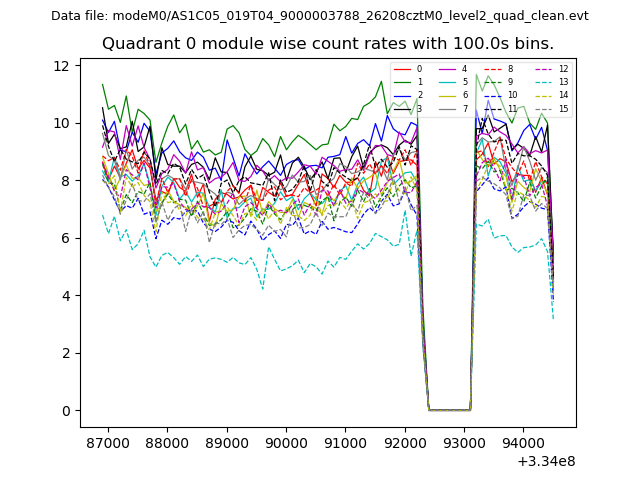 |
 |
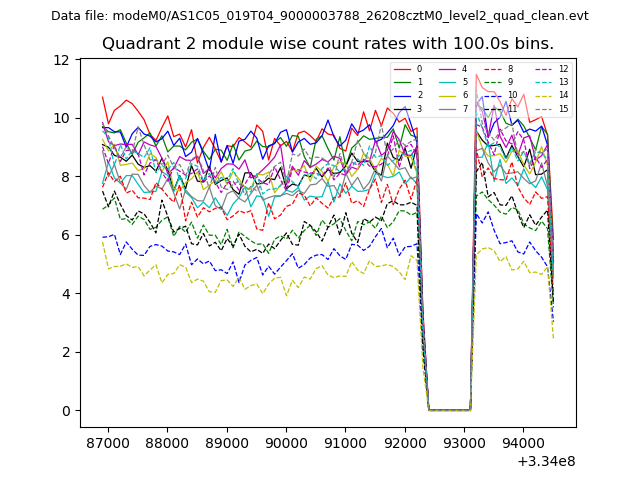
| Module-wise count rates for Quadrant B Data is divided into 100 sec bins |
 |
 |
| Module-wise count rates for Quadrant C Data is divided into 100 sec bins |
 |
 |
| Module-wise count rates for Quadrant D Data is divided into 100 sec bins |
 |
 |
| Parameter | Plot |
|---|---|
| CZT HV Monitor | 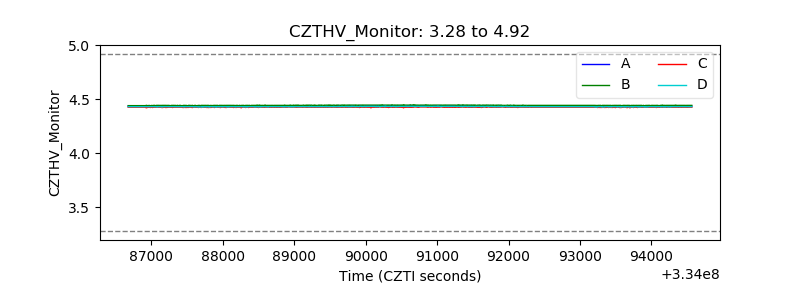 |
| D_VDD | 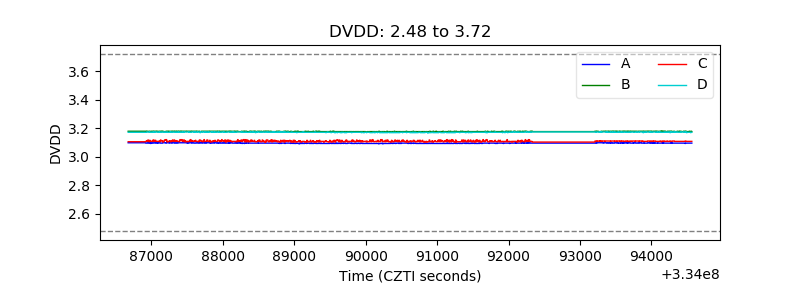 |
| Temperature 1 | 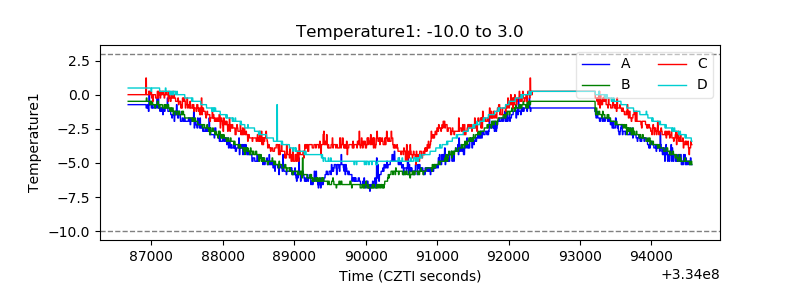 |
| Veto HV Monitor | 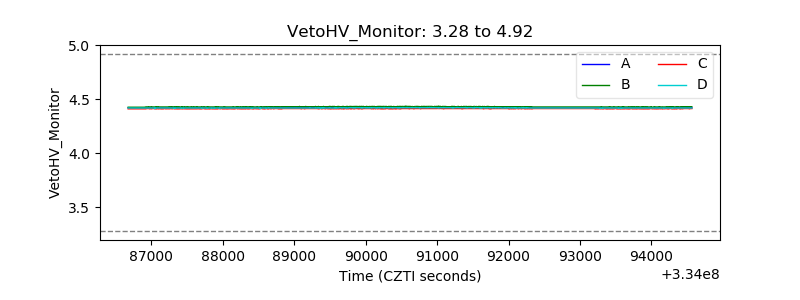 |
| Veto LLD | 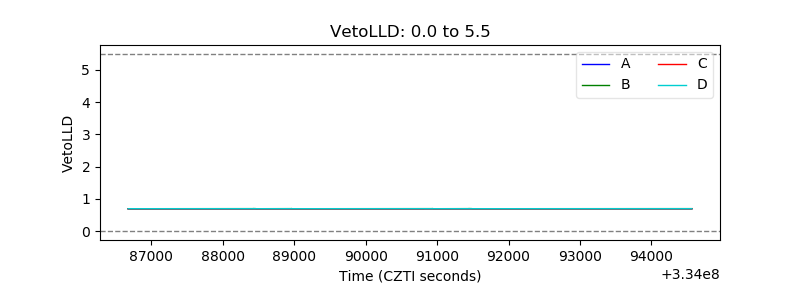 |
| Alpha Counter | 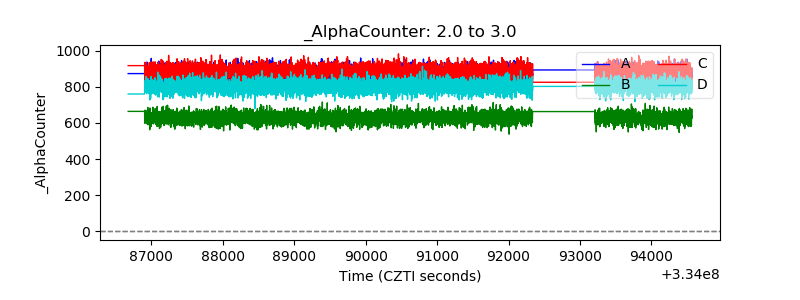 |
| _CPM_Rate | 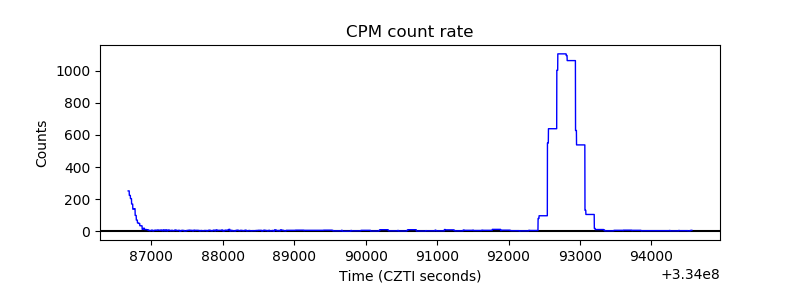 |
| CZT Counter | 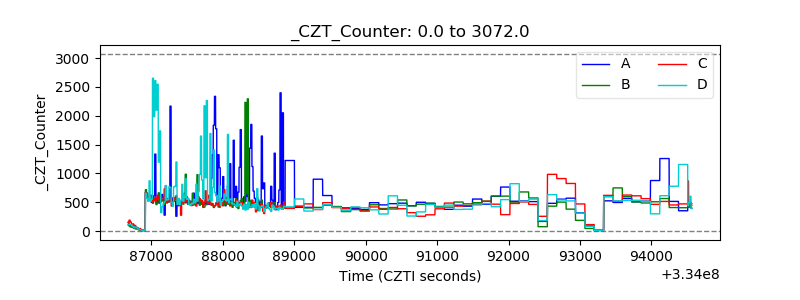 |
| +2.5 Volts monitor | 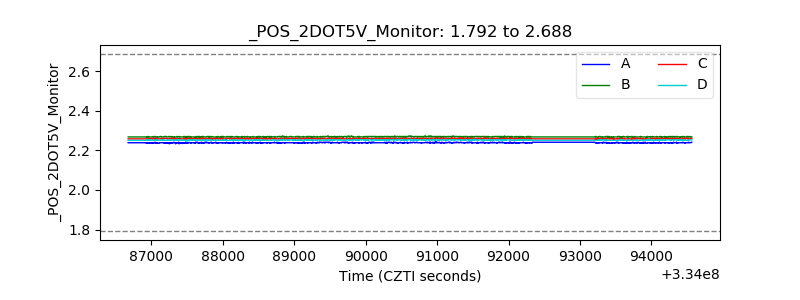 |
| +5 Volts monitor | 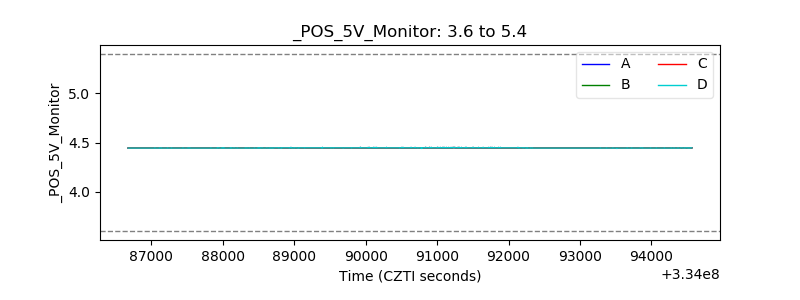 |
| _ROLL_ROT | 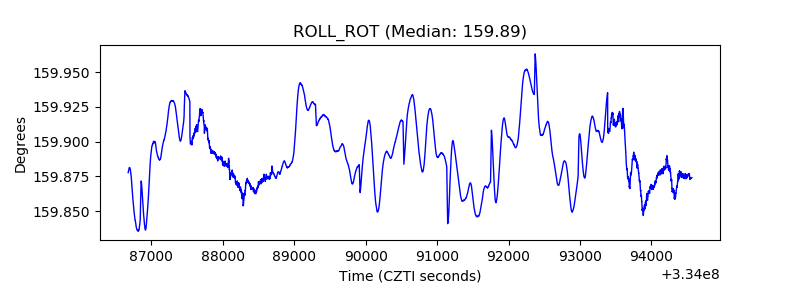 |
| _Roll_DEC | 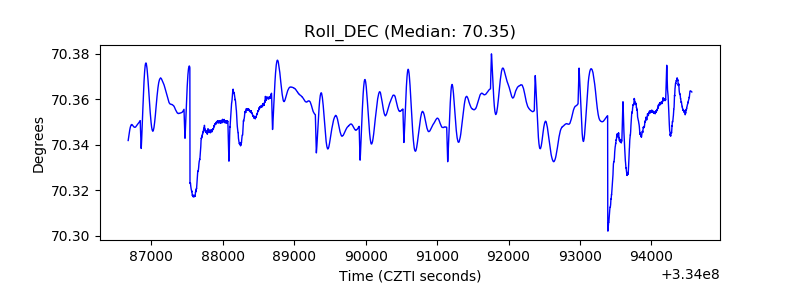 |
| _Roll_RA | 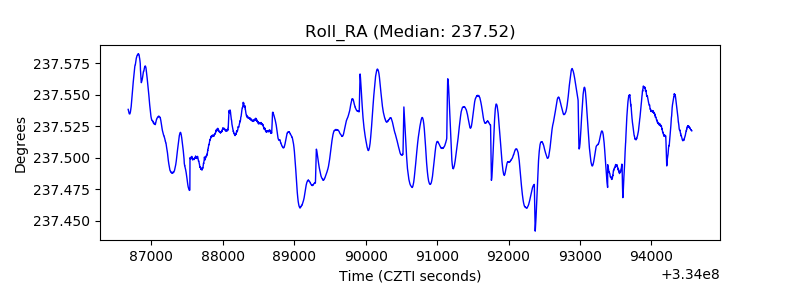 |
| Veto Counter | 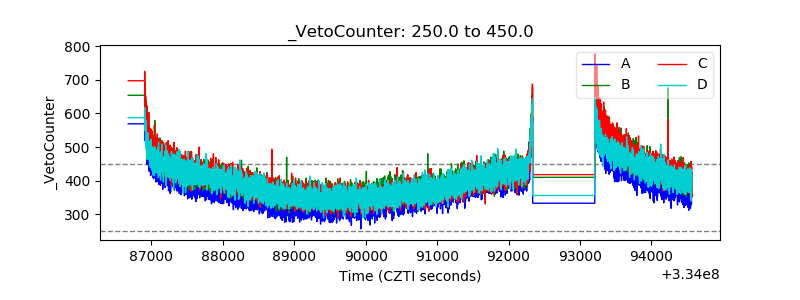 |