| Param | Original file | Final file |
|---|---|---|
| Filename | modeM0/AS1C05_019T04_9000003788_26209cztM0_level2.evt | modeM0/AS1C05_019T04_9000003788_26209cztM0_level2_quad_clean.evt |
| Size (bytes) | 464,083,200 | 126,676,800 |
| Size | 442.6 MB | 120.8 MB |
| Events in quadrant A | 3,860,638 | 842,913 |
| Events in quadrant B | 3,183,924 | 869,973 |
| Events in quadrant C | 3,159,234 | 839,642 |
| Events in quadrant D | 3,407,457 | 828,934 |
| Mode M9 | |||
|---|---|---|---|
| Quadrant | BADHDUFLAG | Total packets | Discarded packets |
| A | 0 | 10 | 0 |
| B | 0 | 10 | 0 |
| C | 0 | 10 | 0 |
| D | 0 | 10 | 0 |
| Mode M0 | |||
|---|---|---|---|
| Quadrant | BADHDUFLAG | Total packets | Discarded packets |
| A | 0 | 15858 | 0 |
| B | 0 | 13718 | 0 |
| C | 0 | 13629 | 0 |
| D | 0 | 14696 | 0 |
| Quadrant | Total seconds | Saturated seconds | Saturation percentage |
|---|---|---|---|
| A | 6524 | 150 | 2.299203% |
| B | 6525 | 37 | 0.567050% |
| C | 6525 | 47 | 0.720307% |
| D | 6525 | 38 | 0.582375% |
Noise dominated data is calculated using 1-second bins in cleaned event files. If a bin has >2000 counts, and if more than 50% of those come from <1% of pixels, then it is considered to be noise-dominated and hence unusable.
| Quadrant | # 1 sec bins | Bins with >0 counts | Bins with >2000 counts | High rate bins dominated by noise | Noise dominated (total time) | Noise dominated (detector-on time) | Marked lightcurve |
|---|---|---|---|---|---|---|---|
| A | 7564 | 6525 | 113 | 113 | 1.49% | 1.73% | 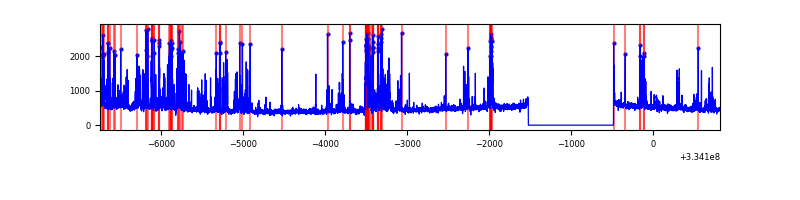 |
| B | 7565 | 6526 | 7 | 7 | 0.09% | 0.11% |  |
| C | 7565 | 6526 | 0 | 0 | 0.00% | 0.00% | 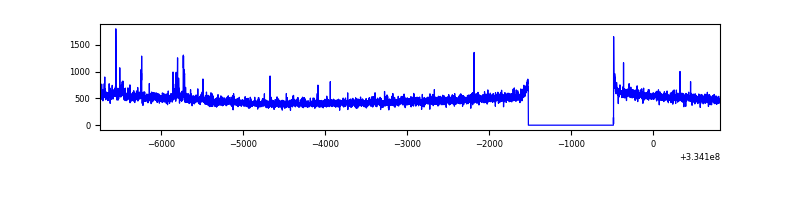 |
| D | 7565 | 6526 | 17 | 17 | 0.22% | 0.26% | 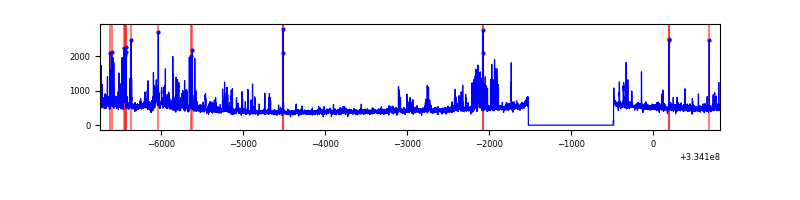 |
Top three noisy pixels from each quadrant. If the there are fewer than three noisy pixels in the level2.evt file, extra rows are filled as -1
| Pixel properties | Quadrant properties | ||||||
|---|---|---|---|---|---|---|---|
| Quadrant | DetID | PixID | Counts | Sigma | Mean | Median | Sigma |
| A | 0 | 13 | 873959 | 5613.14 | 773 | 757 | 155.6 |
| A | 13 | 254 | 11132 | 66.69 | 773 | 757 | 155.6 |
| A | 3 | 137 | 6865 | 39.26 | 773 | 757 | 155.6 |
| B | 0 | 190 | 52046 | 350.43 | 781 | 762 | 146.3 |
| B | 5 | 172 | 35712 | 238.82 | 781 | 762 | 146.3 |
| B | 12 | 111 | 17232 | 112.54 | 781 | 762 | 146.3 |
| C | 14 | 238 | 119848 | 668.93 | 760 | 766 | 178.0 |
| C | 2 | 16 | 42707 | 235.6 | 760 | 766 | 178.0 |
| C | 3 | 233 | 23882 | 129.85 | 760 | 766 | 178.0 |
| D | 1 | 52 | 294428 | 1564.26 | 762 | 743 | 187.7 |
| D | 7 | 38 | 81704 | 431.23 | 762 | 743 | 187.7 |
| D | 12 | 233 | 46815 | 245.39 | 762 | 743 | 187.7 |
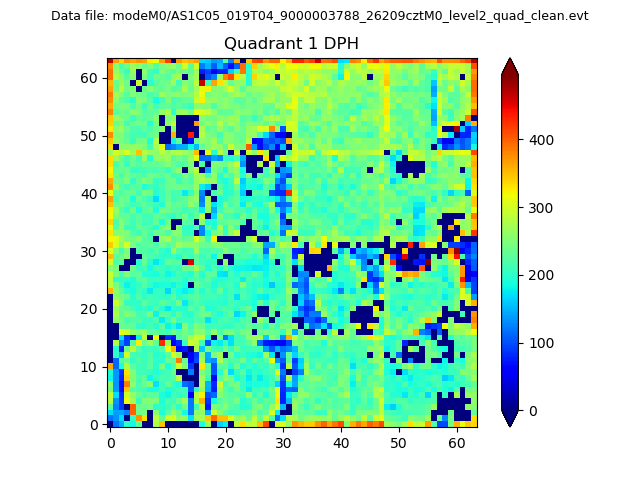
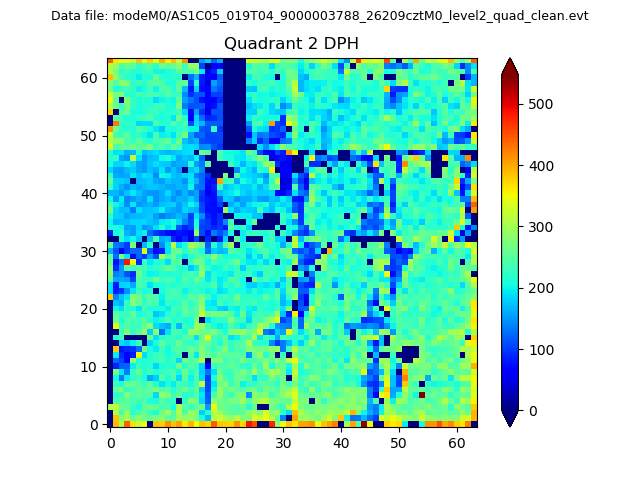
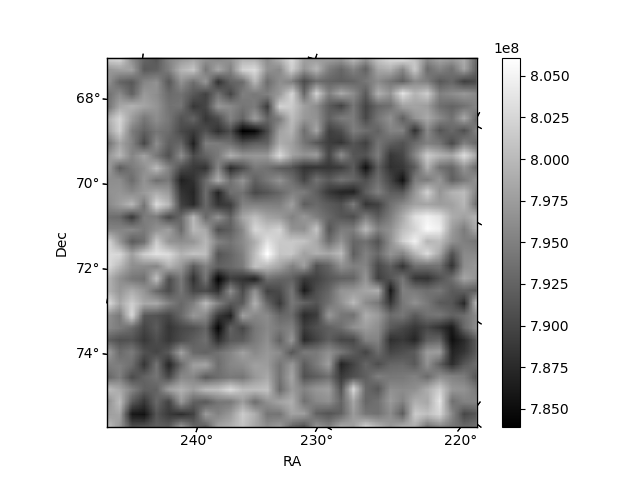
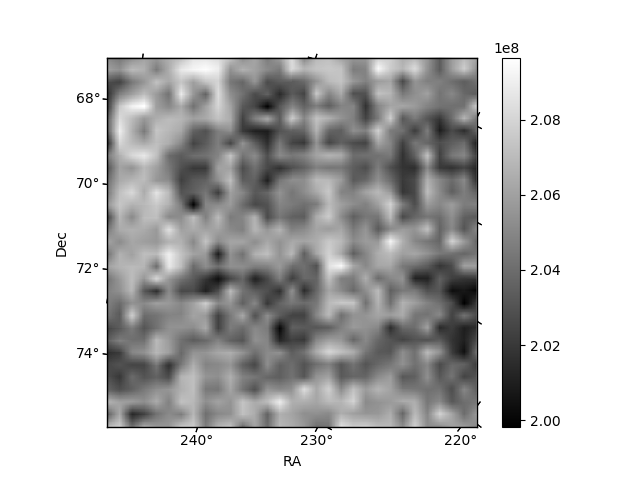
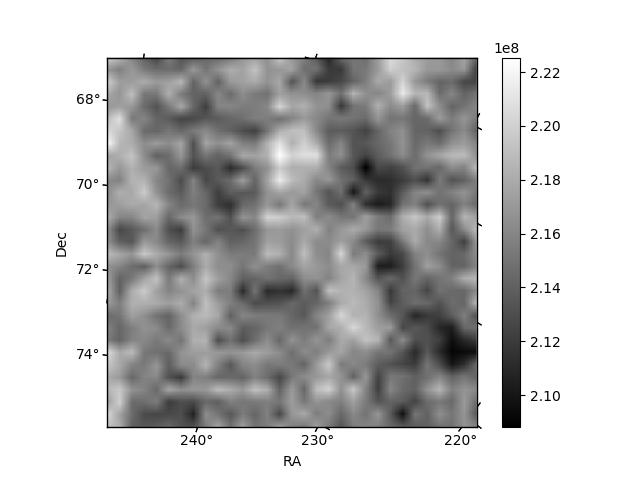
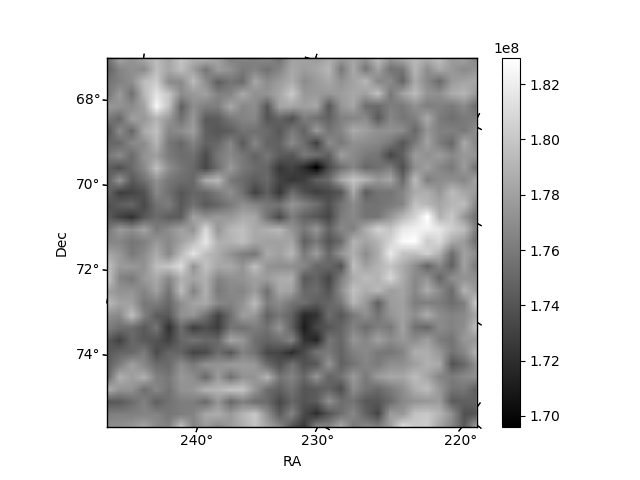
Histogram calculated using DETX and DETY for each event in the final _common_clean file
| Quadrant A | 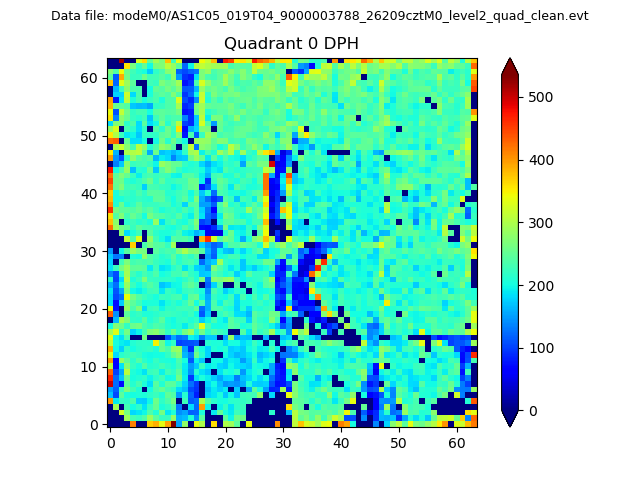 |
 |
Quadrant B |
|---|---|---|---|
| Quadrant D | 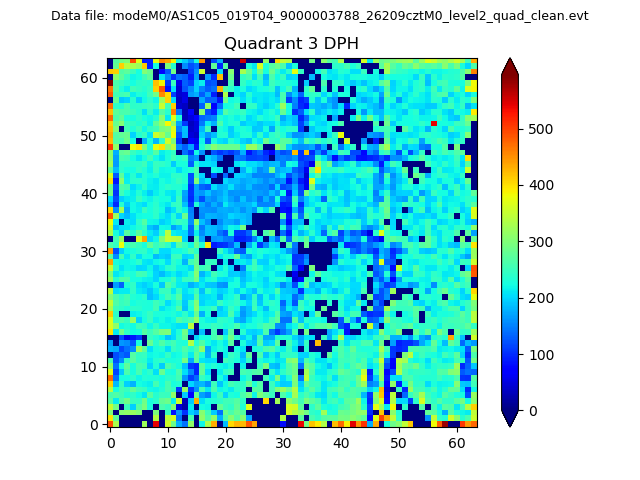 |
 |
Quadrant C |
| Plot type | Count rate plots | Images |
|---|---|---|
| Comparison with Poisson distribution Blue bars denote a histogram of data divided into 1 sec bins. Red curve is a Poisson curve with rate = median count rate of data. |
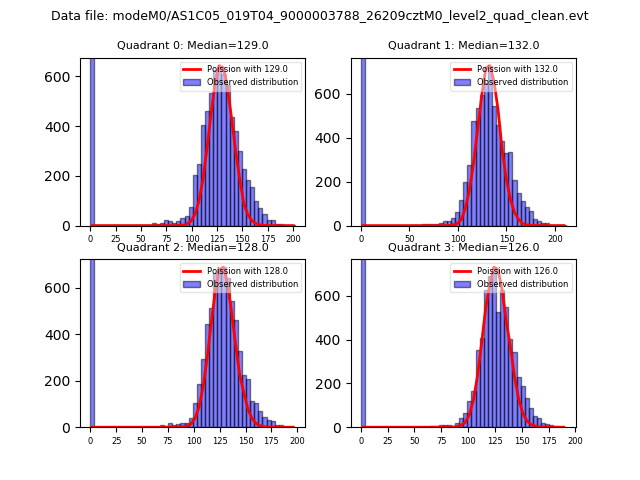 |
 |
| Quadrant-wise count rates Data is divided into 100 sec bins |
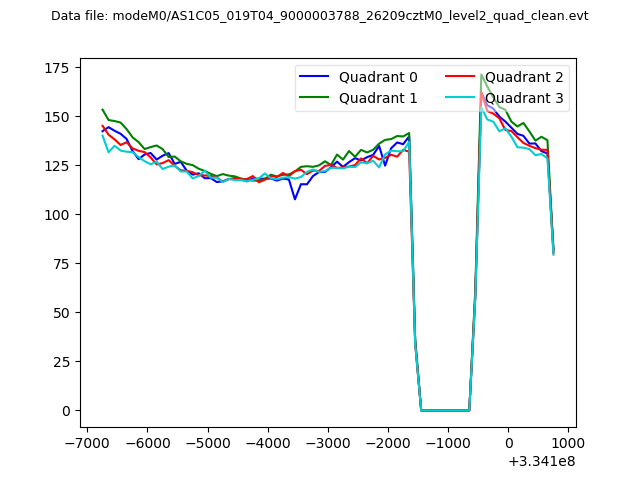 |
|
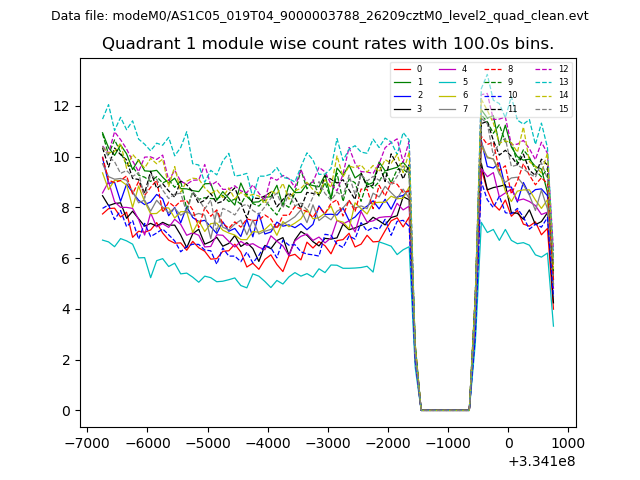
| Module-wise count rates for Quadrant A Data is divided into 100 sec bins |
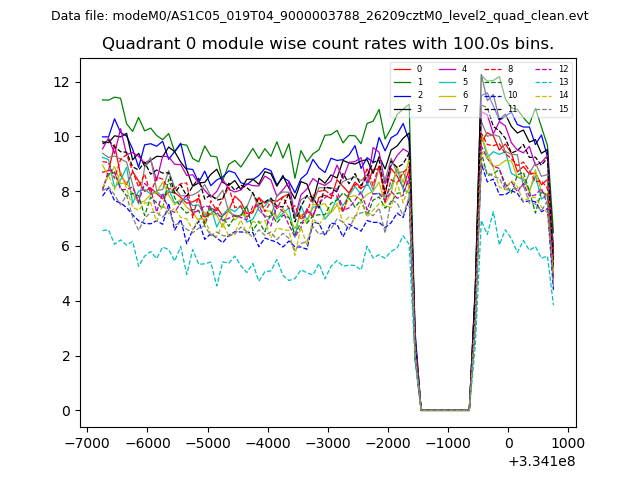 |
 |
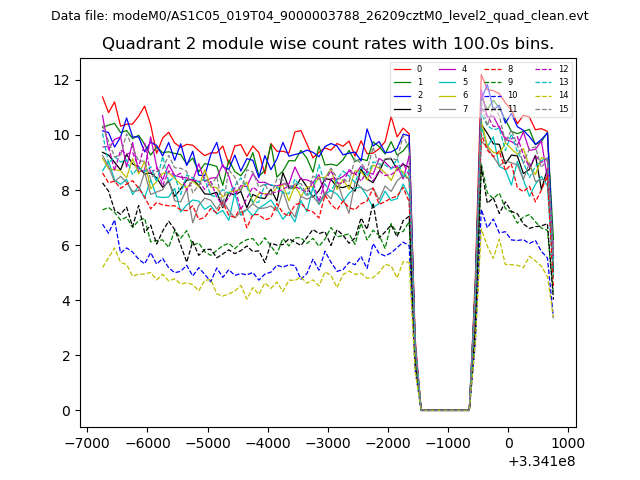
| Module-wise count rates for Quadrant B Data is divided into 100 sec bins |
 |
 |
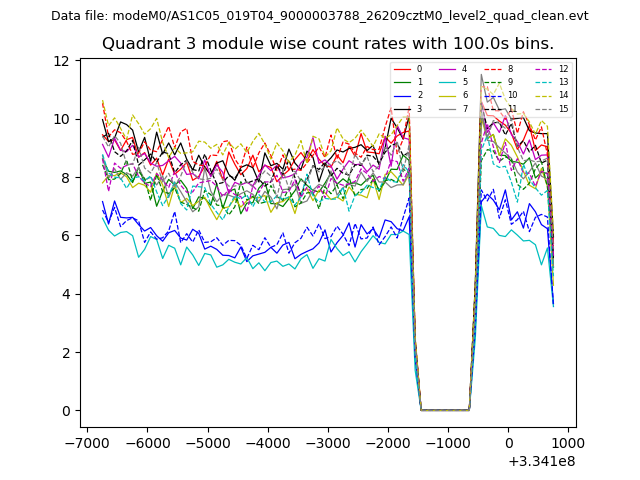
| Module-wise count rates for Quadrant C Data is divided into 100 sec bins |
 |
 |
| Module-wise count rates for Quadrant D Data is divided into 100 sec bins |
 |
 |
| Parameter | Plot |
|---|---|
| CZT HV Monitor | 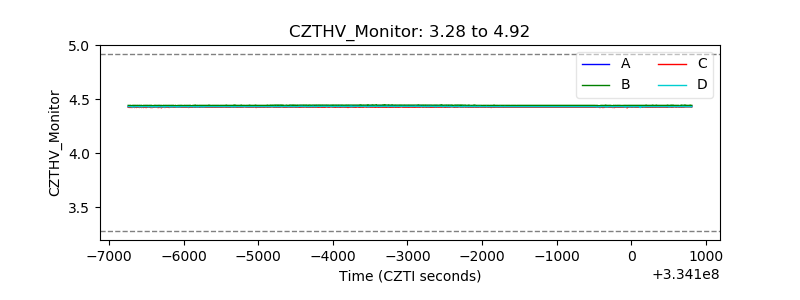 |
| D_VDD | 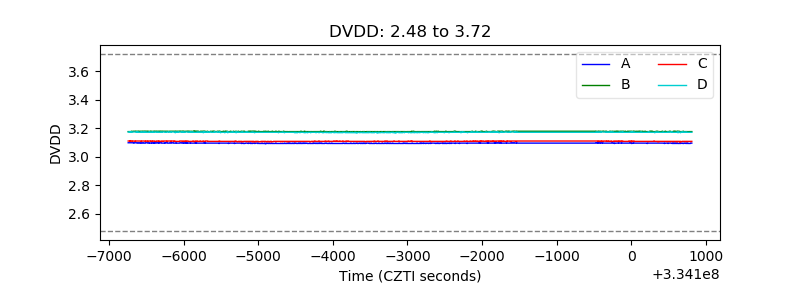 |
| Temperature 1 | 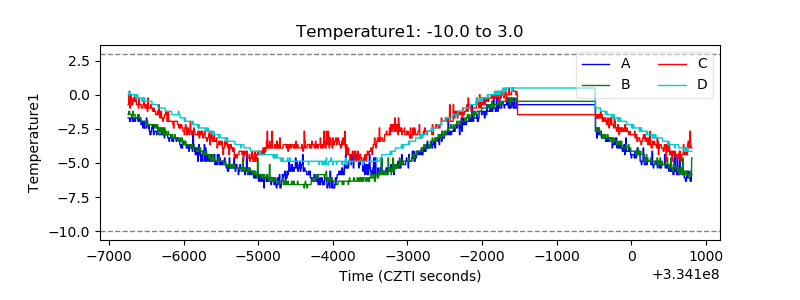 |
| Veto HV Monitor |  |
| Veto LLD | 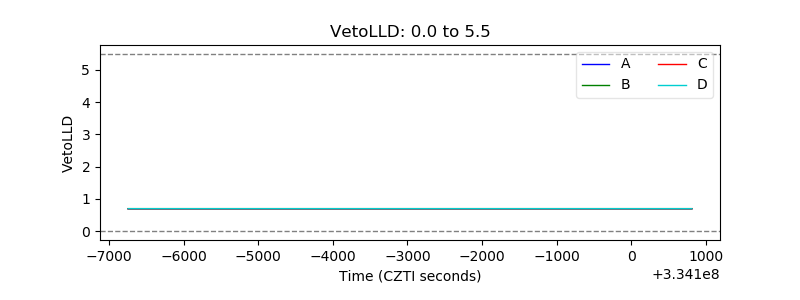 |
| Alpha Counter | 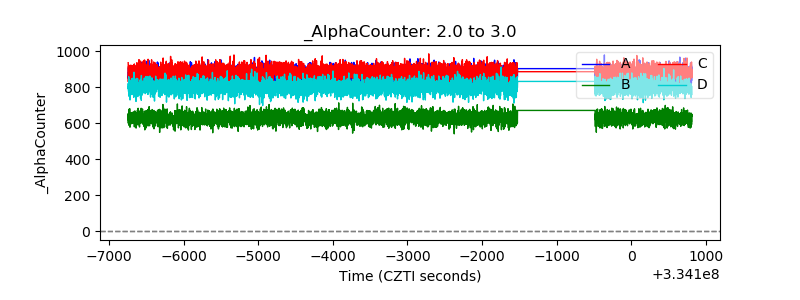 |
| _CPM_Rate |  |
| CZT Counter | 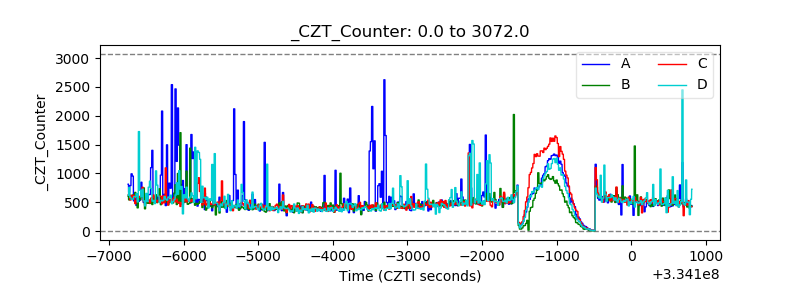 |
| +2.5 Volts monitor |  |
| +5 Volts monitor |  |
| _ROLL_ROT | 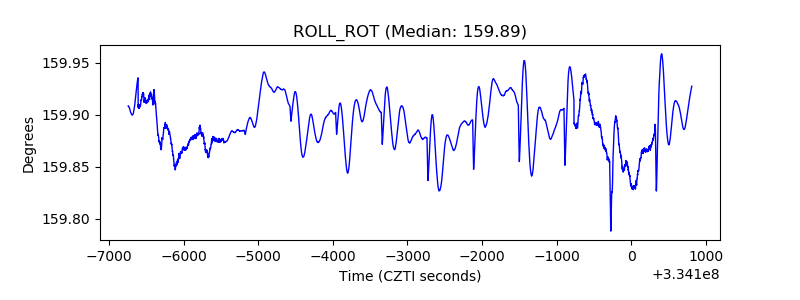 |
| _Roll_DEC | 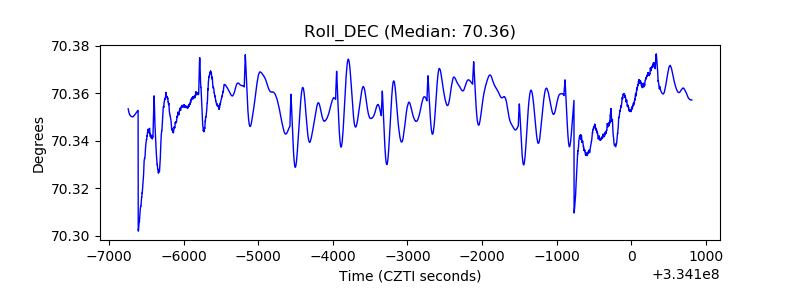 |
| _Roll_RA | 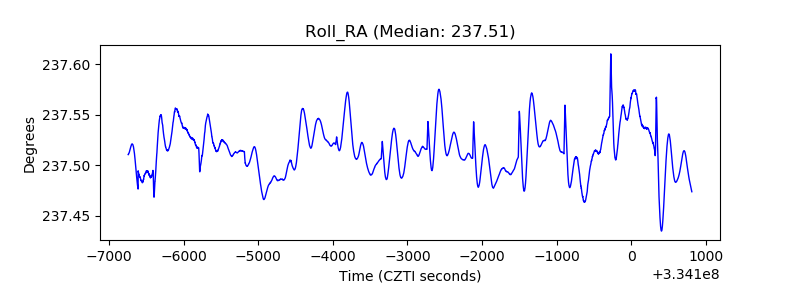 |
| Veto Counter |  |