| Param | Original file | Final file |
|---|---|---|
| Filename | modeM0/AS1C05_019T04_9000003788_26211cztM0_level2.evt | modeM0/AS1C05_019T04_9000003788_26211cztM0_level2_quad_clean.evt |
| Size (bytes) | 447,114,240 | 129,677,760 |
| Size | 426.4 MB | 123.7 MB |
| Events in quadrant A | 3,294,307 | 871,776 |
| Events in quadrant B | 3,246,394 | 897,813 |
| Events in quadrant C | 3,153,015 | 864,507 |
| Events in quadrant D | 3,410,249 | 845,321 |
| Mode M9 | |||
|---|---|---|---|
| Quadrant | BADHDUFLAG | Total packets | Discarded packets |
| A | 0 | 18 | 0 |
| B | 0 | 19 | 0 |
| C | 0 | 19 | 0 |
| D | 0 | 19 | 0 |
| Mode M0 | |||
|---|---|---|---|
| Quadrant | BADHDUFLAG | Total packets | Discarded packets |
| A | 0 | 14054 | 0 |
| B | 0 | 13838 | 0 |
| C | 0 | 13508 | 0 |
| D | 0 | 14558 | 0 |
| Quadrant | Total seconds | Saturated seconds | Saturation percentage |
|---|---|---|---|
| A | 6430 | 67 | 1.041991% |
| B | 6430 | 73 | 1.135303% |
| C | 6430 | 69 | 1.073095% |
| D | 6430 | 46 | 0.715397% |
Noise dominated data is calculated using 1-second bins in cleaned event files. If a bin has >2000 counts, and if more than 50% of those come from <1% of pixels, then it is considered to be noise-dominated and hence unusable.
| Quadrant | # 1 sec bins | Bins with >0 counts | Bins with >2000 counts | High rate bins dominated by noise | Noise dominated (total time) | Noise dominated (detector-on time) | Marked lightcurve |
|---|---|---|---|---|---|---|---|
| A | 7585 | 6431 | 26 | 26 | 0.34% | 0.40% | 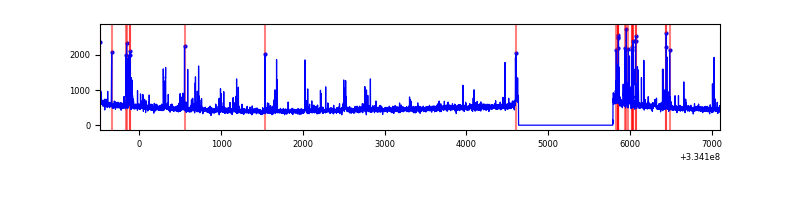 |
| B | 7585 | 6431 | 29 | 29 | 0.38% | 0.45% | 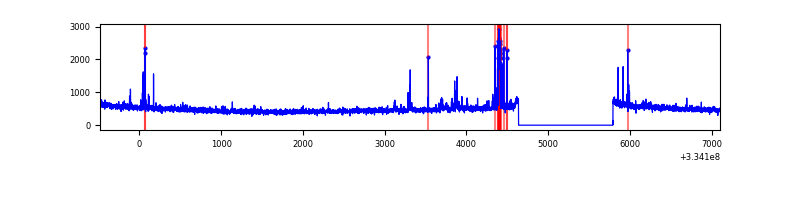 |
| C | 7585 | 6431 | 0 | 0 | 0.00% | 0.00% | 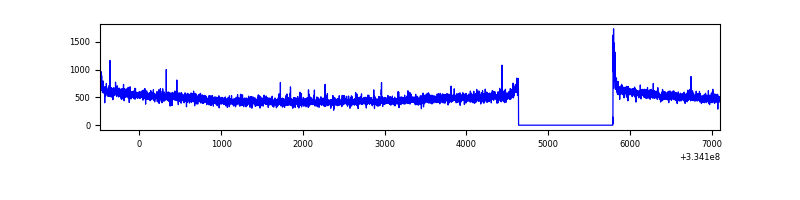 |
| D | 7585 | 6431 | 20 | 20 | 0.26% | 0.31% | 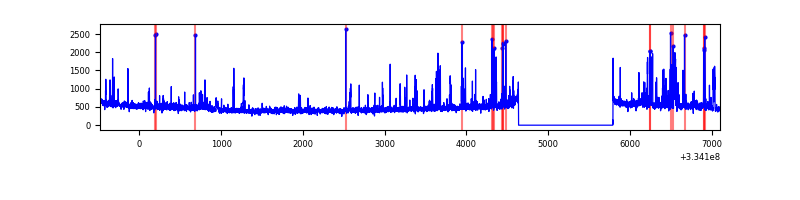 |
Top three noisy pixels from each quadrant. If the there are fewer than three noisy pixels in the level2.evt file, extra rows are filled as -1
| Pixel properties | Quadrant properties | ||||||
|---|---|---|---|---|---|---|---|
| Quadrant | DetID | PixID | Counts | Sigma | Mean | Median | Sigma |
| A | 0 | 13 | 286345 | 1835.43 | 779 | 763 | 155.6 |
| A | 13 | 254 | 10440 | 62.19 | 779 | 763 | 155.6 |
| A | 3 | 137 | 6838 | 39.04 | 779 | 763 | 155.6 |
| B | 5 | 172 | 122002 | 823.49 | 786 | 765 | 147.2 |
| B | 0 | 190 | 34586 | 229.73 | 786 | 765 | 147.2 |
| B | 12 | 111 | 17307 | 112.36 | 786 | 765 | 147.2 |
| C | 14 | 238 | 123828 | 689.33 | 764 | 768 | 178.5 |
| C | 0 | 10 | 17472 | 93.57 | 764 | 768 | 178.5 |
| C | 3 | 233 | 15977 | 85.19 | 764 | 768 | 178.5 |
| D | 1 | 52 | 377976 | 2048.75 | 762 | 742 | 184.1 |
| D | 12 | 1 | 30589 | 162.1 | 762 | 742 | 184.1 |
| D | 12 | 233 | 28625 | 151.43 | 762 | 742 | 184.1 |
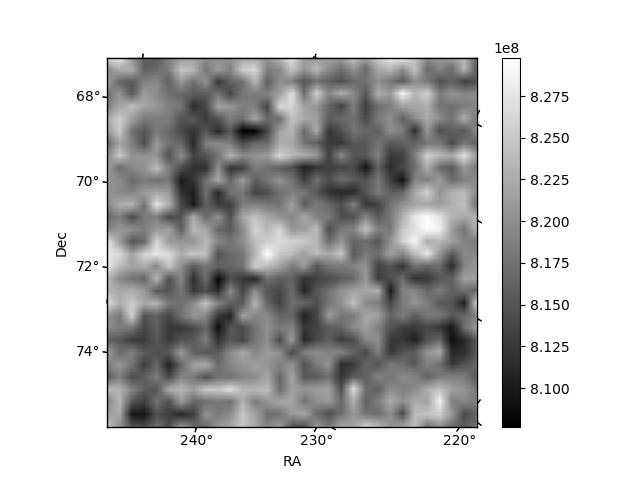
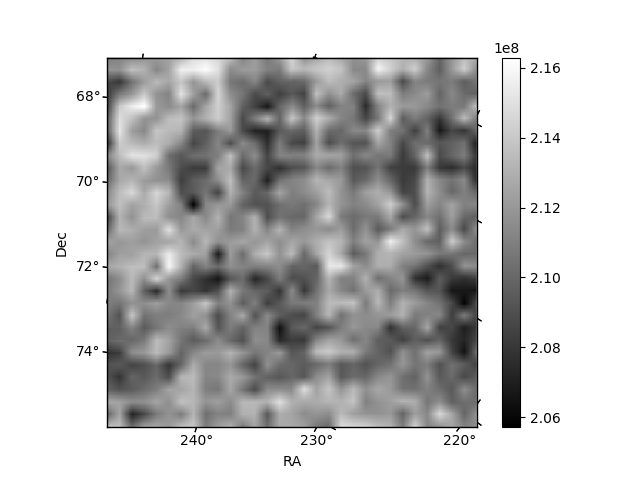
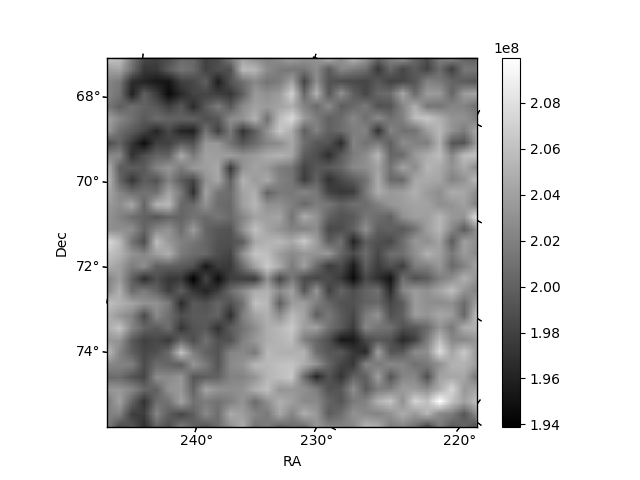
Histogram calculated using DETX and DETY for each event in the final _common_clean file
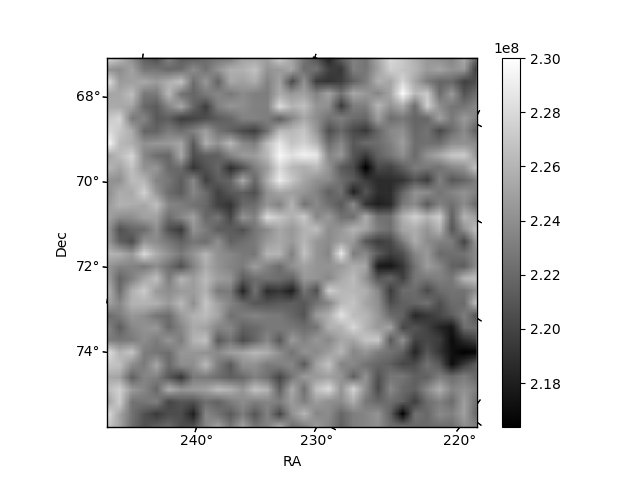
| Quadrant A | 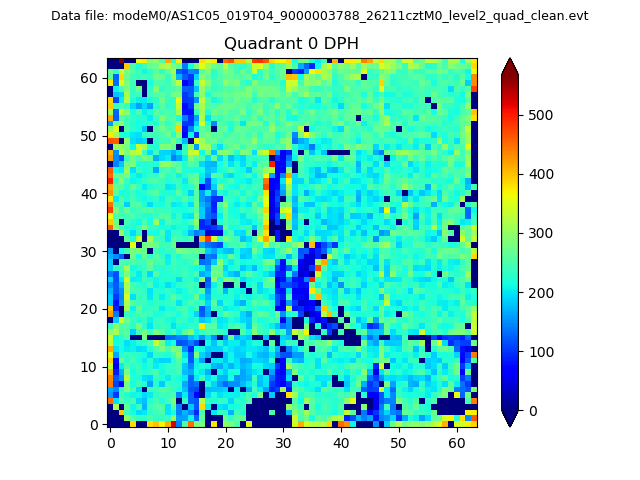 |
 |
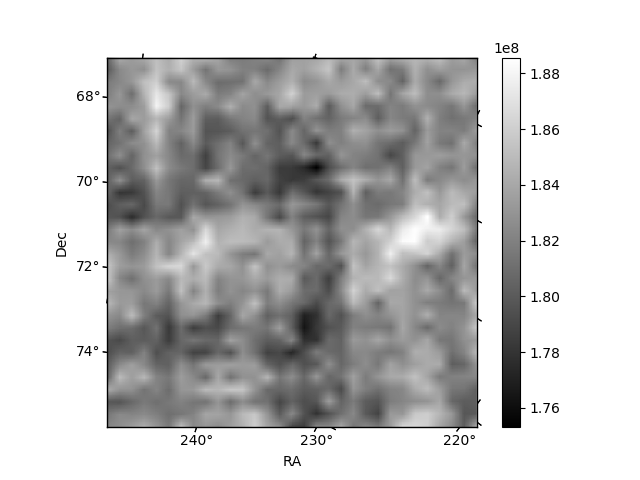
Quadrant B |
|---|---|---|---|
| Quadrant D | 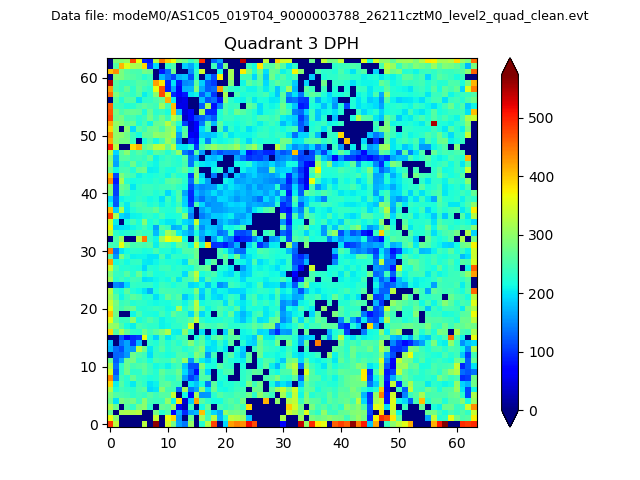 |
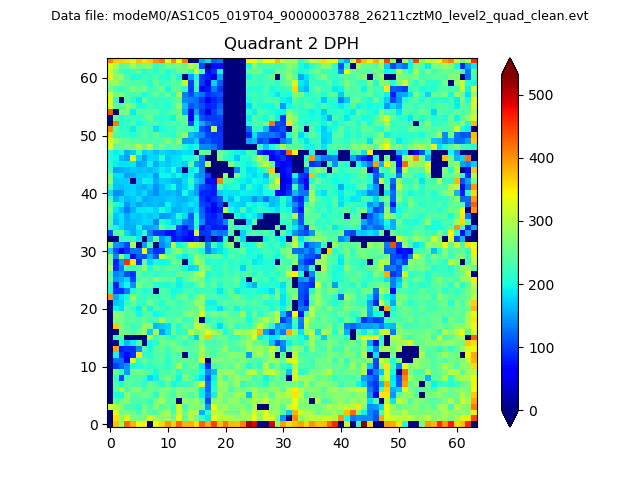 |
Quadrant C |
| Plot type | Count rate plots | Images |
|---|---|---|
| Comparison with Poisson distribution Blue bars denote a histogram of data divided into 1 sec bins. Red curve is a Poisson curve with rate = median count rate of data. |
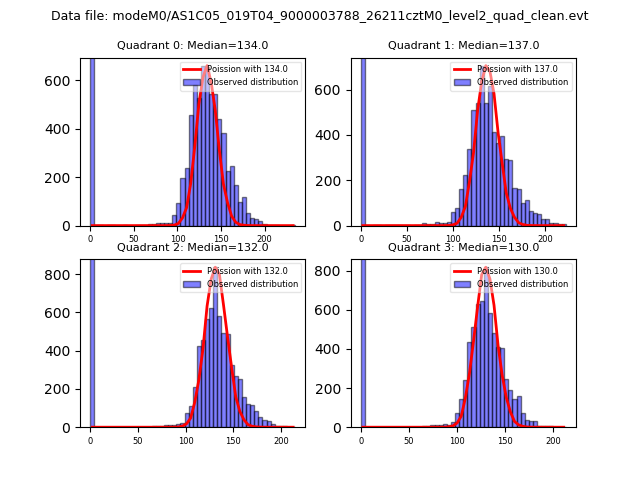 |
 |
| Quadrant-wise count rates Data is divided into 100 sec bins |
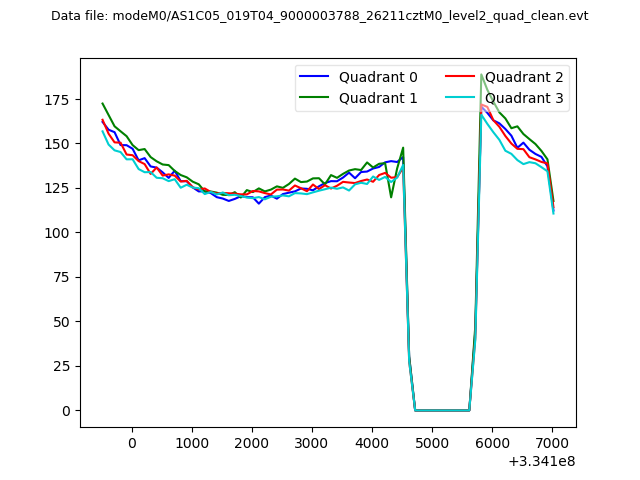 |
|
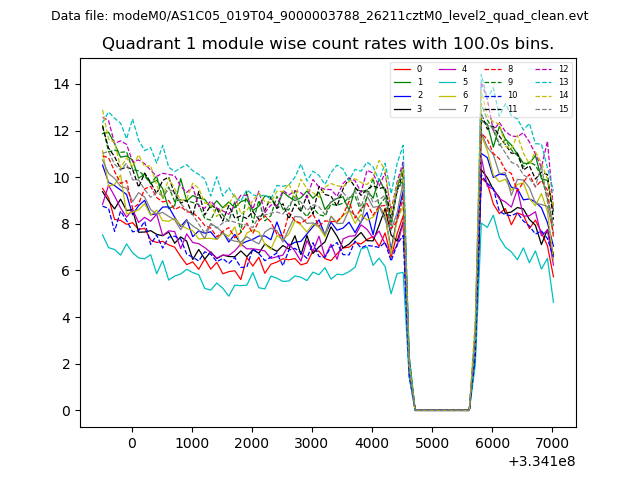
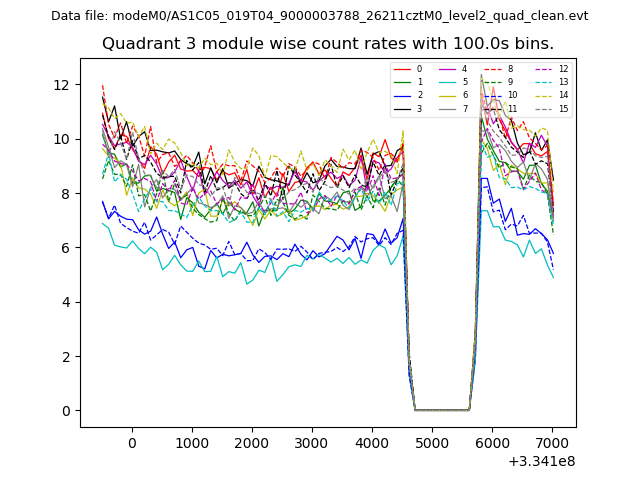
| Module-wise count rates for Quadrant A Data is divided into 100 sec bins |
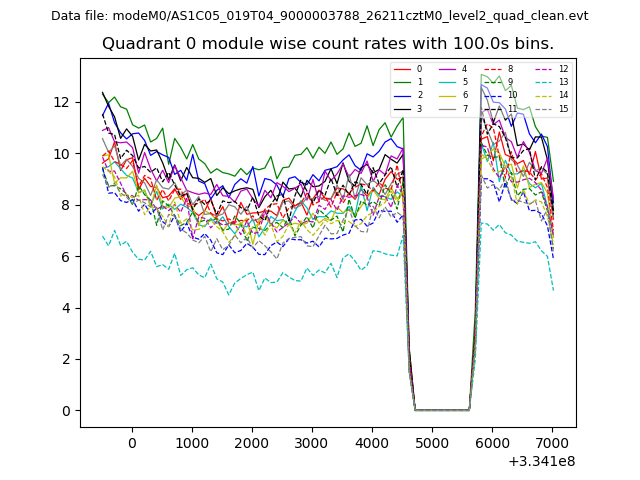 |
 |
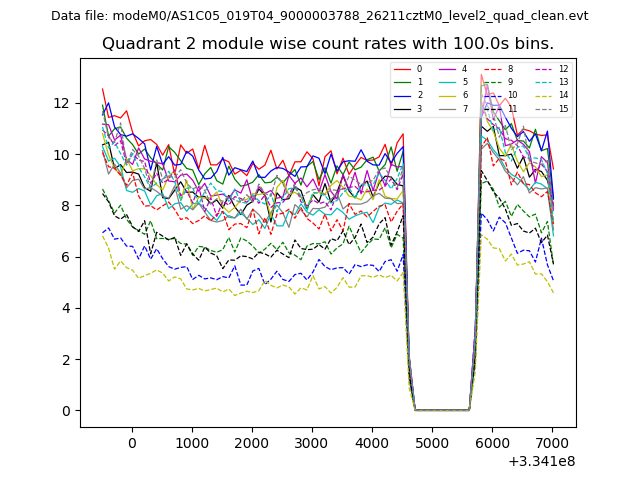
| Module-wise count rates for Quadrant B Data is divided into 100 sec bins |
 |
 |
| Module-wise count rates for Quadrant C Data is divided into 100 sec bins |
 |
 |
| Module-wise count rates for Quadrant D Data is divided into 100 sec bins |
 |
 |
| Parameter | Plot |
|---|---|
| CZT HV Monitor | 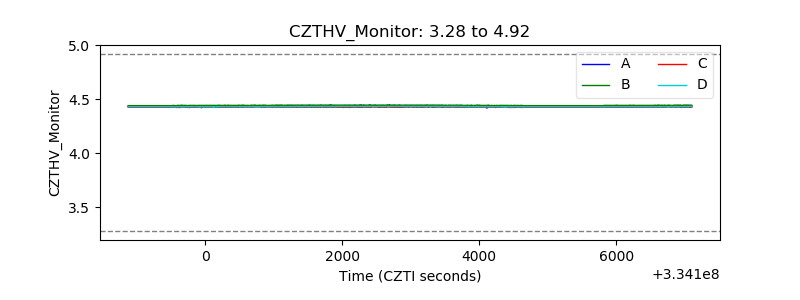 |
| D_VDD | 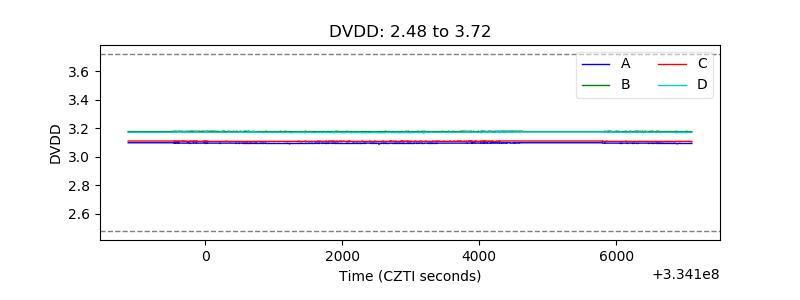 |
| Temperature 1 | 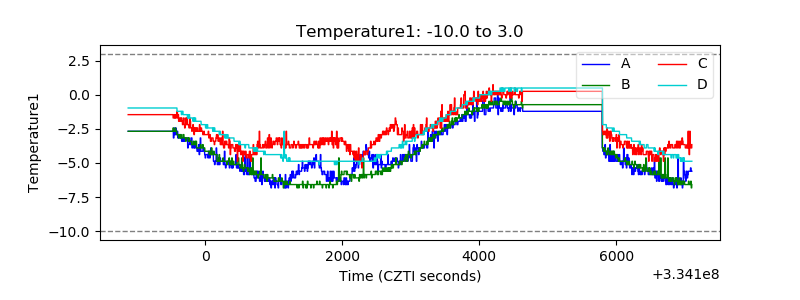 |
| Veto HV Monitor | 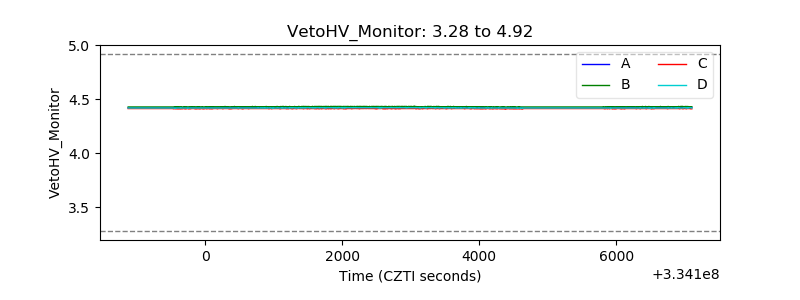 |
| Veto LLD |  |
| Alpha Counter | 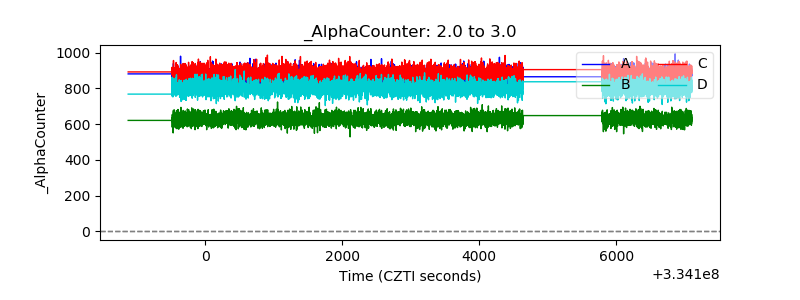 |
| _CPM_Rate | 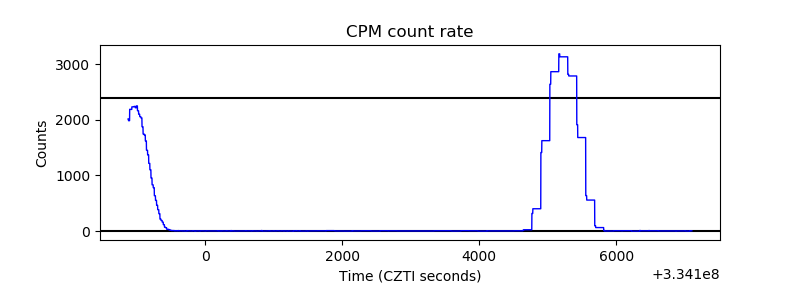 |
| CZT Counter | 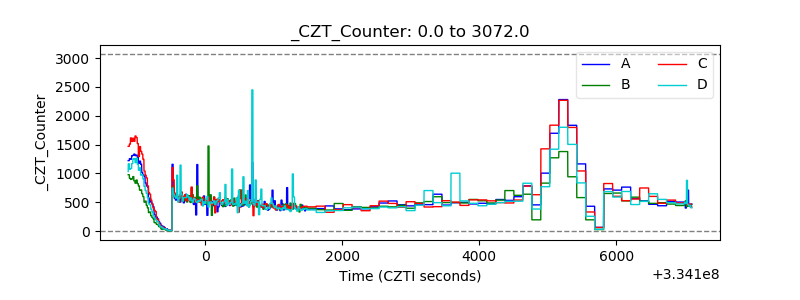 |
| +2.5 Volts monitor |  |
| +5 Volts monitor |  |
| _ROLL_ROT | 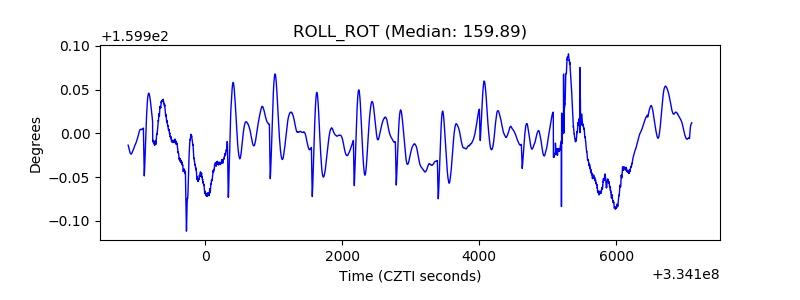 |
| _Roll_DEC | 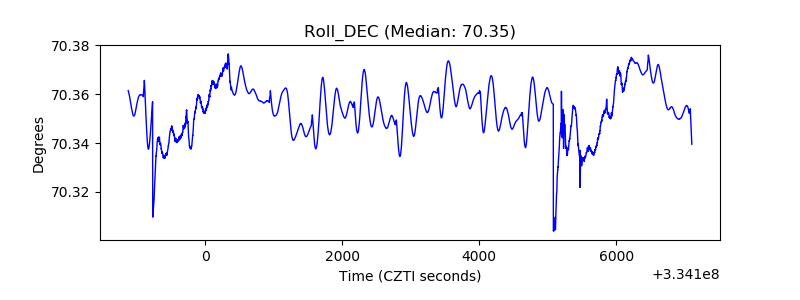 |
| _Roll_RA | 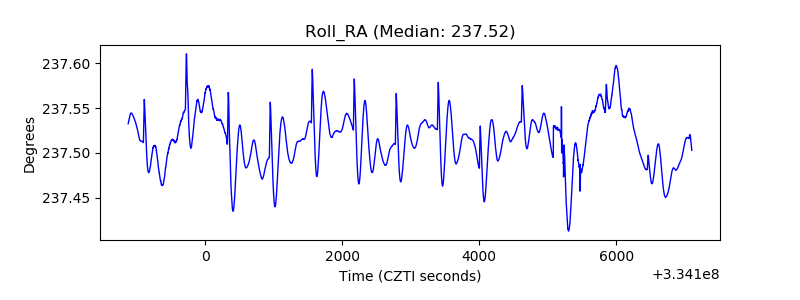 |
| Veto Counter | 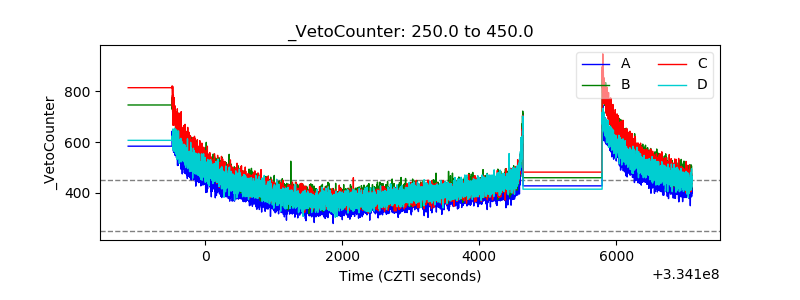 |