| Param | Original file | Final file |
|---|---|---|
| Filename | modeM0/AS1C05_019T04_9000003788_26212cztM0_level2.evt | modeM0/AS1C05_019T04_9000003788_26212cztM0_level2_quad_clean.evt |
| Size (bytes) | 463,700,160 | 138,597,120 |
| Size | 442.2 MB | 132.2 MB |
| Events in quadrant A | 3,410,121 | 938,960 |
| Events in quadrant B | 3,368,740 | 971,348 |
| Events in quadrant C | 3,287,224 | 925,634 |
| Events in quadrant D | 3,529,502 | 902,753 |
| Mode M9 | |||
|---|---|---|---|
| Quadrant | BADHDUFLAG | Total packets | Discarded packets |
| A | 0 | 14 | 0 |
| B | 0 | 15 | 0 |
| C | 0 | 15 | 0 |
| D | 0 | 15 | 0 |
| Mode M0 | |||
|---|---|---|---|
| Quadrant | BADHDUFLAG | Total packets | Discarded packets |
| A | 0 | 14394 | 0 |
| B | 0 | 14216 | 0 |
| C | 0 | 13944 | 0 |
| D | 0 | 14914 | 0 |
| Quadrant | Total seconds | Saturated seconds | Saturation percentage |
|---|---|---|---|
| A | 6587 | 88 | 1.335965% |
| B | 6586 | 74 | 1.123596% |
| C | 6586 | 82 | 1.245065% |
| D | 6586 | 52 | 0.789554% |
Noise dominated data is calculated using 1-second bins in cleaned event files. If a bin has >2000 counts, and if more than 50% of those come from <1% of pixels, then it is considered to be noise-dominated and hence unusable.
| Quadrant | # 1 sec bins | Bins with >0 counts | Bins with >2000 counts | High rate bins dominated by noise | Noise dominated (total time) | Noise dominated (detector-on time) | Marked lightcurve |
|---|---|---|---|---|---|---|---|
| A | 7832 | 6588 | 42 | 42 | 0.54% | 0.64% | 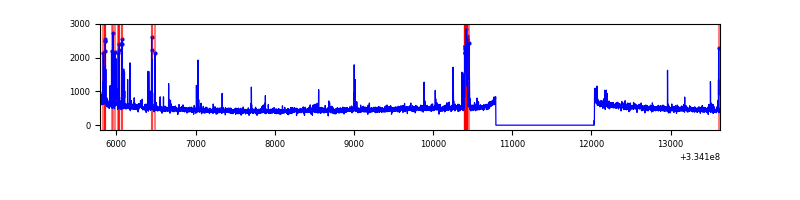 |
| B | 7831 | 6587 | 15 | 15 | 0.19% | 0.23% | 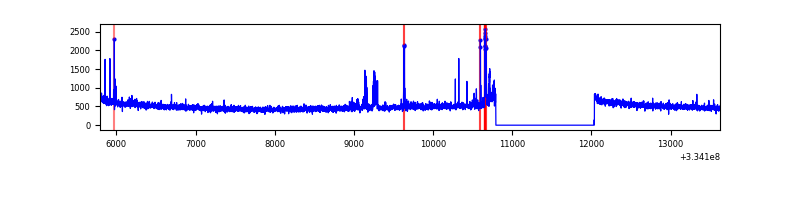 |
| C | 7831 | 6587 | 0 | 0 | 0.00% | 0.00% | 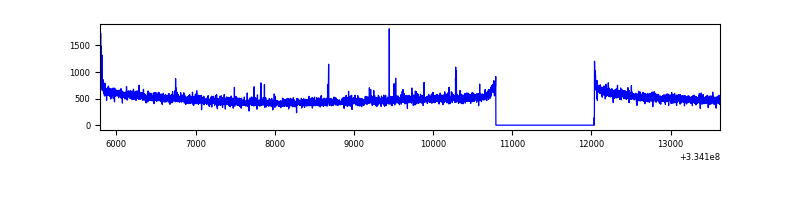 |
| D | 7831 | 6587 | 26 | 26 | 0.33% | 0.39% | 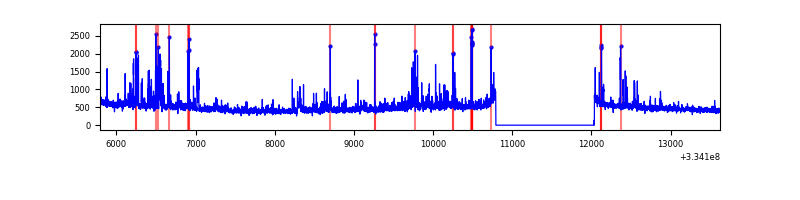 |
Top three noisy pixels from each quadrant. If the there are fewer than three noisy pixels in the level2.evt file, extra rows are filled as -1
| Pixel properties | Quadrant properties | ||||||
|---|---|---|---|---|---|---|---|
| Quadrant | DetID | PixID | Counts | Sigma | Mean | Median | Sigma |
| A | 0 | 13 | 242707 | 1495.2 | 818 | 802 | 161.8 |
| A | 13 | 254 | 11649 | 67.04 | 818 | 802 | 161.8 |
| A | 3 | 137 | 7004 | 38.33 | 818 | 802 | 161.8 |
| B | 5 | 172 | 73557 | 472.87 | 825 | 804 | 153.9 |
| B | 0 | 230 | 47025 | 300.42 | 825 | 804 | 153.9 |
| B | 0 | 190 | 25757 | 162.19 | 825 | 804 | 153.9 |
| C | 14 | 238 | 130183 | 701.58 | 795 | 802 | 184.4 |
| C | 3 | 233 | 35255 | 186.83 | 795 | 802 | 184.4 |
| C | 0 | 10 | 15464 | 79.51 | 795 | 802 | 184.4 |
| D | 1 | 52 | 493998 | 2606.39 | 792 | 776 | 189.2 |
| D | 2 | 234 | 29324 | 150.86 | 792 | 776 | 189.2 |
| D | 10 | 103 | 11997 | 59.3 | 792 | 776 | 189.2 |
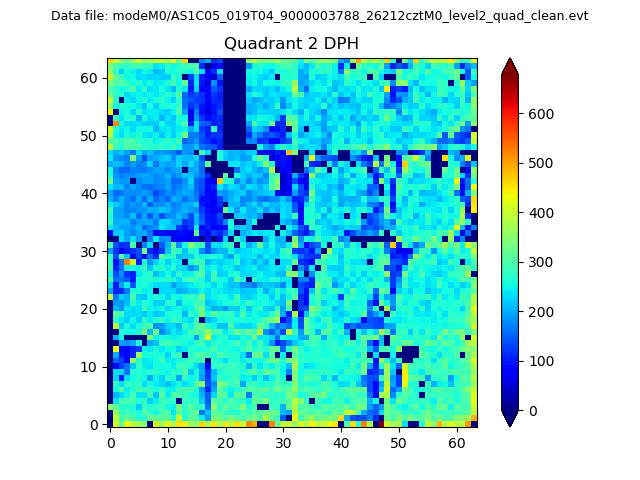
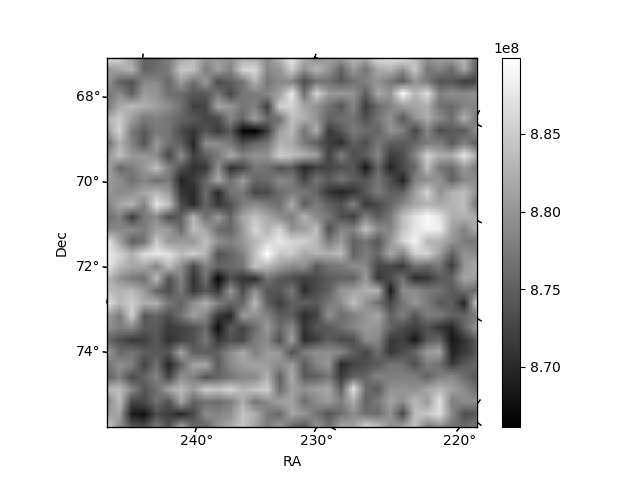
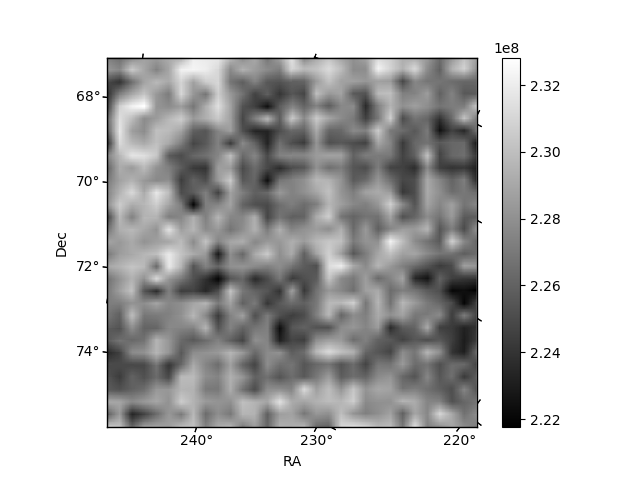
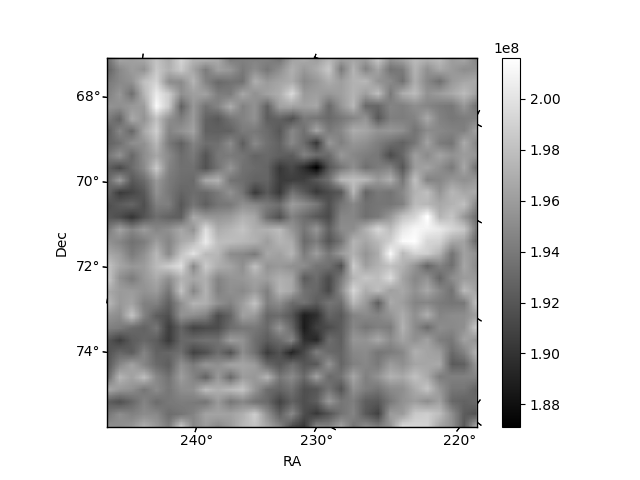
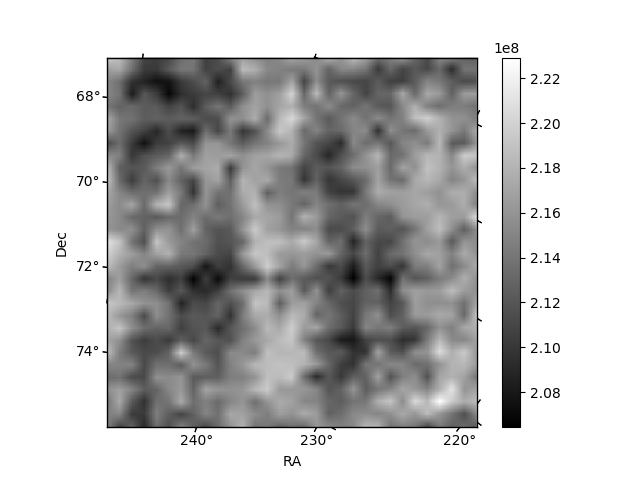
Histogram calculated using DETX and DETY for each event in the final _common_clean file
| Quadrant A | 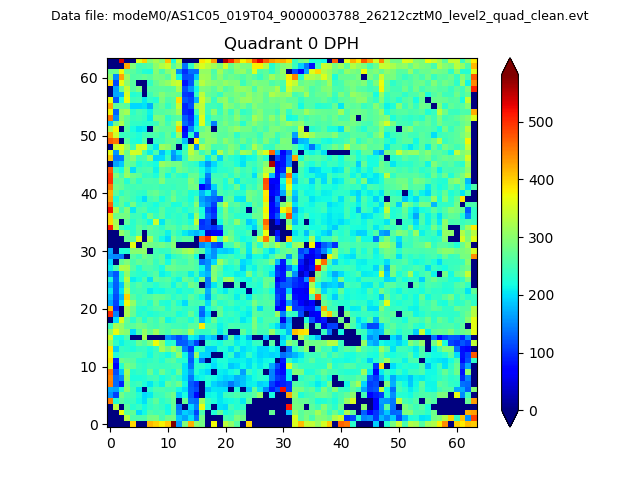 |
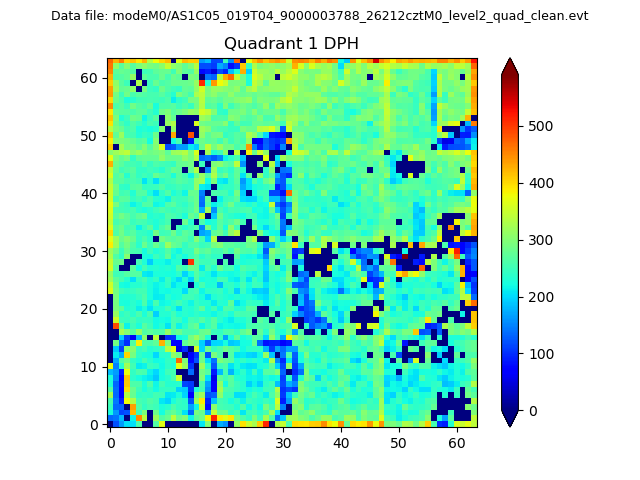 |
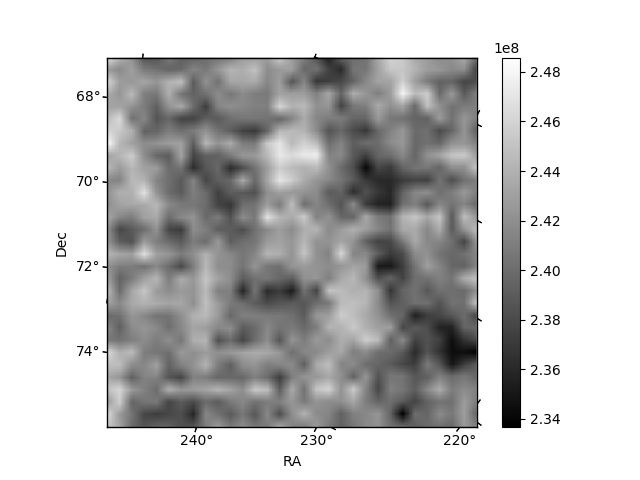
Quadrant B |
|---|---|---|---|
| Quadrant D | 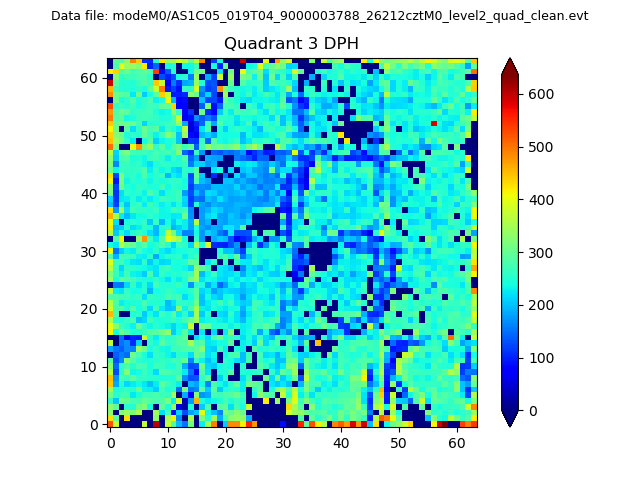 |
 |
Quadrant C |
| Plot type | Count rate plots | Images |
|---|---|---|
| Comparison with Poisson distribution Blue bars denote a histogram of data divided into 1 sec bins. Red curve is a Poisson curve with rate = median count rate of data. |
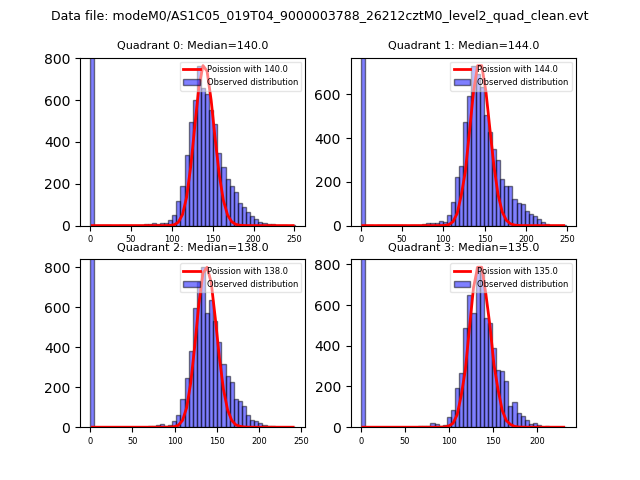 |
 |
| Quadrant-wise count rates Data is divided into 100 sec bins |
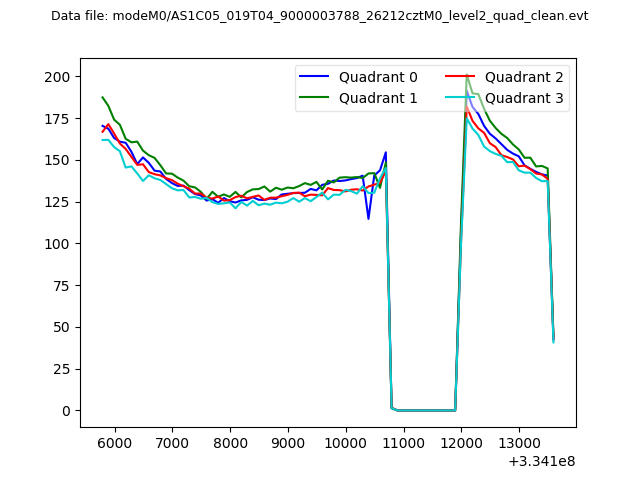 |
|
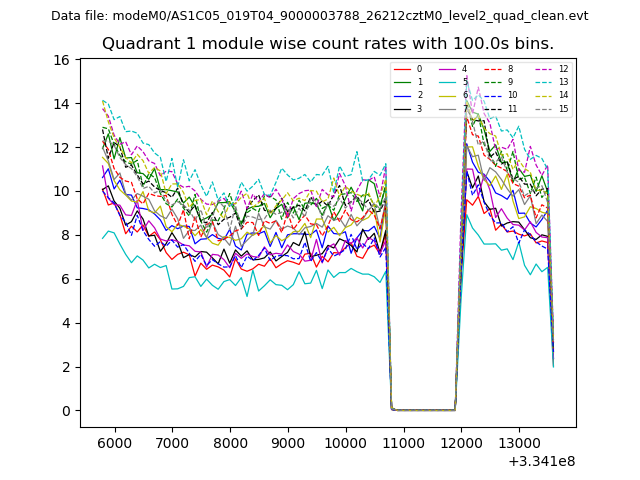
| Module-wise count rates for Quadrant A Data is divided into 100 sec bins |
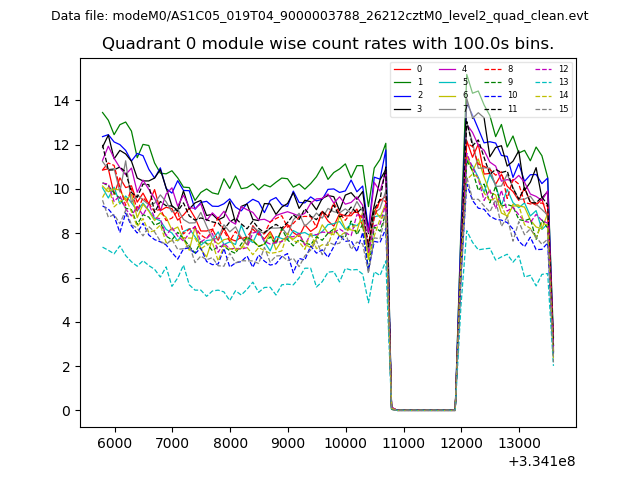 |
 |
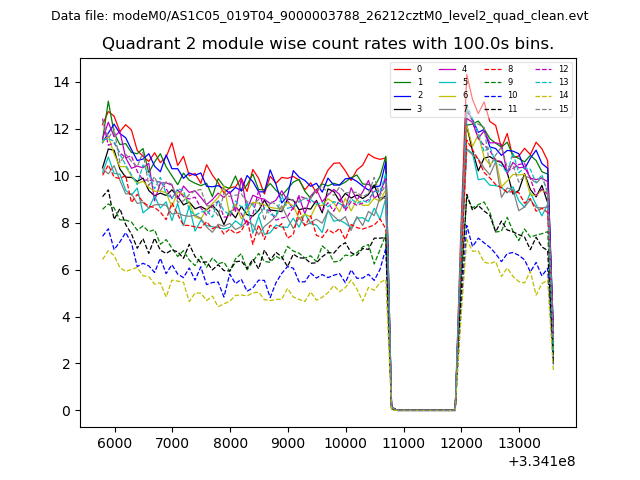
| Module-wise count rates for Quadrant B Data is divided into 100 sec bins |
 |
 |
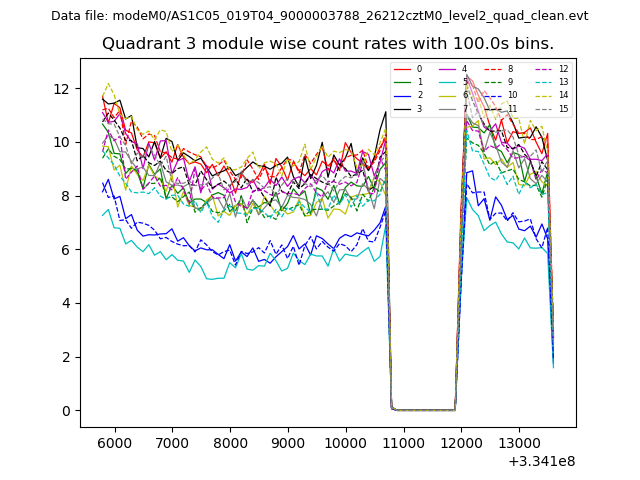
| Module-wise count rates for Quadrant C Data is divided into 100 sec bins |
 |
 |
| Module-wise count rates for Quadrant D Data is divided into 100 sec bins |
 |
 |
| Parameter | Plot |
|---|---|
| CZT HV Monitor | 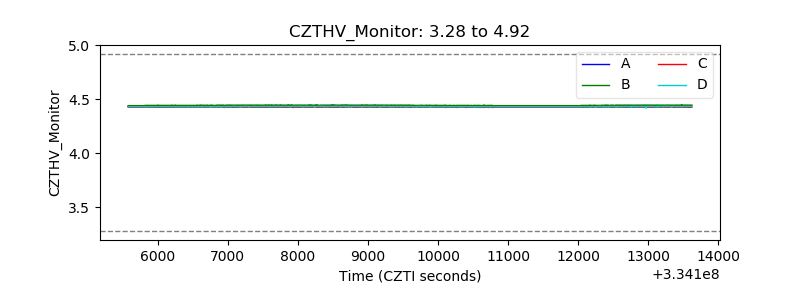 |
| D_VDD | 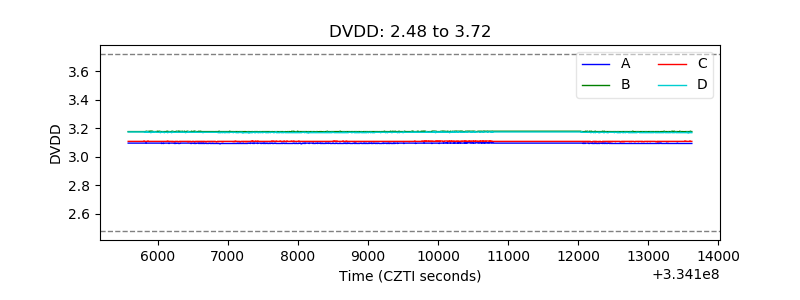 |
| Temperature 1 | 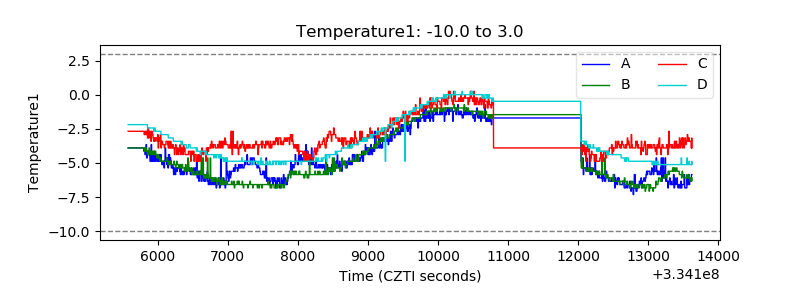 |
| Veto HV Monitor |  |
| Veto LLD | 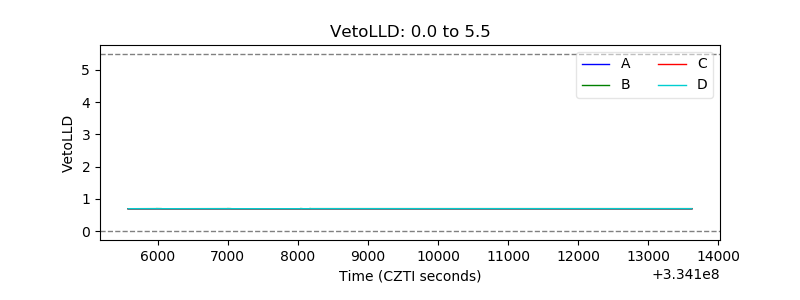 |
| Alpha Counter | 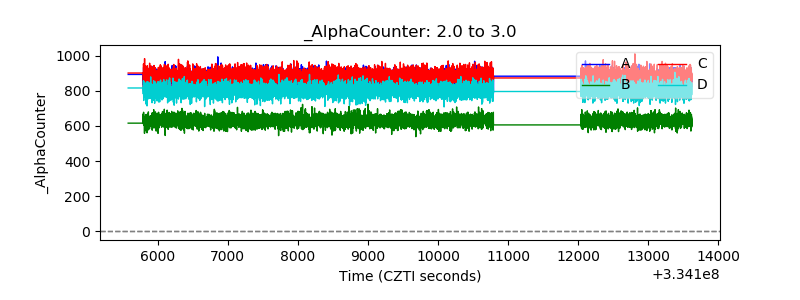 |
| _CPM_Rate | 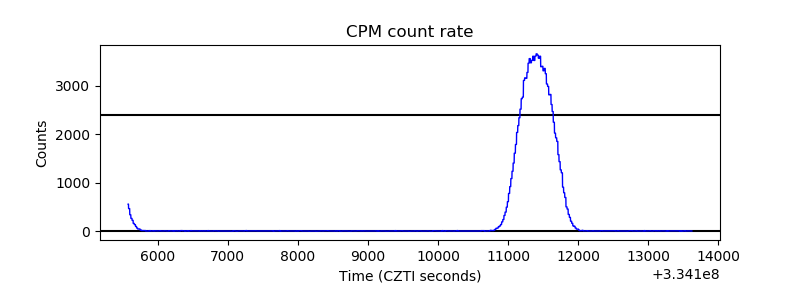 |
| CZT Counter | 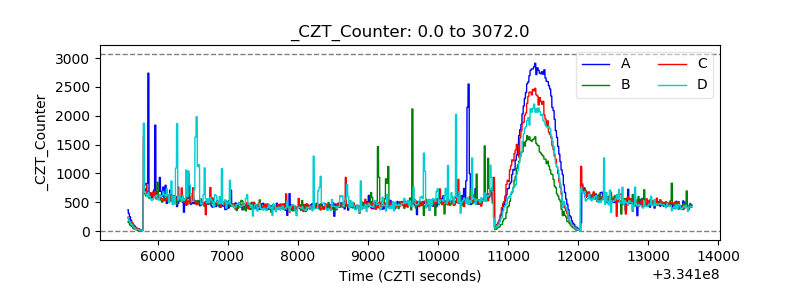 |
| +2.5 Volts monitor | 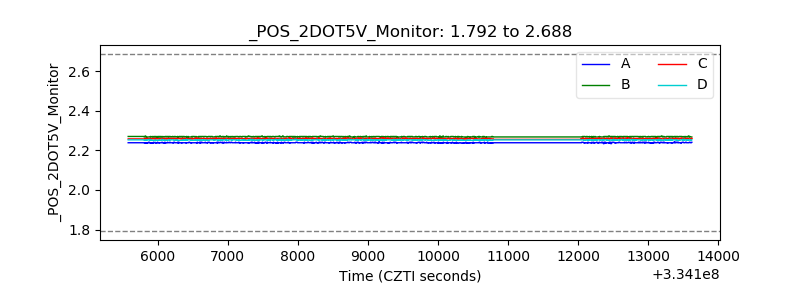 |
| +5 Volts monitor |  |
| _ROLL_ROT | 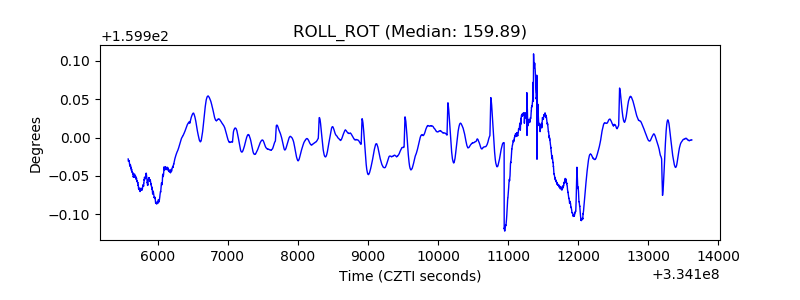 |
| _Roll_DEC |  |
| _Roll_RA | 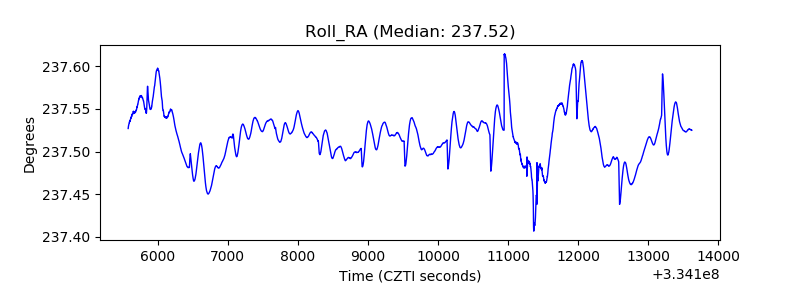 |
| Veto Counter | 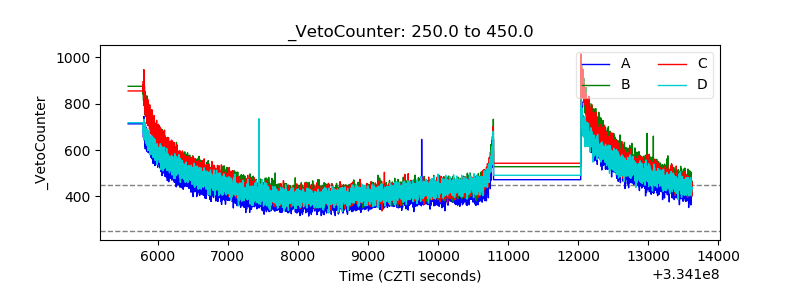 |