| Param | Original file | Final file |
|---|---|---|
| Filename | modeM0/AS1C05_019T04_9000003788_26213cztM0_level2.evt | modeM0/AS1C05_019T04_9000003788_26213cztM0_level2_quad_clean.evt |
| Size (bytes) | 440,182,080 | 137,753,280 |
| Size | 419.8 MB | 131.4 MB |
| Events in quadrant A | 3,297,060 | 940,990 |
| Events in quadrant B | 3,220,053 | 972,527 |
| Events in quadrant C | 3,165,850 | 915,287 |
| Events in quadrant D | 3,217,387 | 901,611 |
| Mode M9 | |||
|---|---|---|---|
| Quadrant | BADHDUFLAG | Total packets | Discarded packets |
| A | 0 | 13 | 0 |
| B | 0 | 13 | 0 |
| C | 0 | 13 | 0 |
| D | 0 | 13 | 0 |
| Mode M0 | |||
|---|---|---|---|
| Quadrant | BADHDUFLAG | Total packets | Discarded packets |
| A | 0 | 13717 | 0 |
| B | 0 | 13459 | 0 |
| C | 0 | 13292 | 0 |
| D | 0 | 13534 | 0 |
| Quadrant | Total seconds | Saturated seconds | Saturation percentage |
|---|---|---|---|
| A | 6332 | 48 | 0.758054% |
| B | 6333 | 34 | 0.536870% |
| C | 6333 | 51 | 0.805306% |
| D | 6333 | 27 | 0.426338% |
Noise dominated data is calculated using 1-second bins in cleaned event files. If a bin has >2000 counts, and if more than 50% of those come from <1% of pixels, then it is considered to be noise-dominated and hence unusable.
| Quadrant | # 1 sec bins | Bins with >0 counts | Bins with >2000 counts | High rate bins dominated by noise | Noise dominated (total time) | Noise dominated (detector-on time) | Marked lightcurve |
|---|---|---|---|---|---|---|---|
| A | 7687 | 6333 | 19 | 19 | 0.25% | 0.30% | 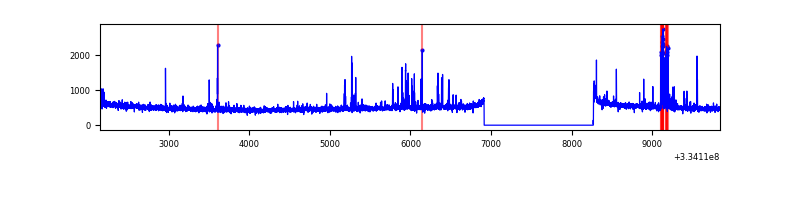 |
| B | 7688 | 6334 | 0 | 0 | 0.00% | 0.00% | 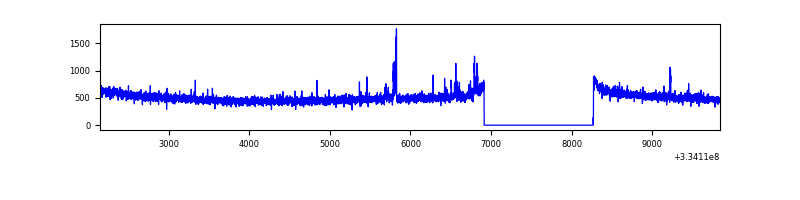 |
| C | 7688 | 6334 | 0 | 0 | 0.00% | 0.00% | 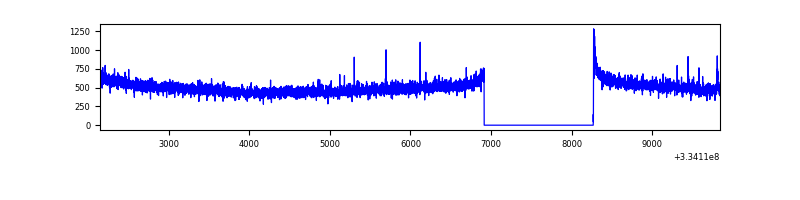 |
| D | 7688 | 6334 | 11 | 11 | 0.14% | 0.17% | 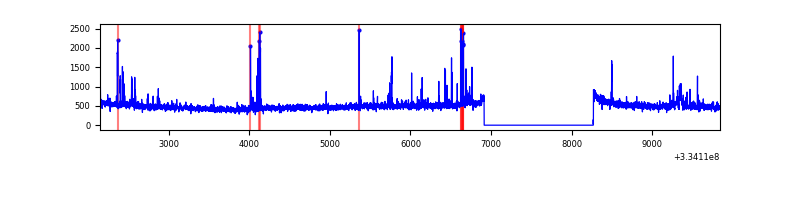 |
Top three noisy pixels from each quadrant. If the there are fewer than three noisy pixels in the level2.evt file, extra rows are filled as -1
| Pixel properties | Quadrant properties | ||||||
|---|---|---|---|---|---|---|---|
| Quadrant | DetID | PixID | Counts | Sigma | Mean | Median | Sigma |
| A | 0 | 13 | 178646 | 1119.27 | 807 | 793 | 158.9 |
| A | 13 | 254 | 10726 | 62.51 | 807 | 793 | 158.9 |
| A | 0 | 226 | 6987 | 38.98 | 807 | 793 | 158.9 |
| B | 5 | 172 | 30379 | 197.55 | 809 | 787 | 149.8 |
| B | 0 | 190 | 29596 | 192.32 | 809 | 787 | 149.8 |
| B | 12 | 111 | 17484 | 111.47 | 809 | 787 | 149.8 |
| C | 14 | 238 | 126571 | 703.18 | 773 | 777 | 178.9 |
| C | 3 | 233 | 15243 | 80.86 | 773 | 777 | 178.9 |
| C | 0 | 10 | 6511 | 32.05 | 773 | 777 | 178.9 |
| D | 1 | 52 | 262952 | 1421.39 | 775 | 757 | 184.5 |
| D | 2 | 234 | 27713 | 146.13 | 775 | 757 | 184.5 |
| D | 2 | 153 | 9921 | 49.68 | 775 | 757 | 184.5 |
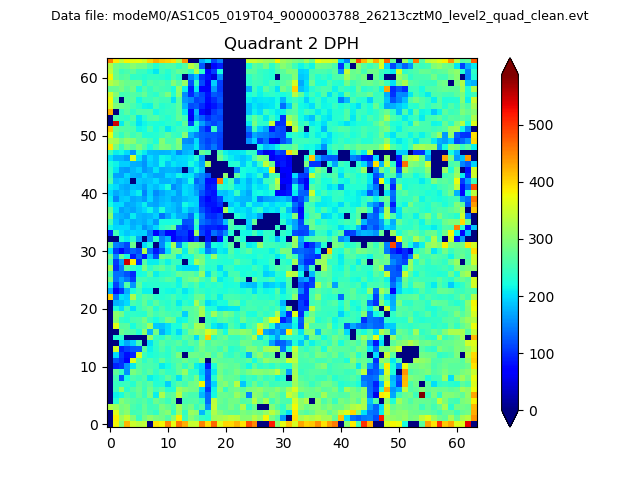
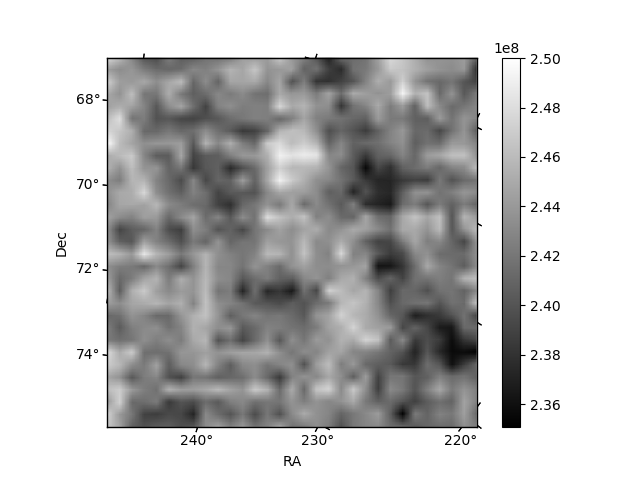
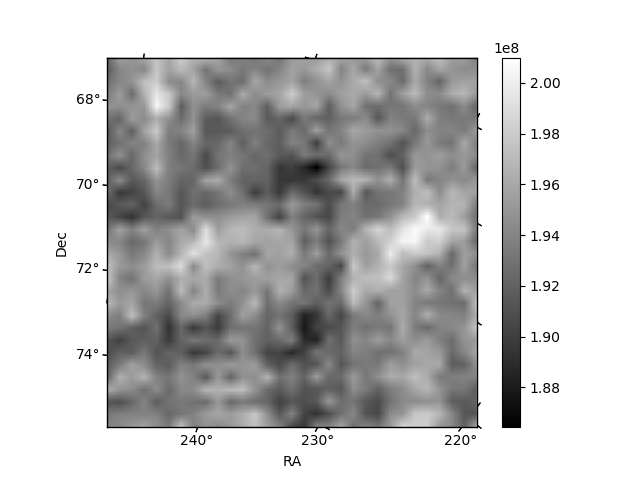
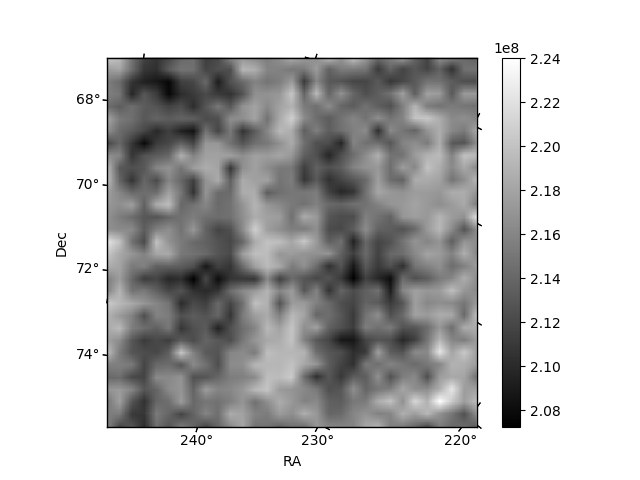
Histogram calculated using DETX and DETY for each event in the final _common_clean file
| Quadrant A | 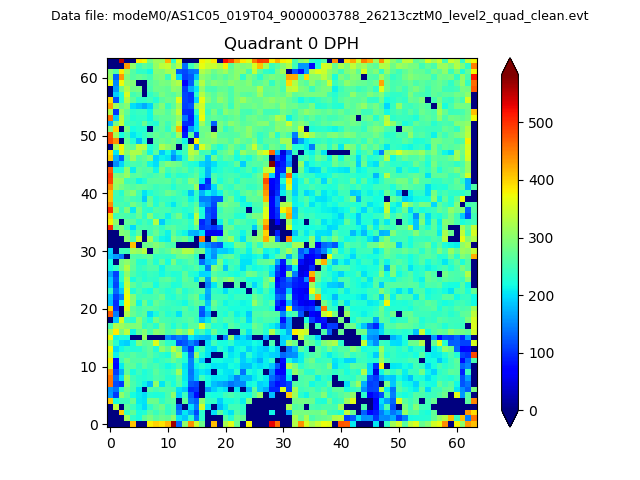 |
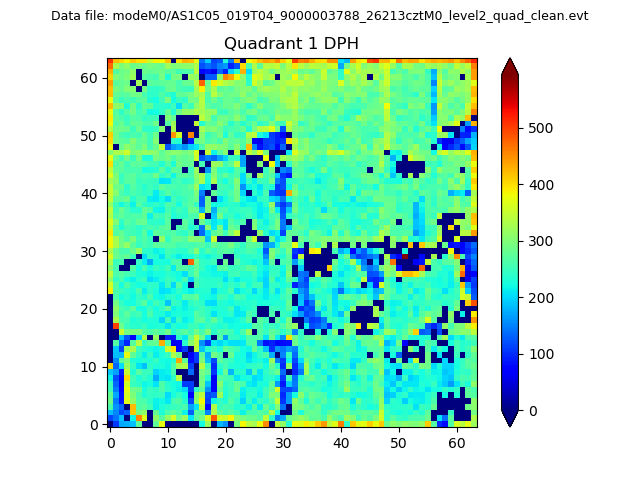 |
Quadrant B |
|---|---|---|---|
| Quadrant D | 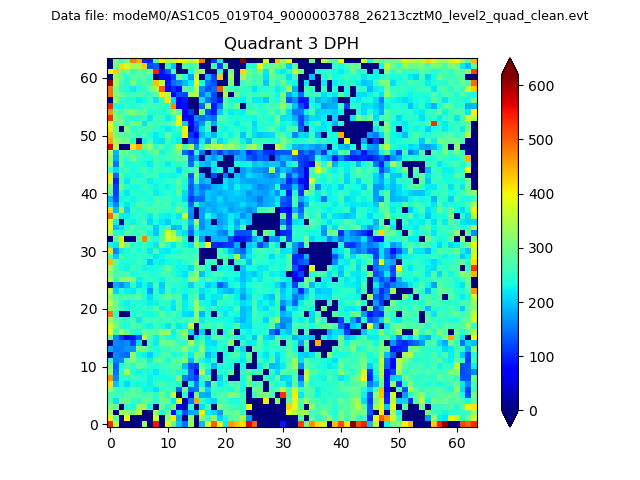 |
 |
Quadrant C |
| Plot type | Count rate plots | Images |
|---|---|---|
| Comparison with Poisson distribution Blue bars denote a histogram of data divided into 1 sec bins. Red curve is a Poisson curve with rate = median count rate of data. |
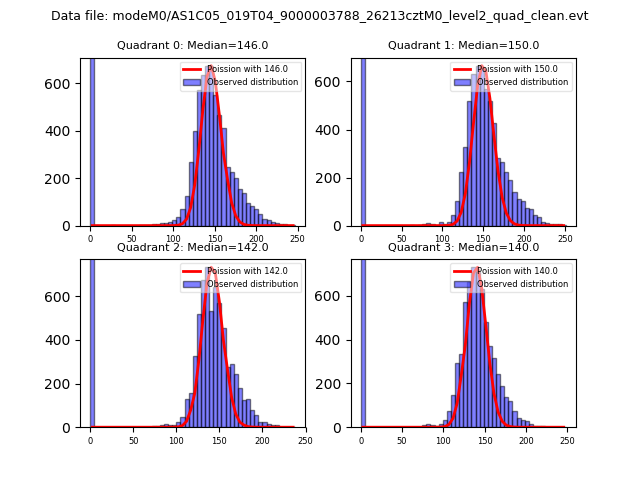 |
 |
| Quadrant-wise count rates Data is divided into 100 sec bins |
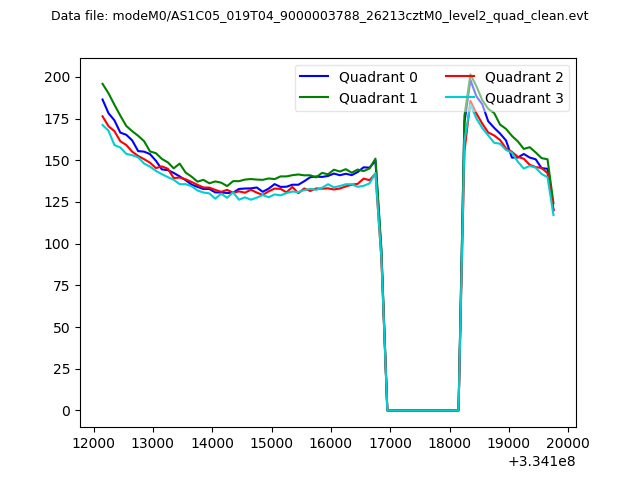 |
|
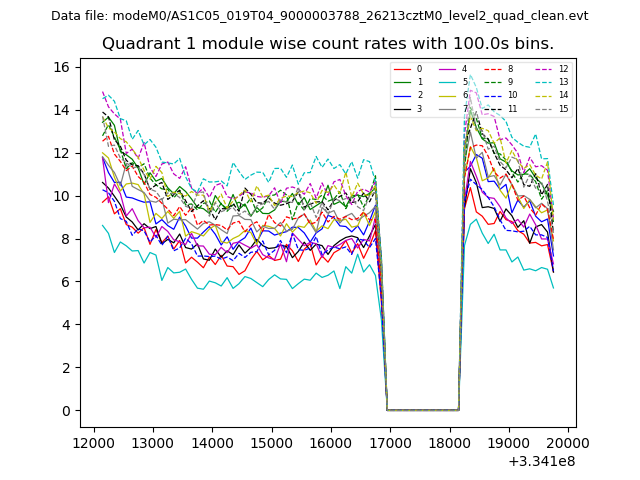
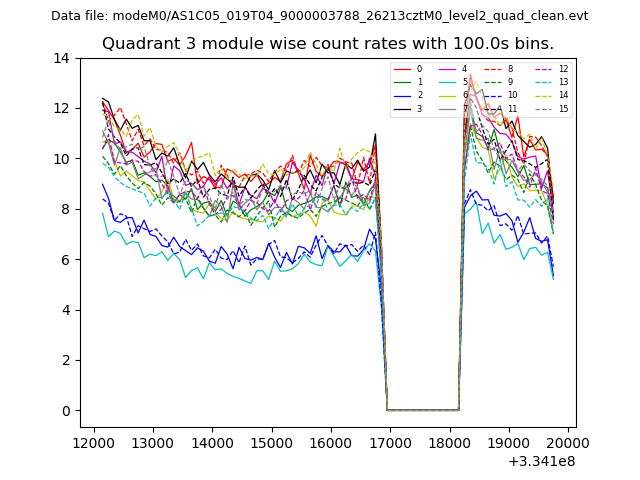
| Module-wise count rates for Quadrant A Data is divided into 100 sec bins |
 |
 |
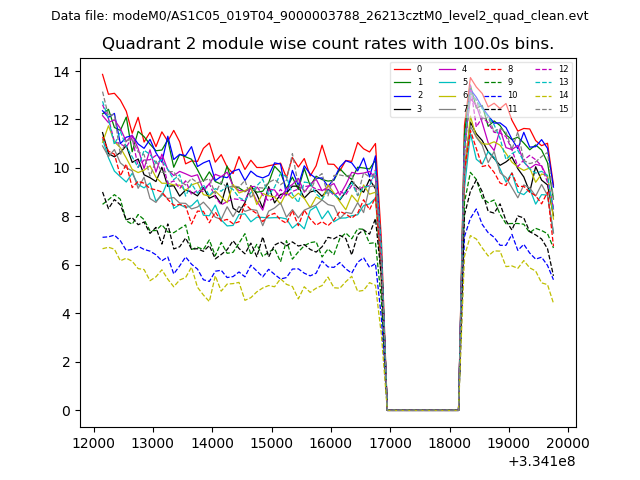
| Module-wise count rates for Quadrant B Data is divided into 100 sec bins |
 |
 |
| Module-wise count rates for Quadrant C Data is divided into 100 sec bins |
 |
 |
| Module-wise count rates for Quadrant D Data is divided into 100 sec bins |
 |
 |
| Parameter | Plot |
|---|---|
| CZT HV Monitor | 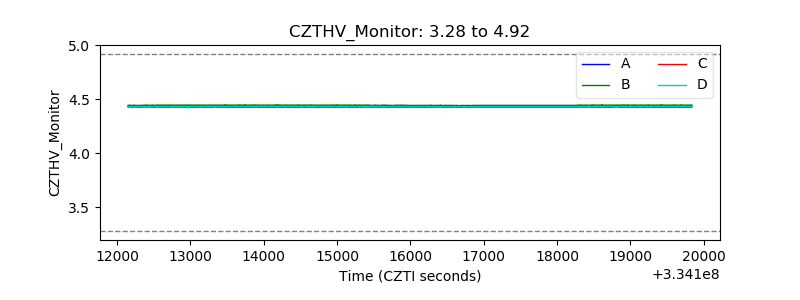 |
| D_VDD | 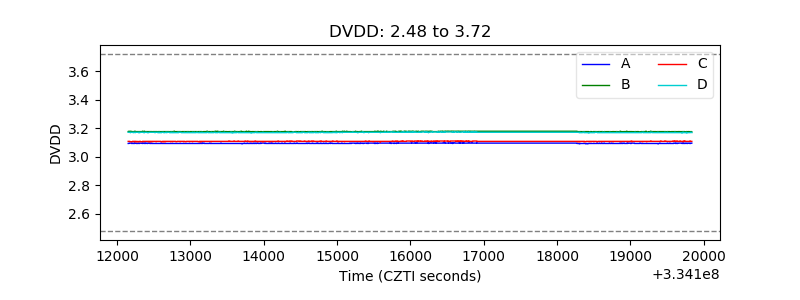 |
| Temperature 1 | 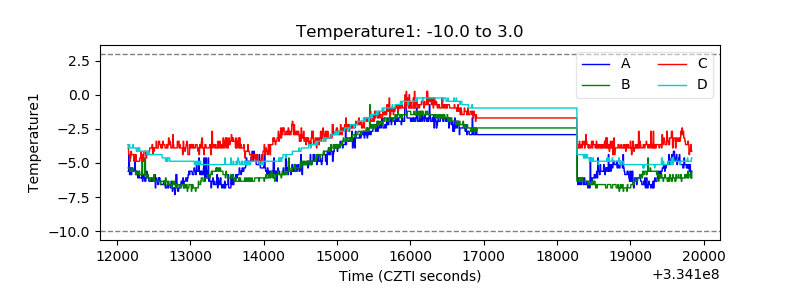 |
| Veto HV Monitor | 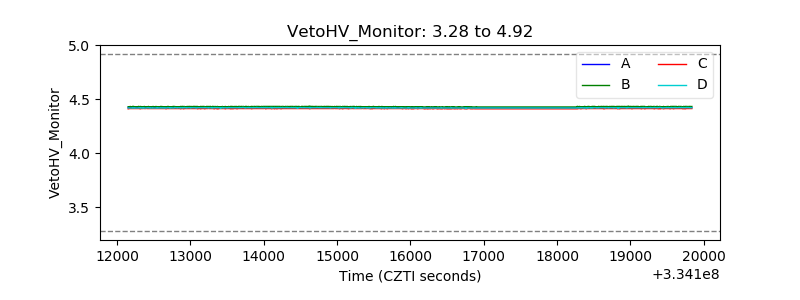 |
| Veto LLD | 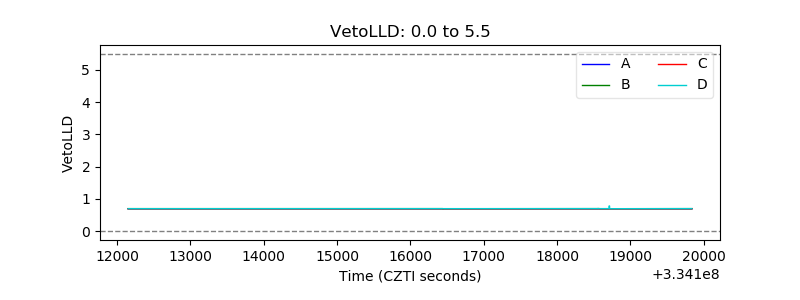 |
| Alpha Counter | 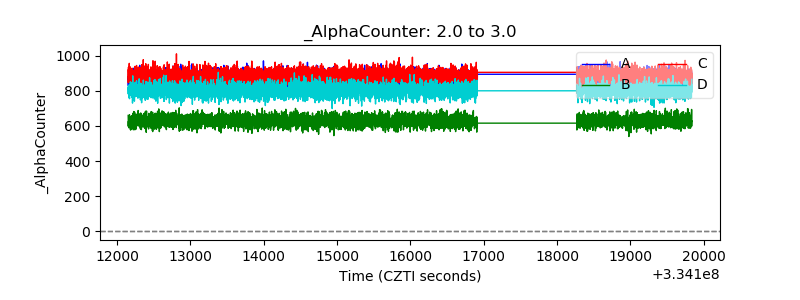 |
| _CPM_Rate | 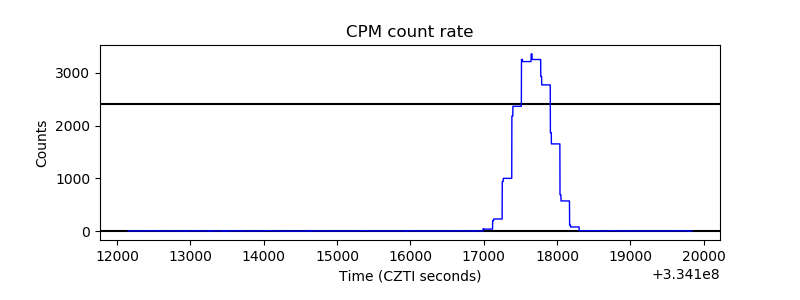 |
| CZT Counter | 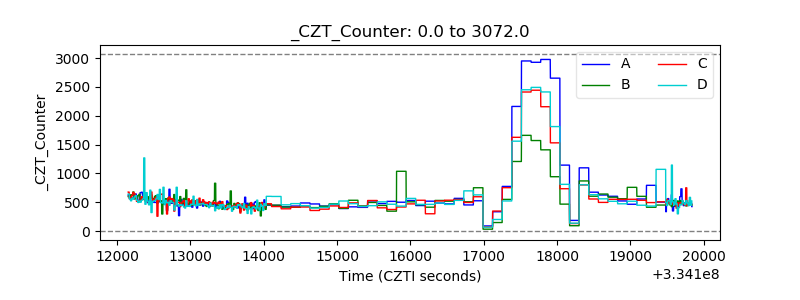 |
| +2.5 Volts monitor |  |
| +5 Volts monitor |  |
| _ROLL_ROT | 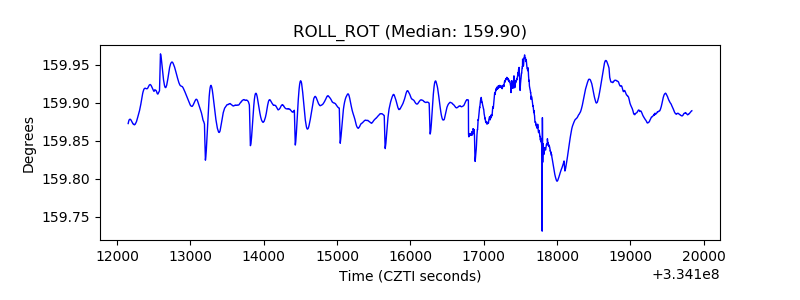 |
| _Roll_DEC | 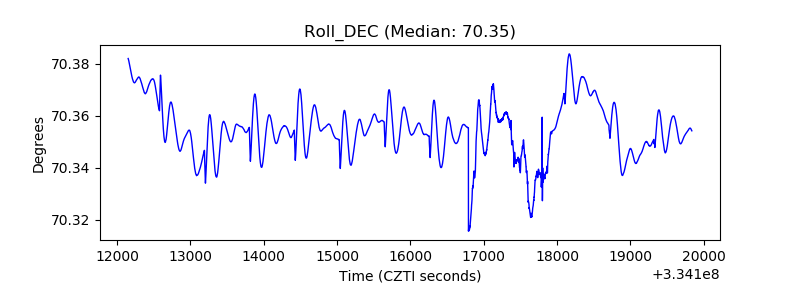 |
| _Roll_RA | 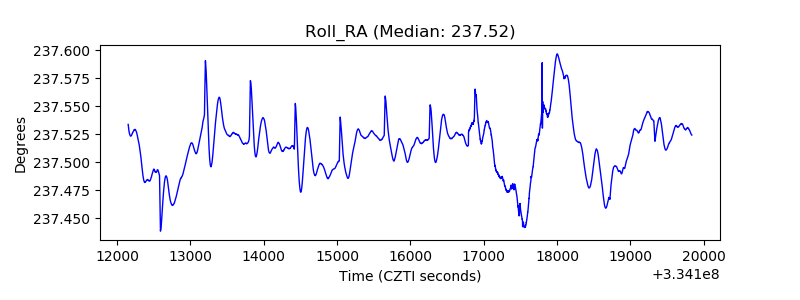 |
| Veto Counter | 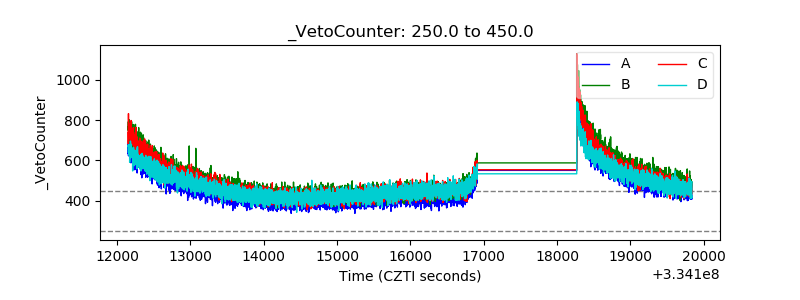 |