| Param | Original file | Final file |
|---|---|---|
| Filename | modeM0/AS1C05_019T04_9000003788_26214cztM0_level2.evt | modeM0/AS1C05_019T04_9000003788_26214cztM0_level2_quad_clean.evt |
| Size (bytes) | 463,775,040 | 126,141,120 |
| Size | 442.3 MB | 120.3 MB |
| Events in quadrant A | 3,253,703 | 868,386 |
| Events in quadrant B | 3,006,443 | 896,012 |
| Events in quadrant C | 2,984,232 | 838,604 |
| Events in quadrant D | 4,403,413 | 808,254 |
| Mode M9 | |||
|---|---|---|---|
| Quadrant | BADHDUFLAG | Total packets | Discarded packets |
| A | 0 | 14 | 0 |
| B | 0 | 14 | 0 |
| C | 0 | 14 | 0 |
| D | 0 | 14 | 0 |
| Mode M0 | |||
|---|---|---|---|
| Quadrant | BADHDUFLAG | Total packets | Discarded packets |
| A | 0 | 13203 | 0 |
| B | 0 | 12360 | 0 |
| C | 0 | 12426 | 0 |
| D | 0 | 16826 | 0 |
| Quadrant | Total seconds | Saturated seconds | Saturation percentage |
|---|---|---|---|
| A | 5852 | 77 | 1.315789% |
| B | 5853 | 33 | 0.563813% |
| C | 5853 | 45 | 0.768836% |
| D | 5853 | 367 | 6.270289% |
Noise dominated data is calculated using 1-second bins in cleaned event files. If a bin has >2000 counts, and if more than 50% of those come from <1% of pixels, then it is considered to be noise-dominated and hence unusable.
| Quadrant | # 1 sec bins | Bins with >0 counts | Bins with >2000 counts | High rate bins dominated by noise | Noise dominated (total time) | Noise dominated (detector-on time) | Marked lightcurve |
|---|---|---|---|---|---|---|---|
| A | 7257 | 5853 | 48 | 48 | 0.66% | 0.82% | 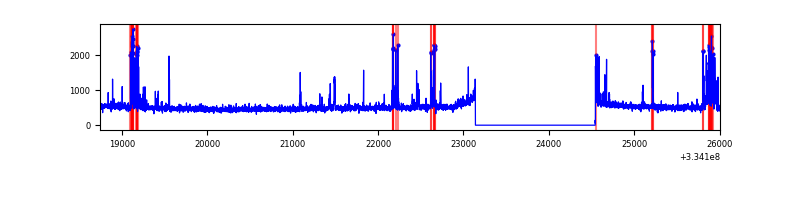 |
| B | 7258 | 5854 | 0 | 0 | 0.00% | 0.00% | 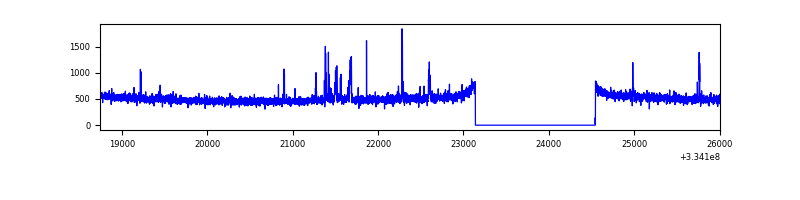 |
| C | 7258 | 5854 | 0 | 0 | 0.00% | 0.00% | 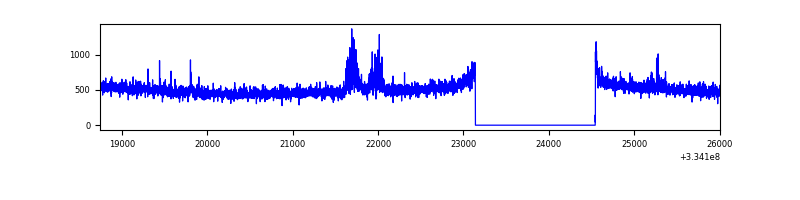 |
| D | 7258 | 5854 | 355 | 355 | 4.89% | 6.06% | 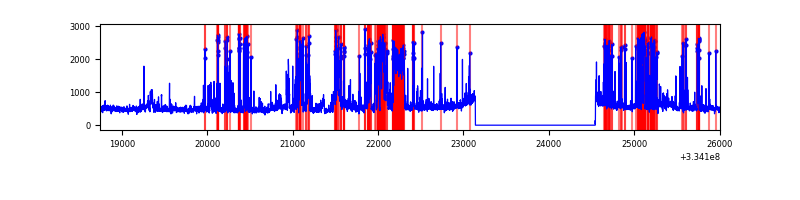 |
Top three noisy pixels from each quadrant. If the there are fewer than three noisy pixels in the level2.evt file, extra rows are filled as -1
| Pixel properties | Quadrant properties | ||||||
|---|---|---|---|---|---|---|---|
| Quadrant | DetID | PixID | Counts | Sigma | Mean | Median | Sigma |
| A | 0 | 13 | 363966 | 2445.22 | 749 | 736 | 148.5 |
| A | 13 | 254 | 9565 | 59.44 | 749 | 736 | 148.5 |
| A | 0 | 226 | 6528 | 38.99 | 749 | 736 | 148.5 |
| B | 0 | 190 | 58811 | 419.43 | 747 | 730 | 138.5 |
| B | 5 | 172 | 17283 | 119.54 | 747 | 730 | 138.5 |
| B | 12 | 111 | 15964 | 110.01 | 747 | 730 | 138.5 |
| C | 14 | 238 | 117629 | 717.65 | 708 | 712 | 162.9 |
| C | 0 | 239 | 69446 | 421.9 | 708 | 712 | 162.9 |
| C | 3 | 233 | 33304 | 200.05 | 708 | 712 | 162.9 |
| D | 1 | 52 | 1605205 | 9631.23 | 703 | 686 | 166.6 |
| D | 13 | 168 | 102229 | 609.52 | 703 | 686 | 166.6 |
| D | 12 | 233 | 28684 | 168.06 | 703 | 686 | 166.6 |
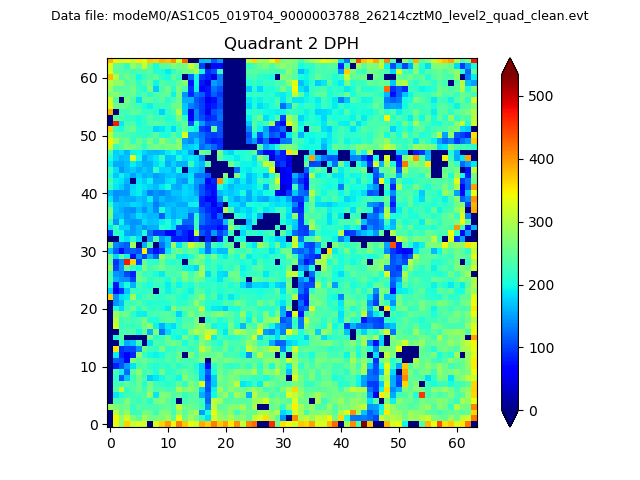
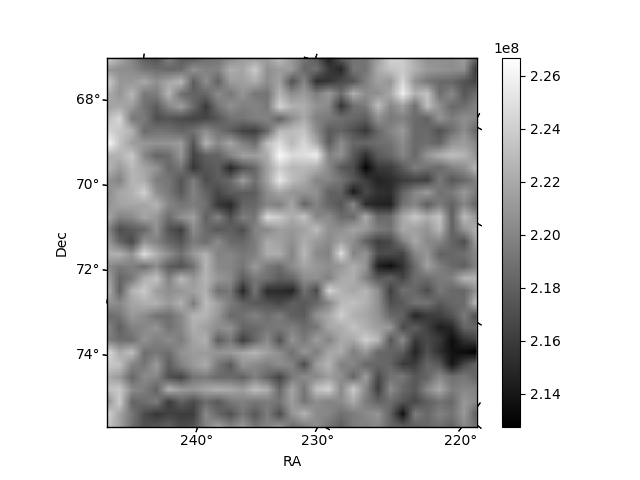
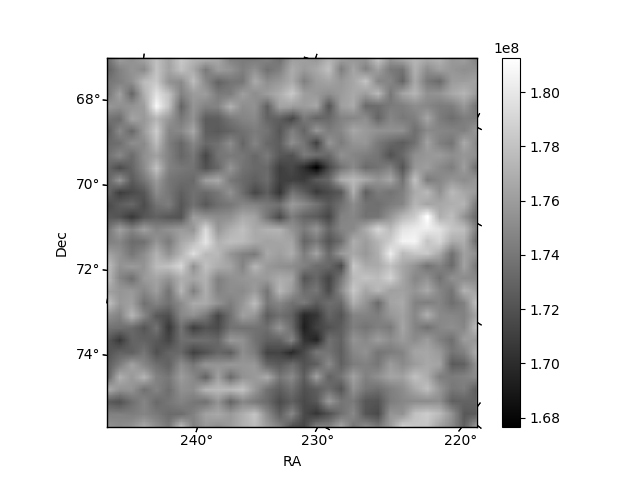
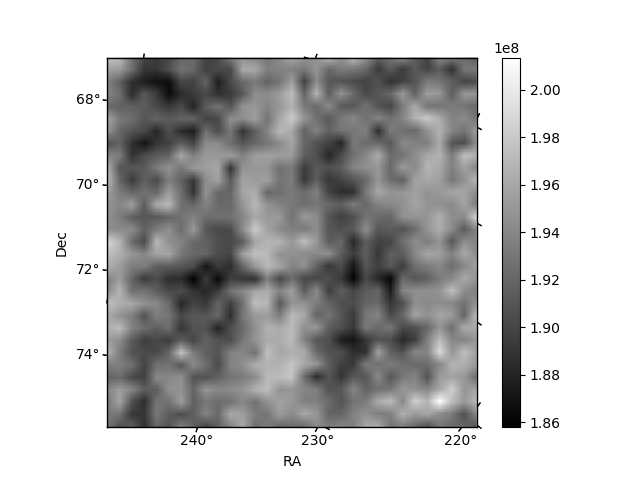
Histogram calculated using DETX and DETY for each event in the final _common_clean file
| Quadrant A | 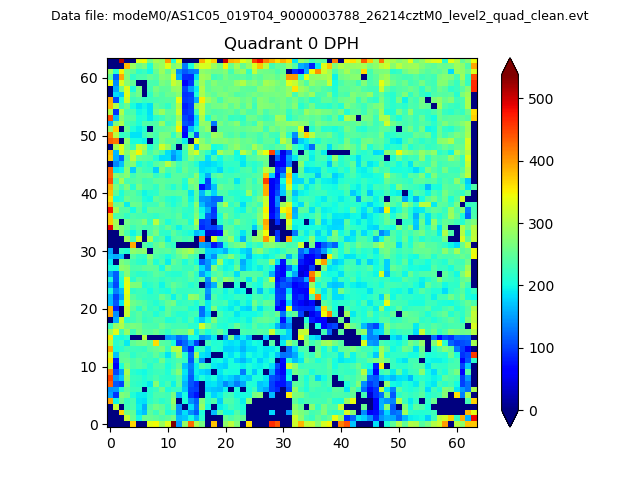 |
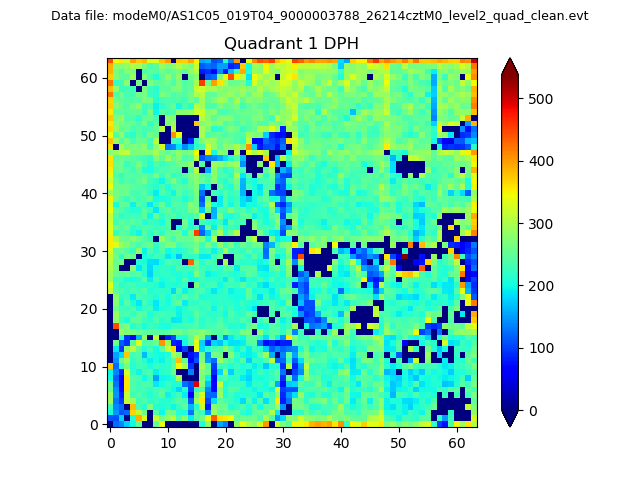 |
Quadrant B |
|---|---|---|---|
| Quadrant D | 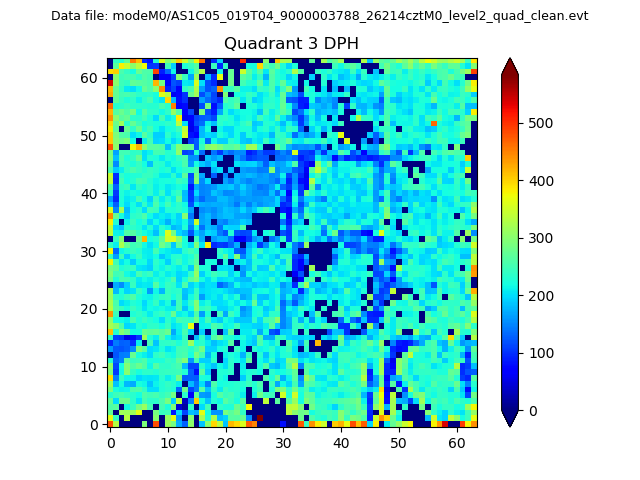 |
 |
Quadrant C |
| Plot type | Count rate plots | Images |
|---|---|---|
| Comparison with Poisson distribution Blue bars denote a histogram of data divided into 1 sec bins. Red curve is a Poisson curve with rate = median count rate of data. |
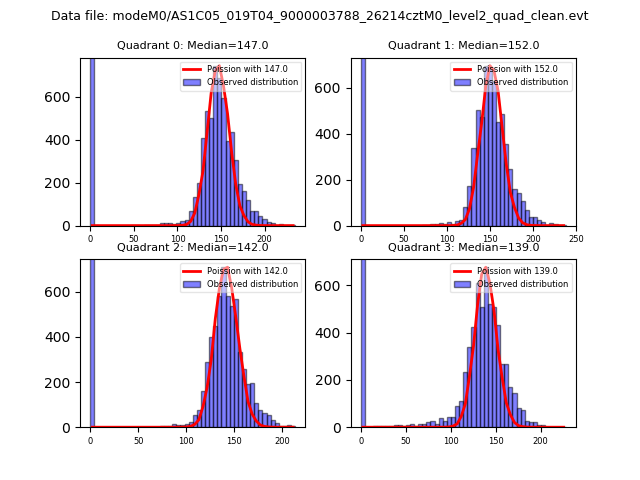 |
 |
| Quadrant-wise count rates Data is divided into 100 sec bins |
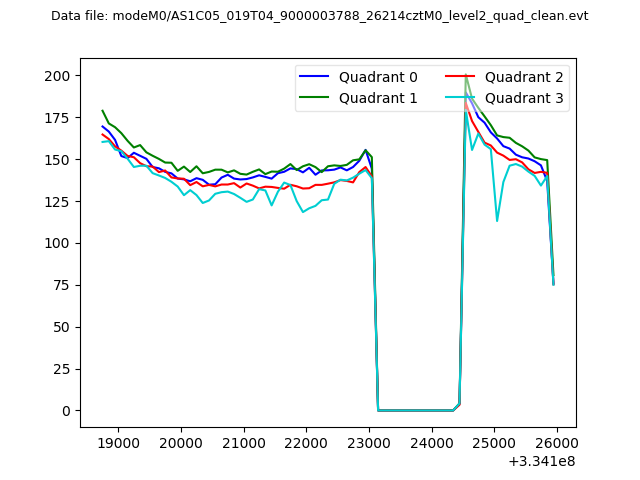 |
|
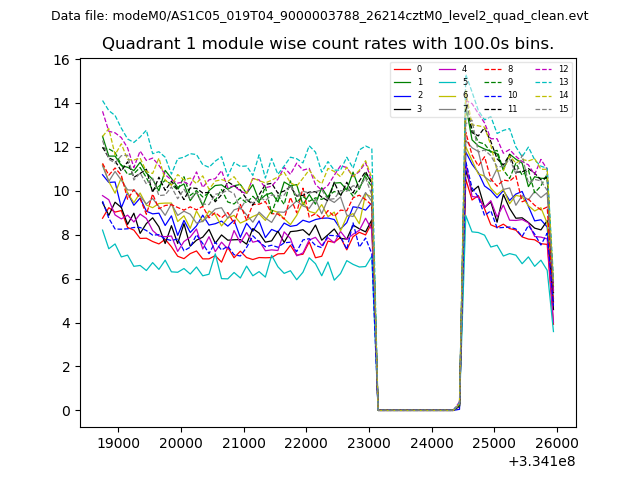
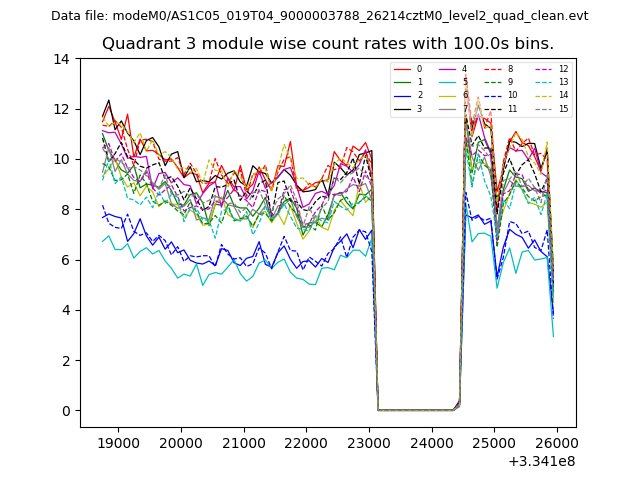
| Module-wise count rates for Quadrant A Data is divided into 100 sec bins |
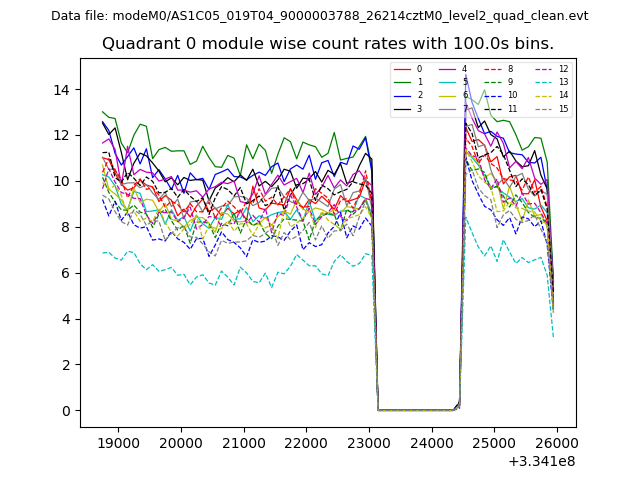 |
 |
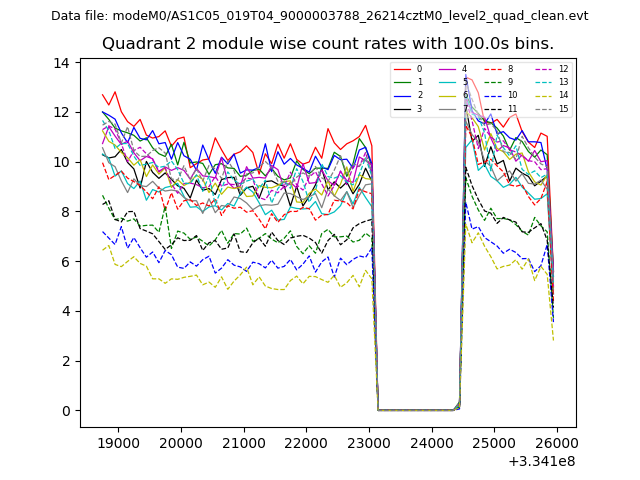
| Module-wise count rates for Quadrant B Data is divided into 100 sec bins |
 |
 |
| Module-wise count rates for Quadrant C Data is divided into 100 sec bins |
 |
 |
| Module-wise count rates for Quadrant D Data is divided into 100 sec bins |
 |
 |
| Parameter | Plot |
|---|---|
| CZT HV Monitor | 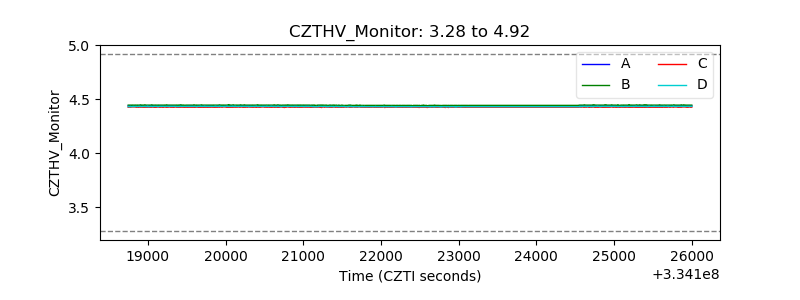 |
| D_VDD | 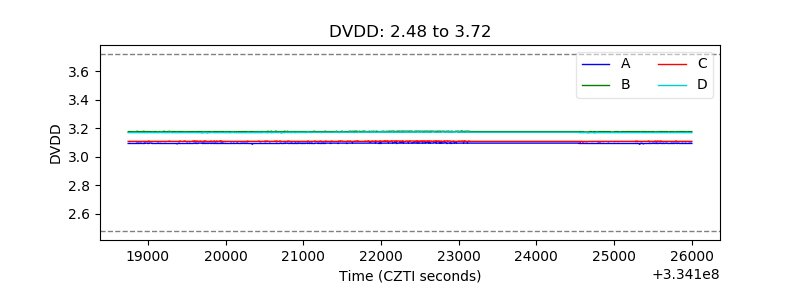 |
| Temperature 1 | 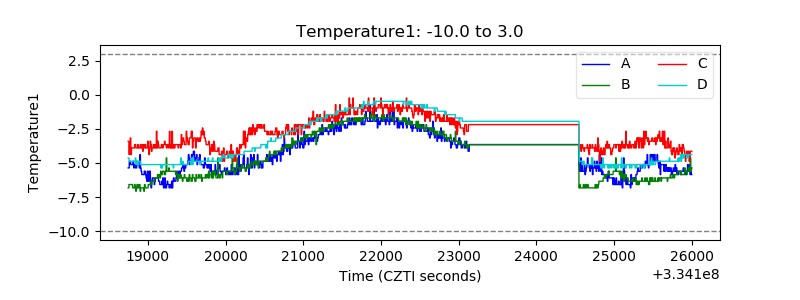 |
| Veto HV Monitor | 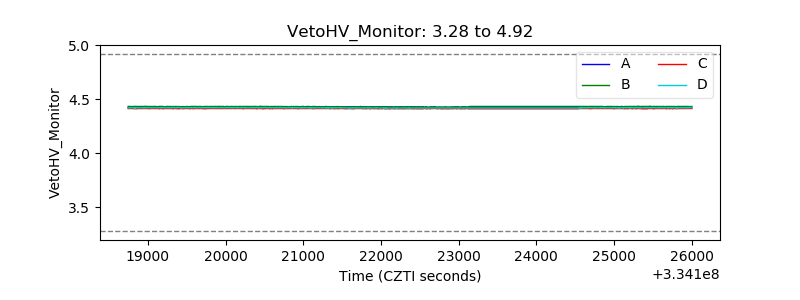 |
| Veto LLD | 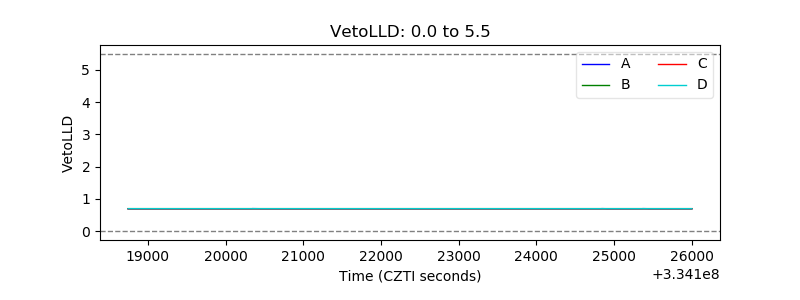 |
| Alpha Counter | 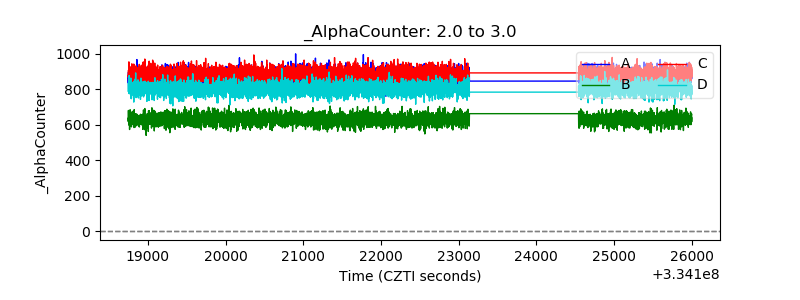 |
| _CPM_Rate | 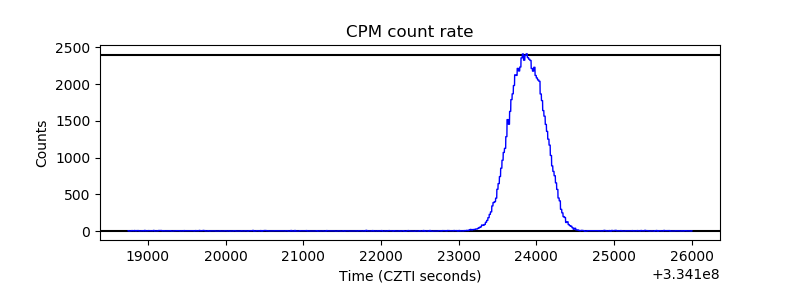 |
| CZT Counter |  |
| +2.5 Volts monitor |  |
| +5 Volts monitor |  |
| _ROLL_ROT | 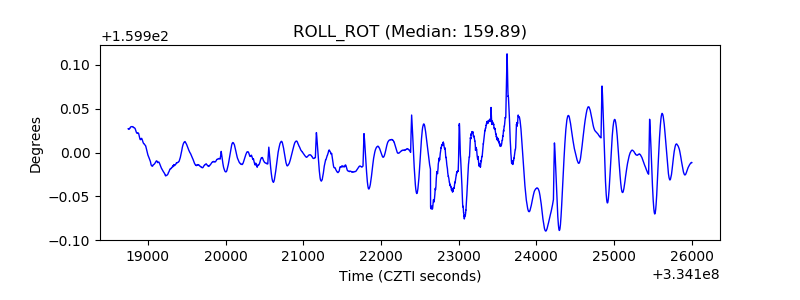 |
| _Roll_DEC | 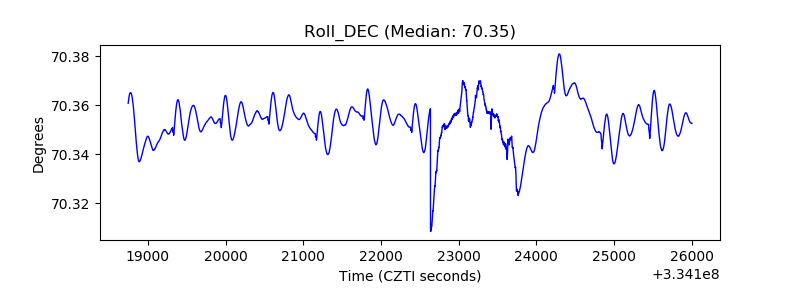 |
| _Roll_RA |  |
| Veto Counter | 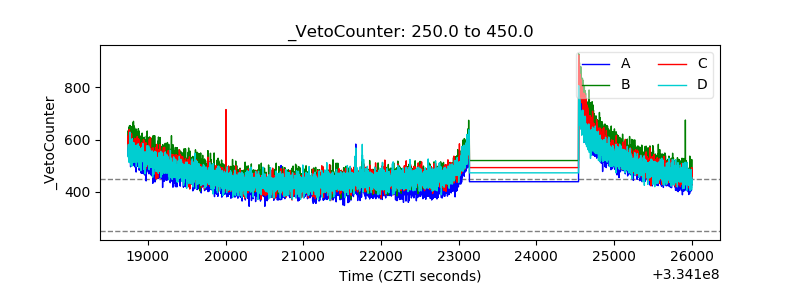 |