| Param | Original file | Final file |
|---|---|---|
| Filename | modeM0/AS1C05_019T04_9000003788_26215cztM0_level2.evt | modeM0/AS1C05_019T04_9000003788_26215cztM0_level2_quad_clean.evt |
| Size (bytes) | 510,312,960 | 117,930,240 |
| Size | 486.7 MB | 112.5 MB |
| Events in quadrant A | 3,196,260 | 832,996 |
| Events in quadrant B | 2,871,902 | 854,180 |
| Events in quadrant C | 2,860,564 | 798,751 |
| Events in quadrant D | 6,135,061 | 682,683 |
| Mode M9 | |||
|---|---|---|---|
| Quadrant | BADHDUFLAG | Total packets | Discarded packets |
| A | 0 | 14 | 0 |
| B | 0 | 14 | 0 |
| C | 0 | 14 | 0 |
| D | 0 | 14 | 0 |
| Mode M0 | |||
|---|---|---|---|
| Quadrant | BADHDUFLAG | Total packets | Discarded packets |
| A | 0 | 12967 | 0 |
| B | 0 | 11968 | 0 |
| C | 0 | 11970 | 0 |
| D | 0 | 21925 | 0 |
| Quadrant | Total seconds | Saturated seconds | Saturation percentage |
|---|---|---|---|
| A | 5764 | 114 | 1.977793% |
| B | 5765 | 70 | 1.214224% |
| C | 5765 | 84 | 1.457069% |
| D | 5764 | 1256 | 21.790423% |
Noise dominated data is calculated using 1-second bins in cleaned event files. If a bin has >2000 counts, and if more than 50% of those come from <1% of pixels, then it is considered to be noise-dominated and hence unusable.
| Quadrant | # 1 sec bins | Bins with >0 counts | Bins with >2000 counts | High rate bins dominated by noise | Noise dominated (total time) | Noise dominated (detector-on time) | Marked lightcurve |
|---|---|---|---|---|---|---|---|
| A | 7089 | 5765 | 59 | 59 | 0.83% | 1.02% | 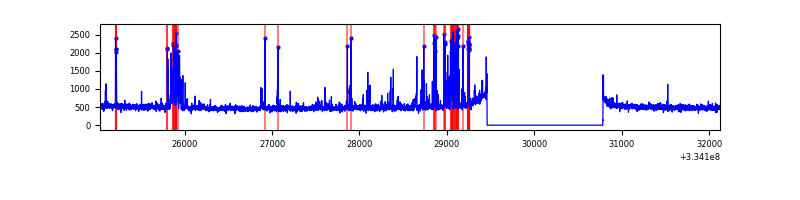 |
| B | 7090 | 5766 | 6 | 6 | 0.08% | 0.10% | 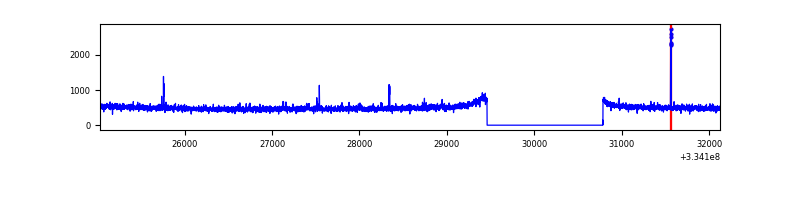 |
| C | 7090 | 5766 | 1 | 1 | 0.01% | 0.02% | 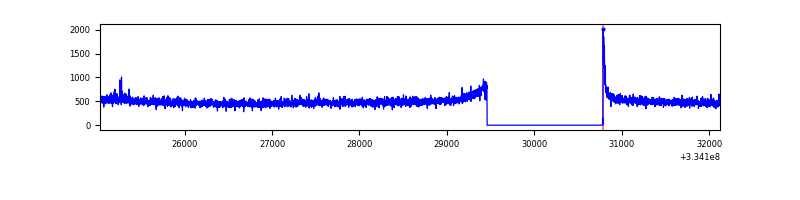 |
| D | 7089 | 5765 | 1257 | 1257 | 17.73% | 21.80% | 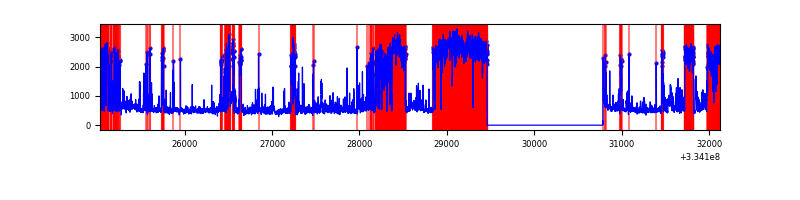 |
Top three noisy pixels from each quadrant. If the there are fewer than three noisy pixels in the level2.evt file, extra rows are filled as -1
| Pixel properties | Quadrant properties | ||||||
|---|---|---|---|---|---|---|---|
| Quadrant | DetID | PixID | Counts | Sigma | Mean | Median | Sigma |
| A | 0 | 13 | 379750 | 2647.46 | 730 | 716 | 143.2 |
| A | 13 | 254 | 8213 | 52.36 | 730 | 716 | 143.2 |
| A | 3 | 137 | 6379 | 39.55 | 730 | 716 | 143.2 |
| B | 0 | 190 | 21723 | 156.84 | 725 | 709 | 134.0 |
| B | 0 | 230 | 16091 | 114.8 | 725 | 709 | 134.0 |
| B | 12 | 111 | 15638 | 111.42 | 725 | 709 | 134.0 |
| C | 14 | 238 | 113727 | 716.19 | 689 | 693 | 157.8 |
| C | 3 | 233 | 51569 | 322.35 | 689 | 693 | 157.8 |
| C | 0 | 10 | 5995 | 33.59 | 689 | 693 | 157.8 |
| D | 1 | 52 | 3827309 | 26650.73 | 605 | 589 | 143.6 |
| D | 2 | 234 | 22306 | 151.25 | 605 | 589 | 143.6 |
| D | 12 | 233 | 14664 | 98.02 | 605 | 589 | 143.6 |
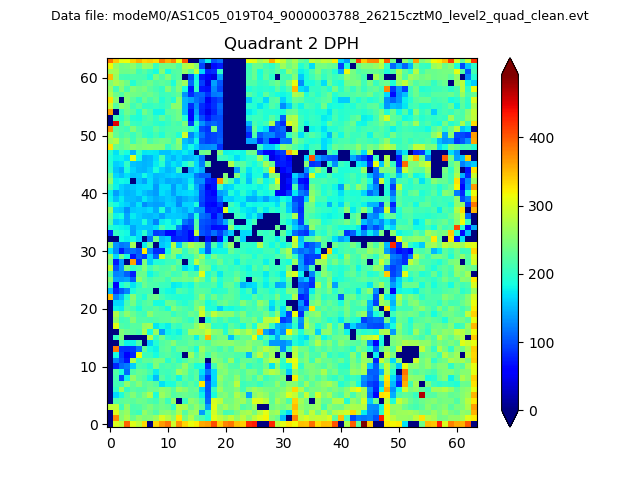
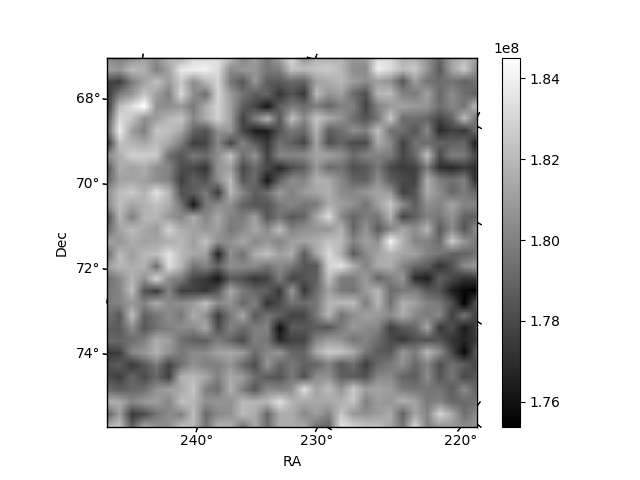
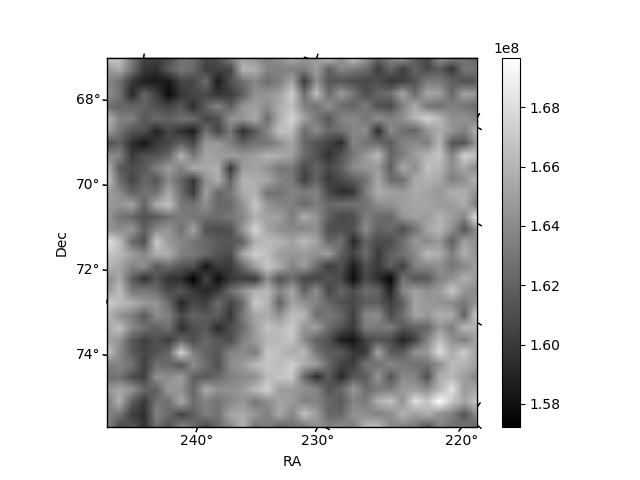
Histogram calculated using DETX and DETY for each event in the final _common_clean file
| Quadrant A | 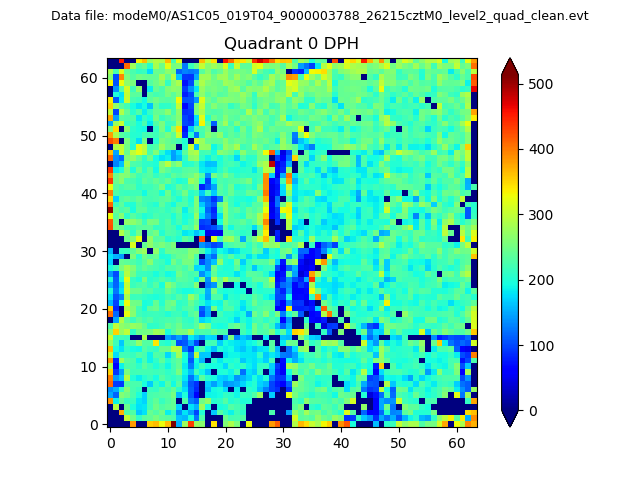 |
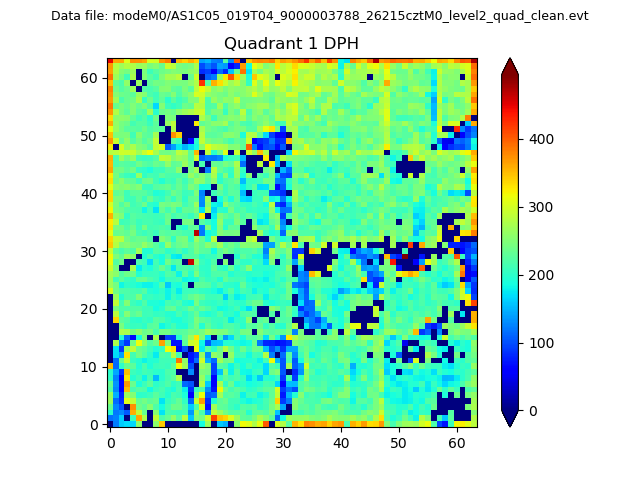 |
Quadrant B |
|---|---|---|---|
| Quadrant D | 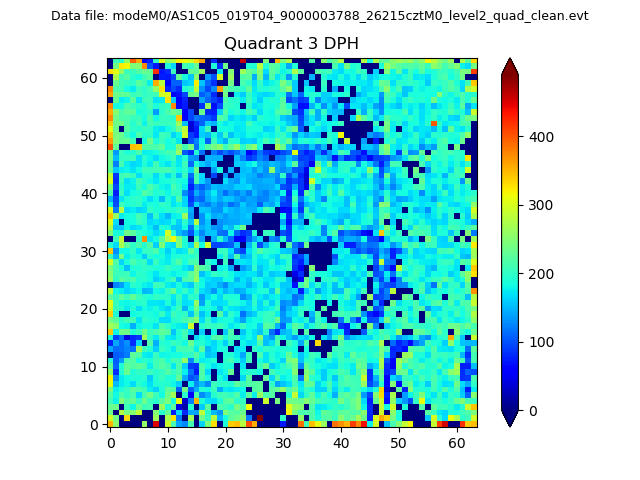 |
 |
Quadrant C |
| Plot type | Count rate plots | Images |
|---|---|---|
| Comparison with Poisson distribution Blue bars denote a histogram of data divided into 1 sec bins. Red curve is a Poisson curve with rate = median count rate of data. |
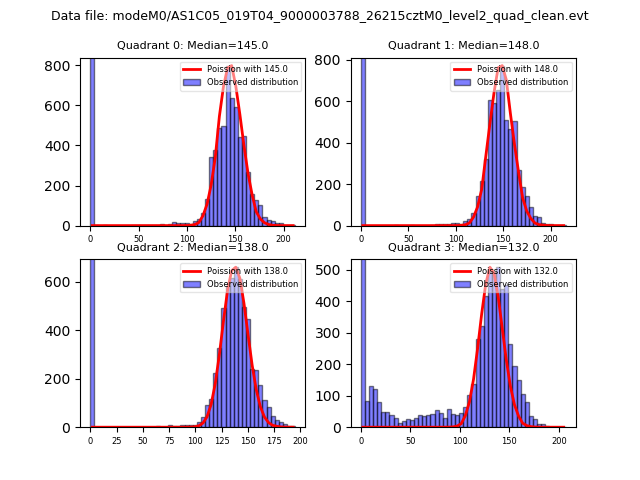 |
 |
| Quadrant-wise count rates Data is divided into 100 sec bins |
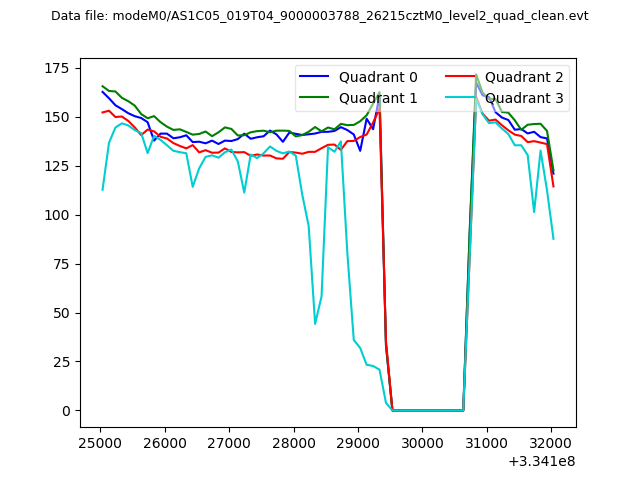 |
|
| Module-wise count rates for Quadrant A Data is divided into 100 sec bins |
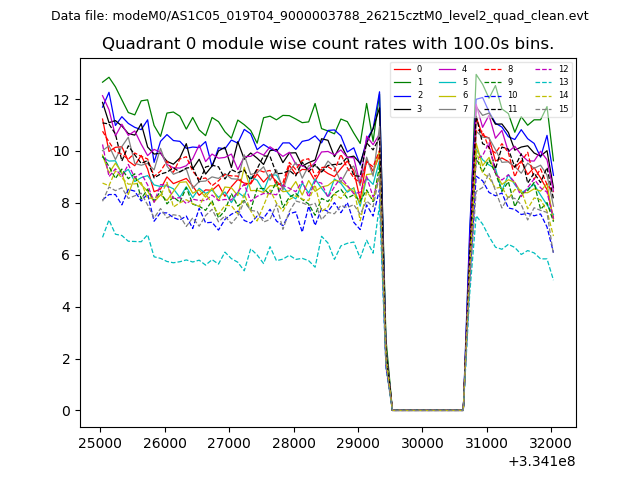 |
 |
| Module-wise count rates for Quadrant B Data is divided into 100 sec bins |
 |
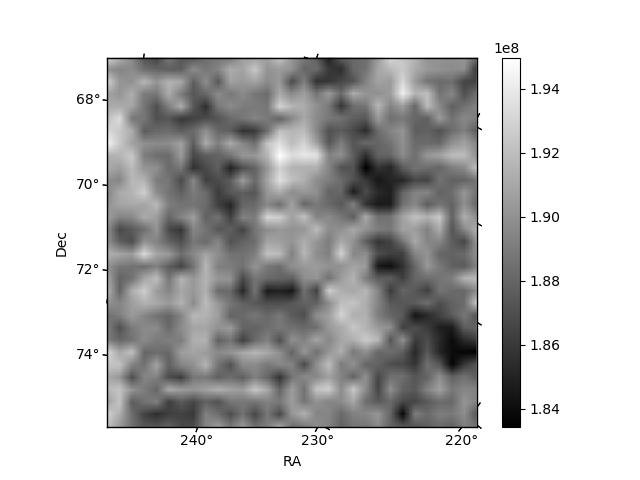 |
| Module-wise count rates for Quadrant C Data is divided into 100 sec bins |
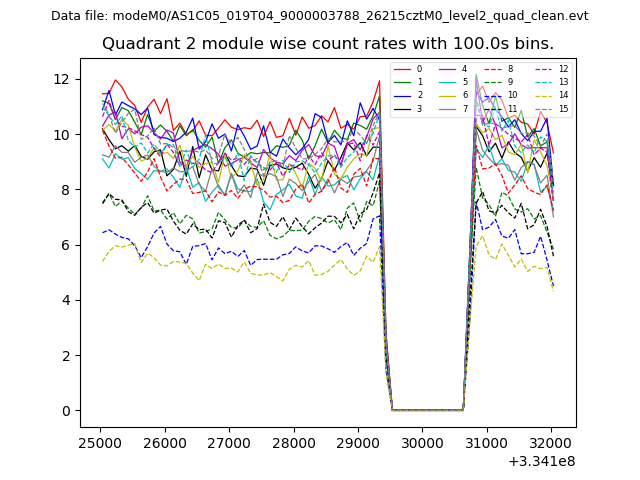 |
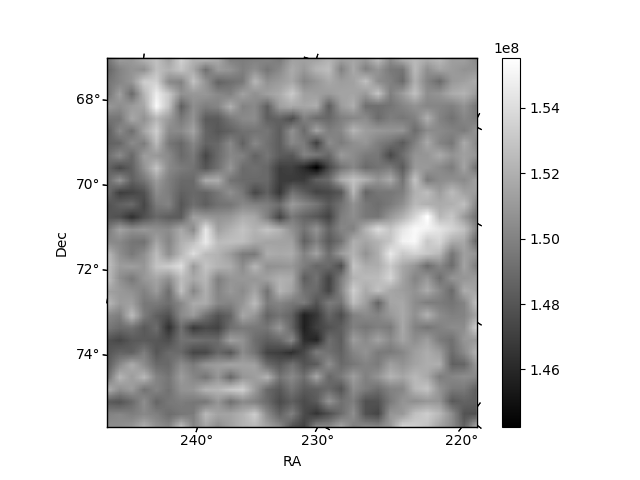 |
| Module-wise count rates for Quadrant D Data is divided into 100 sec bins |
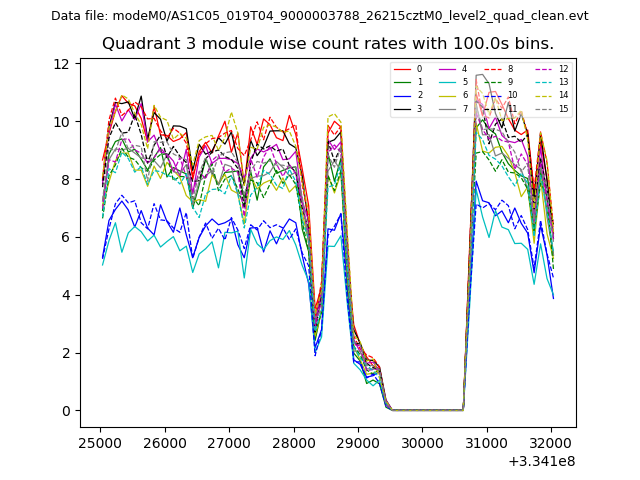 |
 |
| Parameter | Plot |
|---|---|
| CZT HV Monitor | 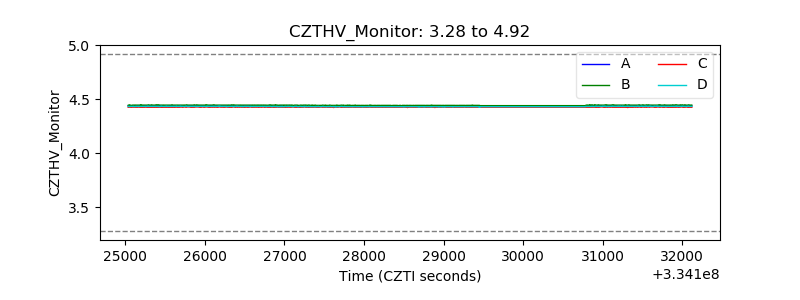 |
| D_VDD | 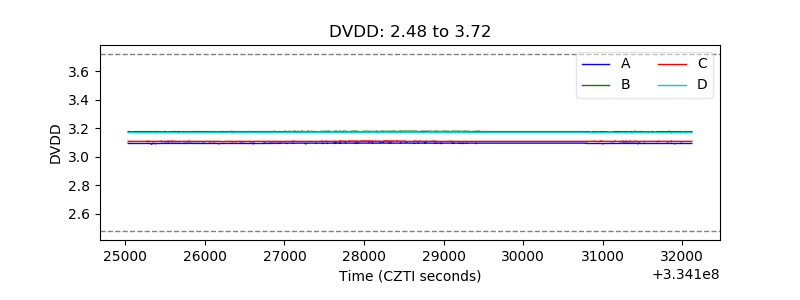 |
| Temperature 1 | 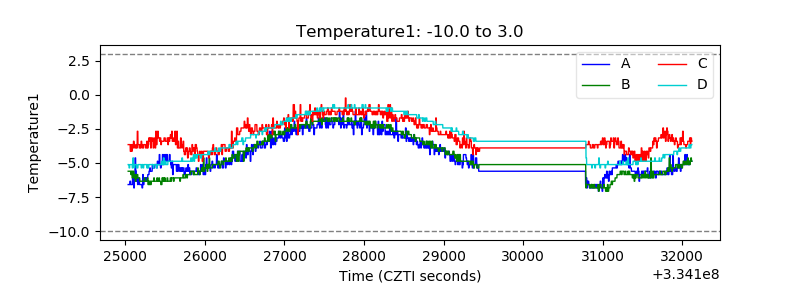 |
| Veto HV Monitor | 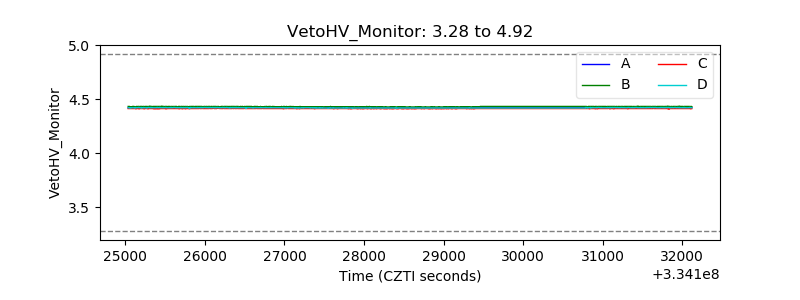 |
| Veto LLD | 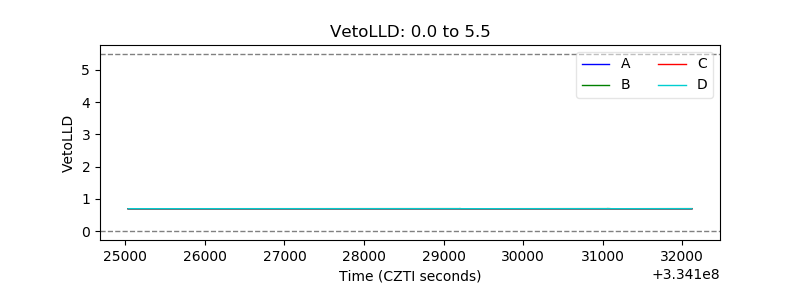 |
| Alpha Counter | 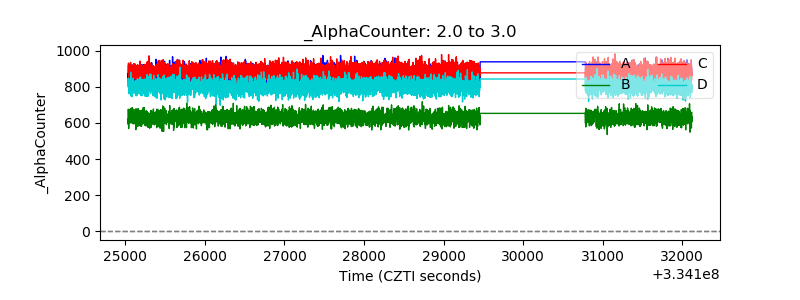 |
| _CPM_Rate | 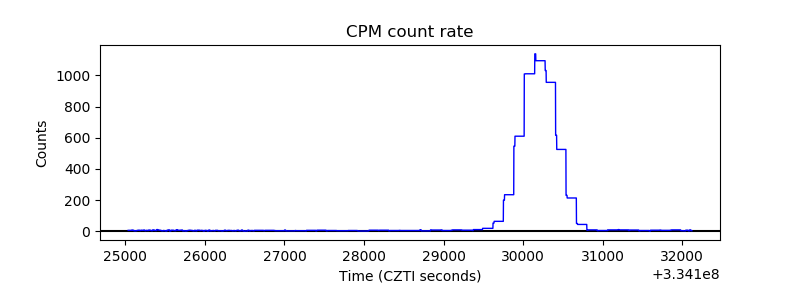 |
| CZT Counter |  |
| +2.5 Volts monitor |  |
| +5 Volts monitor |  |
| _ROLL_ROT |  |
| _Roll_DEC | 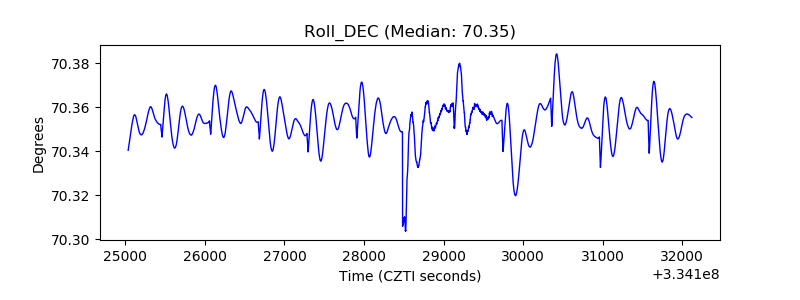 |
| _Roll_RA | 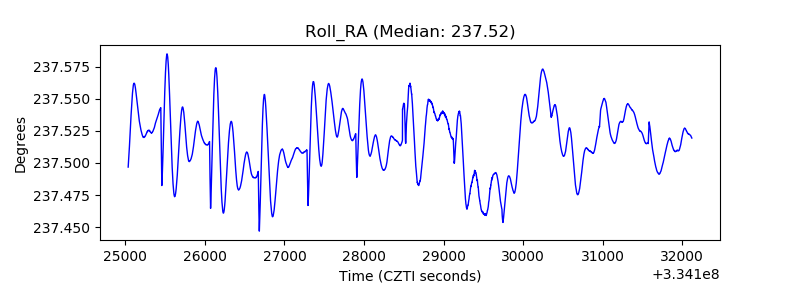 |
| Veto Counter | 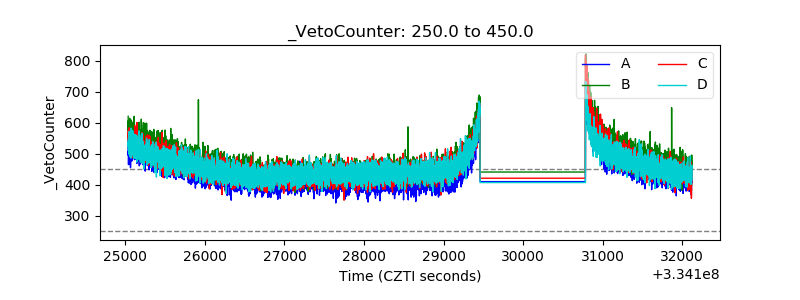 |