| Param | Original file | Final file |
|---|---|---|
| Filename | modeM0/AS1C05_019T04_9000003788_26217cztM0_level2.evt | modeM0/AS1C05_019T04_9000003788_26217cztM0_level2_quad_clean.evt |
| Size (bytes) | 429,822,720 | 127,419,840 |
| Size | 409.9 MB | 121.5 MB |
| Events in quadrant A | 3,082,909 | 863,371 |
| Events in quadrant B | 3,113,832 | 876,341 |
| Events in quadrant C | 3,182,253 | 829,789 |
| Events in quadrant D | 3,190,425 | 830,845 |
| Mode M9 | |||
|---|---|---|---|
| Quadrant | BADHDUFLAG | Total packets | Discarded packets |
| A | 0 | 6 | 0 |
| B | 0 | 6 | 0 |
| C | 0 | 6 | 0 |
| D | 0 | 6 | 0 |
| Mode M0 | |||
|---|---|---|---|
| Quadrant | BADHDUFLAG | Total packets | Discarded packets |
| A | 0 | 13468 | 0 |
| B | 0 | 13512 | 0 |
| C | 0 | 13751 | 0 |
| D | 0 | 13950 | 0 |
| Quadrant | Total seconds | Saturated seconds | Saturation percentage |
|---|---|---|---|
| A | 6582 | 98 | 1.488909% |
| B | 6583 | 92 | 1.397539% |
| C | 6583 | 108 | 1.640589% |
| D | 6583 | 72 | 1.093726% |
Noise dominated data is calculated using 1-second bins in cleaned event files. If a bin has >2000 counts, and if more than 50% of those come from <1% of pixels, then it is considered to be noise-dominated and hence unusable.
| Quadrant | # 1 sec bins | Bins with >0 counts | Bins with >2000 counts | High rate bins dominated by noise | Noise dominated (total time) | Noise dominated (detector-on time) | Marked lightcurve |
|---|---|---|---|---|---|---|---|
| A | 7197 | 6583 | 2 | 2 | 0.03% | 0.03% | 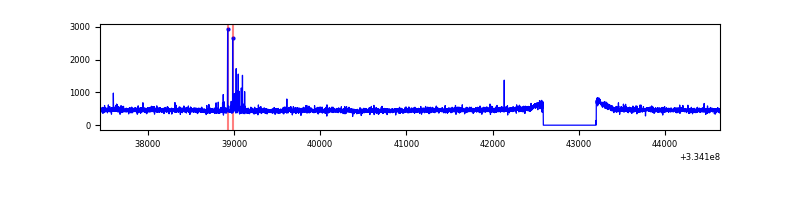 |
| B | 7198 | 6584 | 4 | 4 | 0.06% | 0.06% | 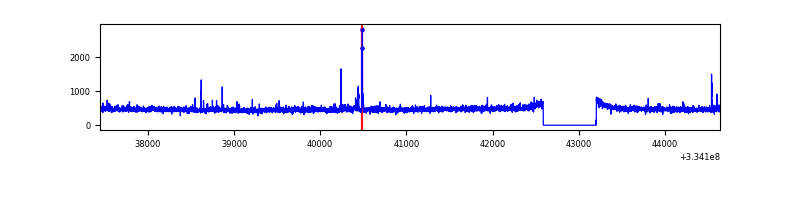 |
| C | 7198 | 6584 | 9 | 9 | 0.13% | 0.14% | 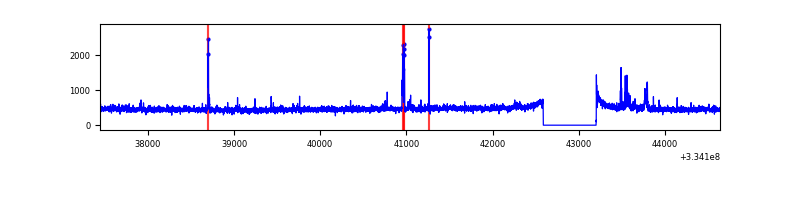 |
| D | 7198 | 6584 | 15 | 15 | 0.21% | 0.23% | 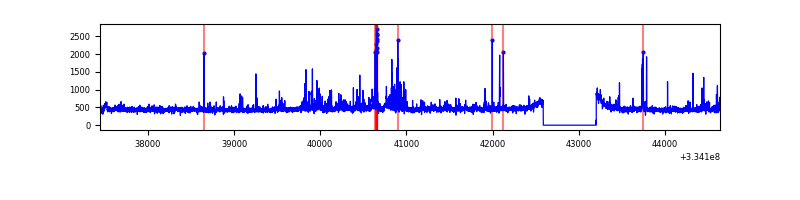 |
Top three noisy pixels from each quadrant. If the there are fewer than three noisy pixels in the level2.evt file, extra rows are filled as -1
| Pixel properties | Quadrant properties | ||||||
|---|---|---|---|---|---|---|---|
| Quadrant | DetID | PixID | Counts | Sigma | Mean | Median | Sigma |
| A | 0 | 13 | 42545 | 264.24 | 788 | 772 | 158.1 |
| A | 13 | 254 | 9823 | 57.25 | 788 | 772 | 158.1 |
| A | 3 | 137 | 7159 | 40.4 | 788 | 772 | 158.1 |
| B | 0 | 190 | 30685 | 202.05 | 782 | 763 | 148.1 |
| B | 5 | 172 | 27216 | 178.62 | 782 | 763 | 148.1 |
| B | 12 | 111 | 17715 | 114.47 | 782 | 763 | 148.1 |
| C | 14 | 238 | 122238 | 697.75 | 747 | 749 | 174.1 |
| C | 3 | 233 | 119362 | 681.23 | 747 | 749 | 174.1 |
| C | 2 | 16 | 29683 | 166.18 | 747 | 749 | 174.1 |
| D | 1 | 52 | 186748 | 1023.15 | 762 | 744 | 181.8 |
| D | 12 | 233 | 43600 | 235.74 | 762 | 744 | 181.8 |
| D | 2 | 234 | 27692 | 148.23 | 762 | 744 | 181.8 |
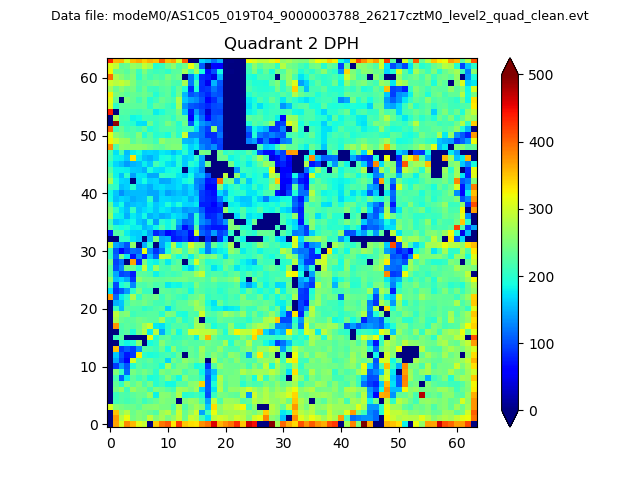
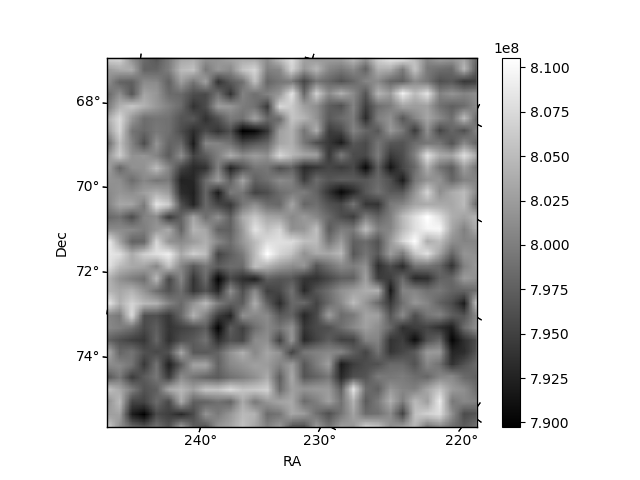
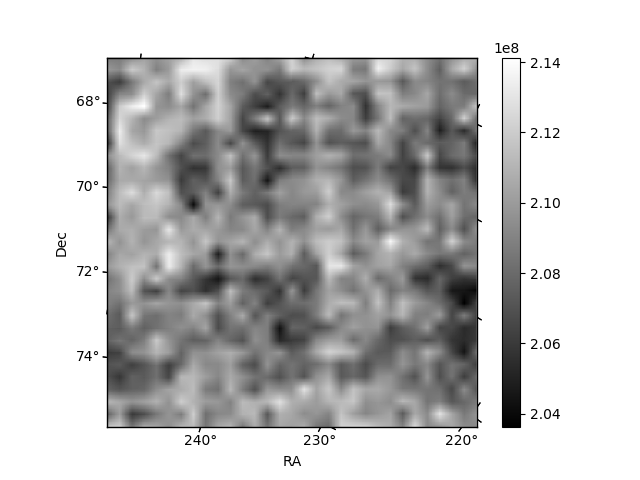
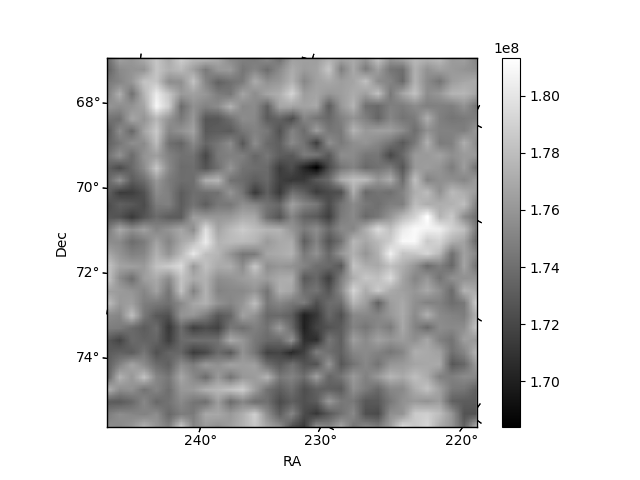
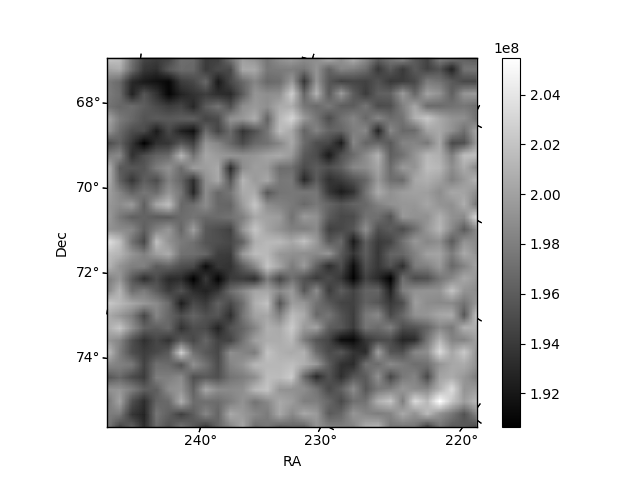
Histogram calculated using DETX and DETY for each event in the final _common_clean file
| Quadrant A | 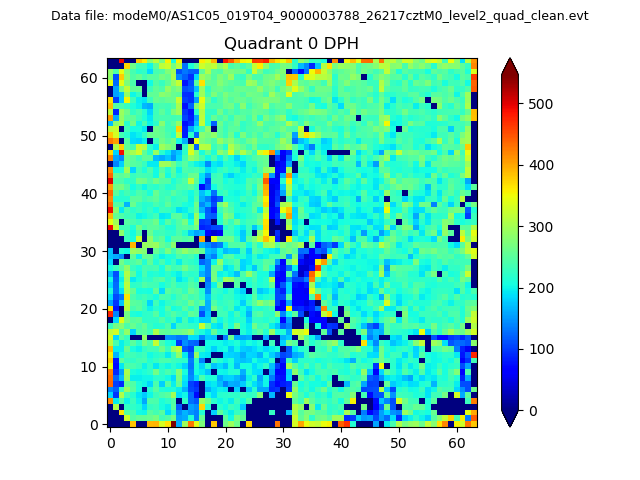 |
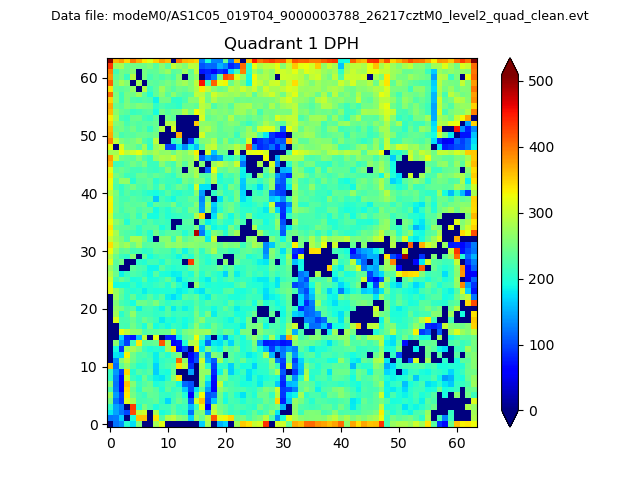 |
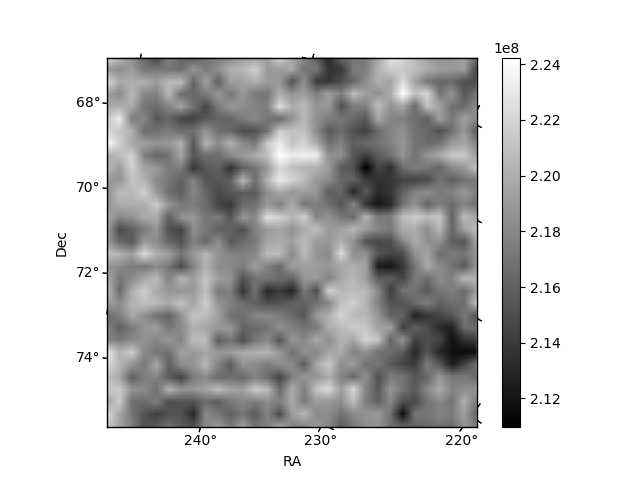
Quadrant B |
|---|---|---|---|
| Quadrant D | 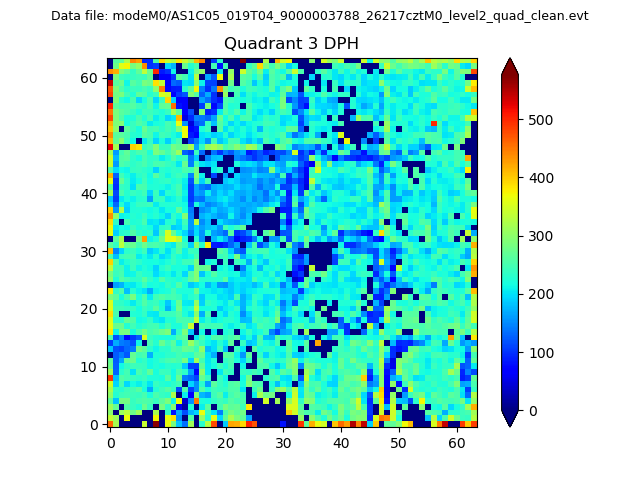 |
 |
Quadrant C |
| Plot type | Count rate plots | Images |
|---|---|---|
| Comparison with Poisson distribution Blue bars denote a histogram of data divided into 1 sec bins. Red curve is a Poisson curve with rate = median count rate of data. |
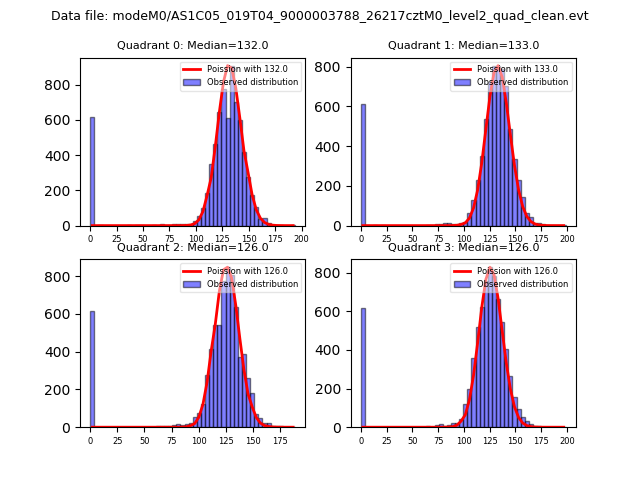 |
 |
| Quadrant-wise count rates Data is divided into 100 sec bins |
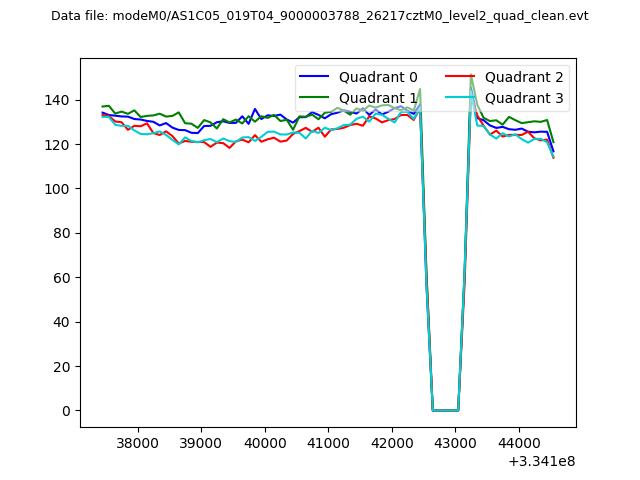 |
|
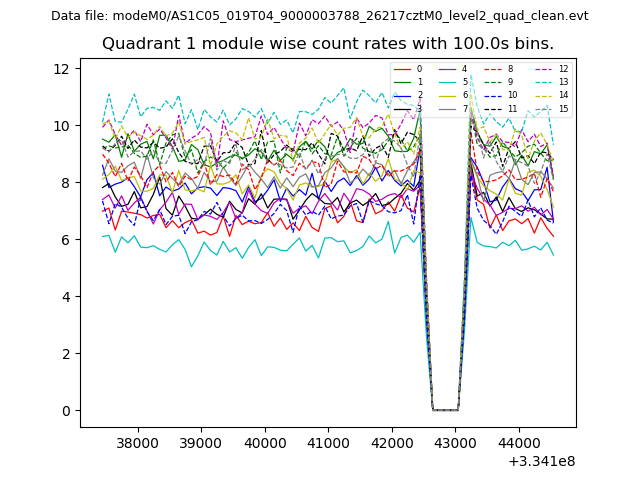
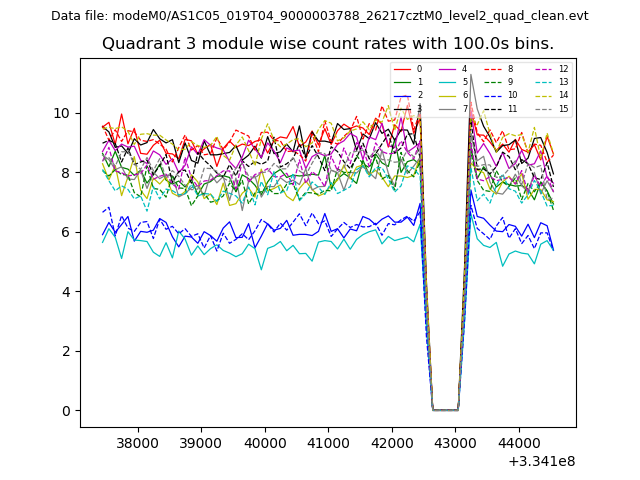
| Module-wise count rates for Quadrant A Data is divided into 100 sec bins |
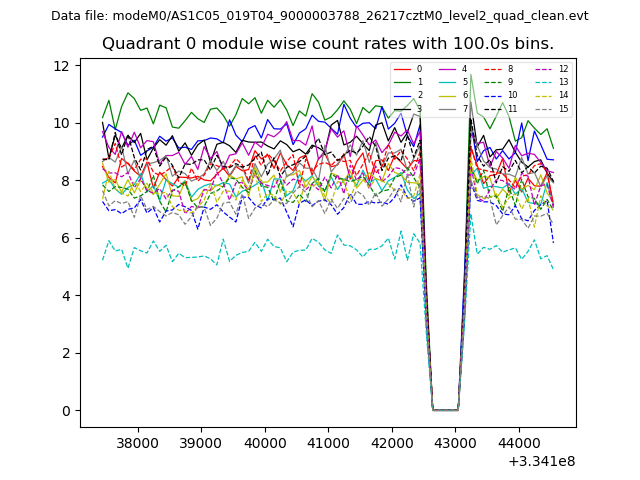 |
 |
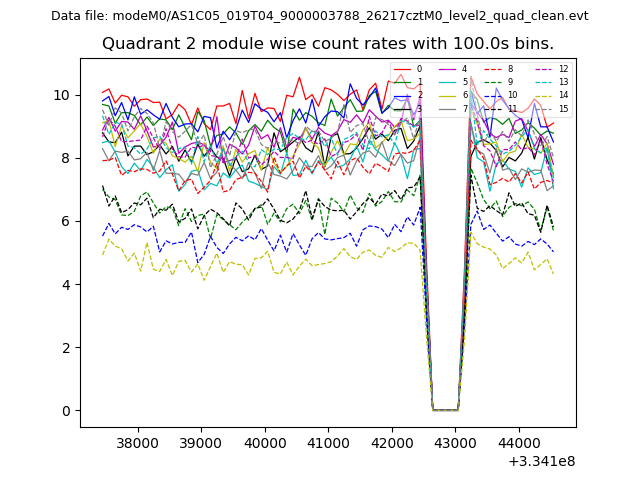
| Module-wise count rates for Quadrant B Data is divided into 100 sec bins |
 |
 |
| Module-wise count rates for Quadrant C Data is divided into 100 sec bins |
 |
 |
| Module-wise count rates for Quadrant D Data is divided into 100 sec bins |
 |
 |
| Parameter | Plot |
|---|---|
| CZT HV Monitor |  |
| D_VDD | 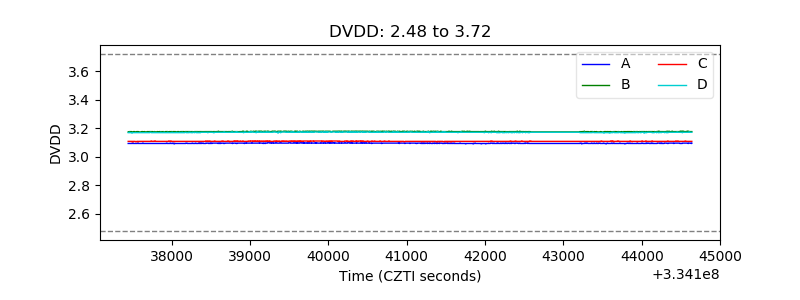 |
| Temperature 1 | 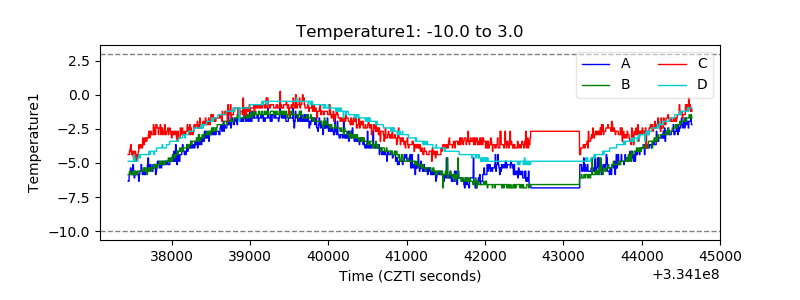 |
| Veto HV Monitor | 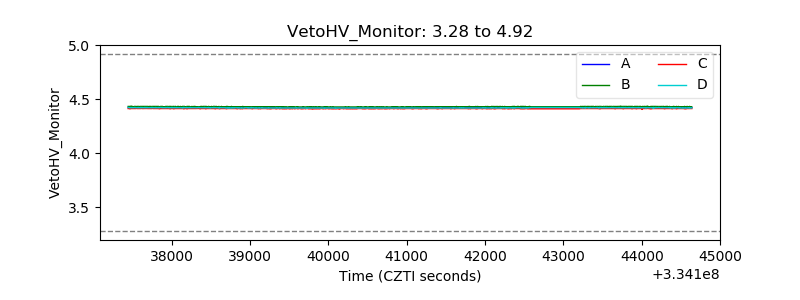 |
| Veto LLD | 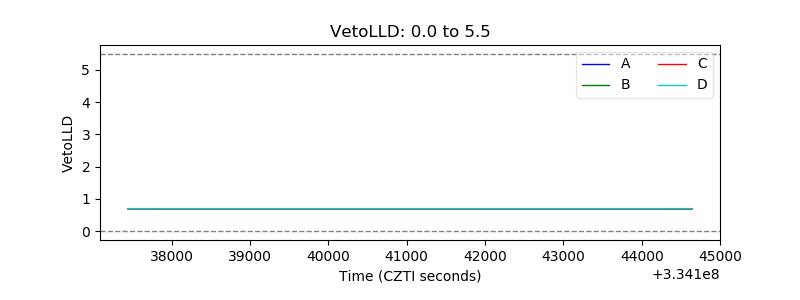 |
| Alpha Counter | 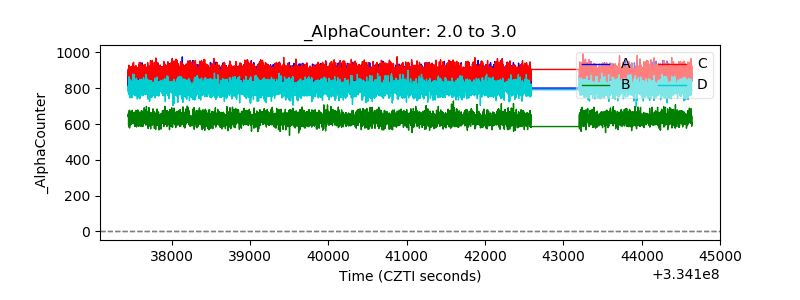 |
| _CPM_Rate | 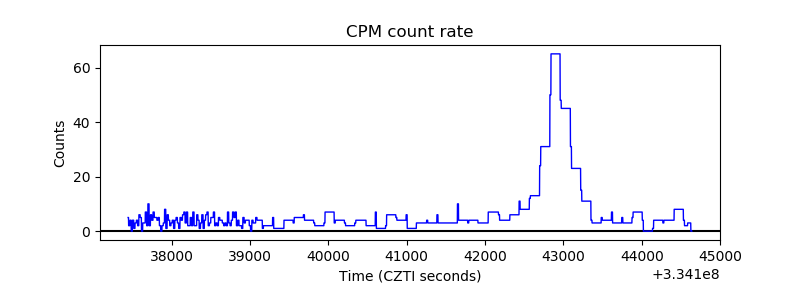 |
| CZT Counter | 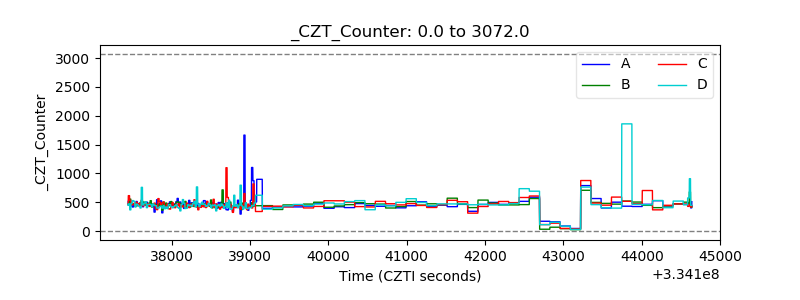 |
| +2.5 Volts monitor |  |
| +5 Volts monitor |  |
| _ROLL_ROT |  |
| _Roll_DEC | 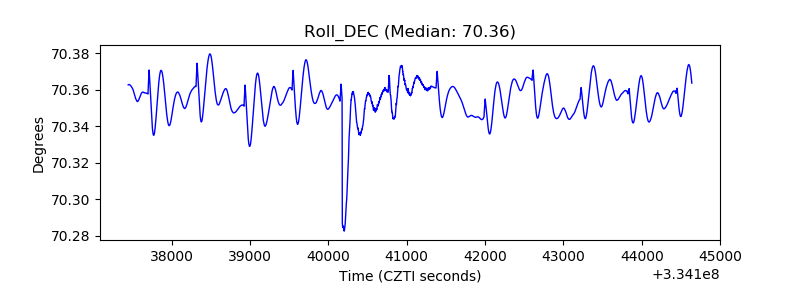 |
| _Roll_RA | 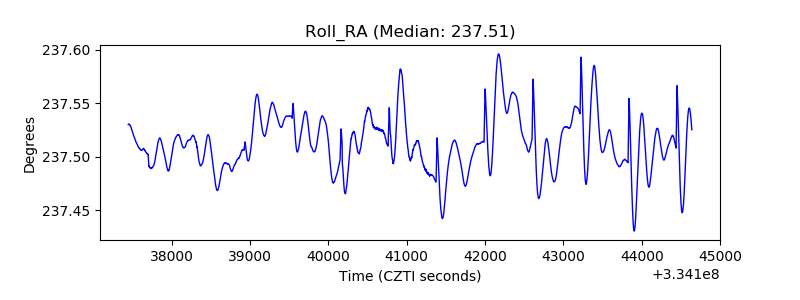 |
| Veto Counter |  |