| Param | Original file | Final file |
|---|---|---|
| Filename | modeM0/AS1C05_019T04_9000003788_26218cztM0_level2.evt | modeM0/AS1C05_019T04_9000003788_26218cztM0_level2_quad_clean.evt |
| Size (bytes) | 472,760,640 | 128,718,720 |
| Size | 450.9 MB | 122.8 MB |
| Events in quadrant A | 3,199,206 | 875,540 |
| Events in quadrant B | 3,668,443 | 875,489 |
| Events in quadrant C | 3,369,935 | 836,342 |
| Events in quadrant D | 3,614,840 | 834,332 |
| Mode M9 | |||
|---|---|---|---|
| Quadrant | BADHDUFLAG | Total packets | Discarded packets |
| A | 0 | 2 | 0 |
| B | 0 | 2 | 0 |
| C | 0 | 2 | 0 |
| D | 0 | 2 | 0 |
| Mode M0 | |||
|---|---|---|---|
| Quadrant | BADHDUFLAG | Total packets | Discarded packets |
| A | 0 | 14073 | 0 |
| B | 0 | 15423 | 0 |
| C | 0 | 14580 | 0 |
| D | 0 | 15530 | 0 |
| Quadrant | Total seconds | Saturated seconds | Saturation percentage |
|---|---|---|---|
| A | 6833 | 181 | 2.648910% |
| B | 6834 | 336 | 4.916594% |
| C | 6834 | 267 | 3.906936% |
| D | 6834 | 320 | 4.682470% |
Noise dominated data is calculated using 1-second bins in cleaned event files. If a bin has >2000 counts, and if more than 50% of those come from <1% of pixels, then it is considered to be noise-dominated and hence unusable.
| Quadrant | # 1 sec bins | Bins with >0 counts | Bins with >2000 counts | High rate bins dominated by noise | Noise dominated (total time) | Noise dominated (detector-on time) | Marked lightcurve |
|---|---|---|---|---|---|---|---|
| A | 7028 | 6835 | 0 | 0 | 0.00% | 0.00% | 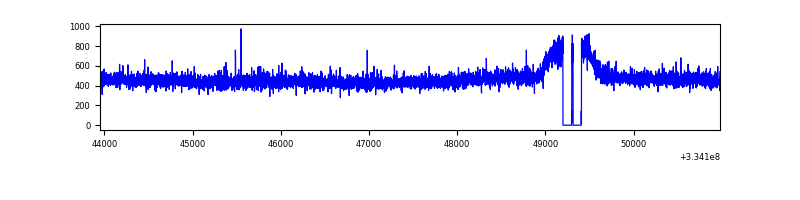 |
| B | 7029 | 6836 | 139 | 139 | 1.98% | 2.03% | 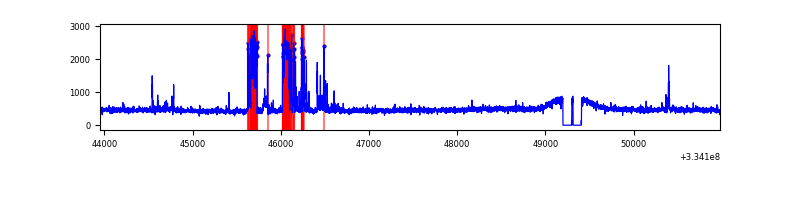 |
| C | 7029 | 6836 | 30 | 30 | 0.43% | 0.44% | 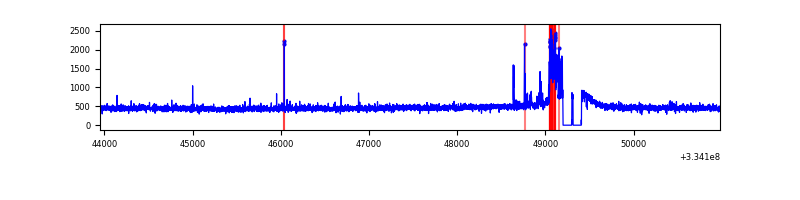 |
| D | 7029 | 6836 | 161 | 161 | 2.29% | 2.36% | 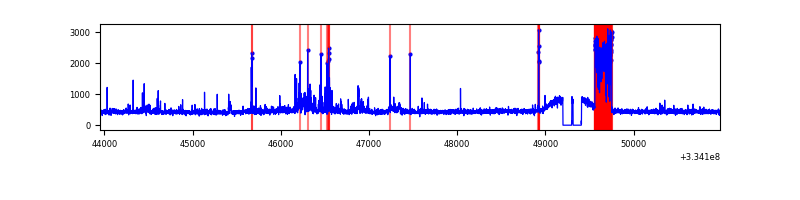 |
Top three noisy pixels from each quadrant. If the there are fewer than three noisy pixels in the level2.evt file, extra rows are filled as -1
| Pixel properties | Quadrant properties | ||||||
|---|---|---|---|---|---|---|---|
| Quadrant | DetID | PixID | Counts | Sigma | Mean | Median | Sigma |
| A | 13 | 254 | 11024 | 61.32 | 825 | 805 | 166.7 |
| A | 4 | 2 | 10777 | 59.84 | 825 | 805 | 166.7 |
| A | 3 | 137 | 7501 | 40.18 | 825 | 805 | 166.7 |
| B | 5 | 172 | 475424 | 3099.51 | 805 | 784 | 153.1 |
| B | 0 | 190 | 39927 | 255.61 | 805 | 784 | 153.1 |
| B | 12 | 111 | 18710 | 117.06 | 805 | 784 | 153.1 |
| C | 3 | 233 | 222507 | 1219.15 | 774 | 774 | 181.9 |
| C | 14 | 238 | 124212 | 678.7 | 774 | 774 | 181.9 |
| C | 2 | 16 | 6528 | 31.64 | 774 | 774 | 181.9 |
| D | 1 | 52 | 442917 | 2341.11 | 792 | 772 | 188.9 |
| D | 7 | 38 | 75217 | 394.18 | 792 | 772 | 188.9 |
| D | 12 | 233 | 47661 | 248.27 | 792 | 772 | 188.9 |
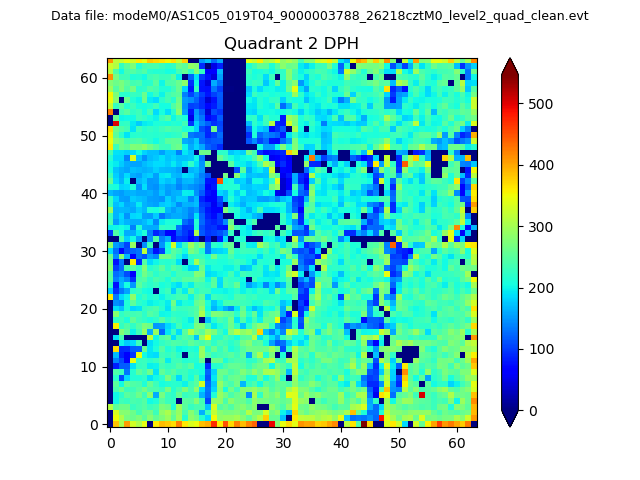
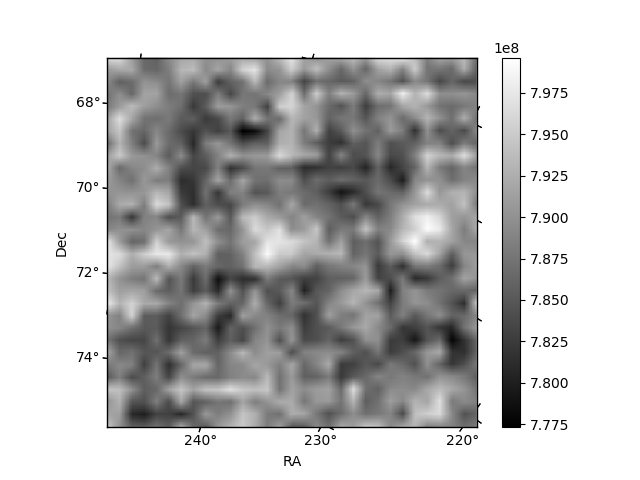
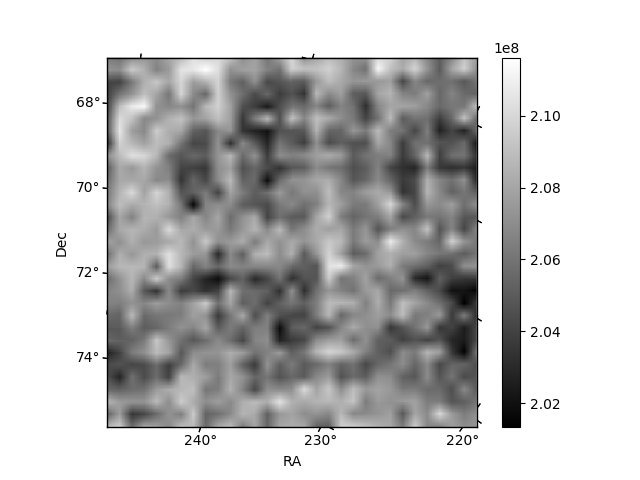
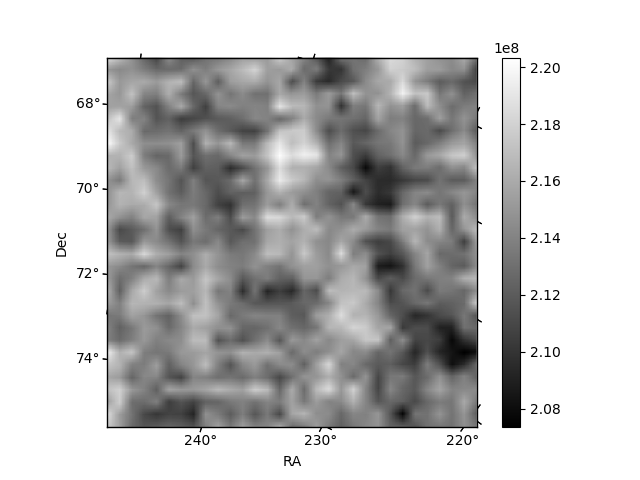
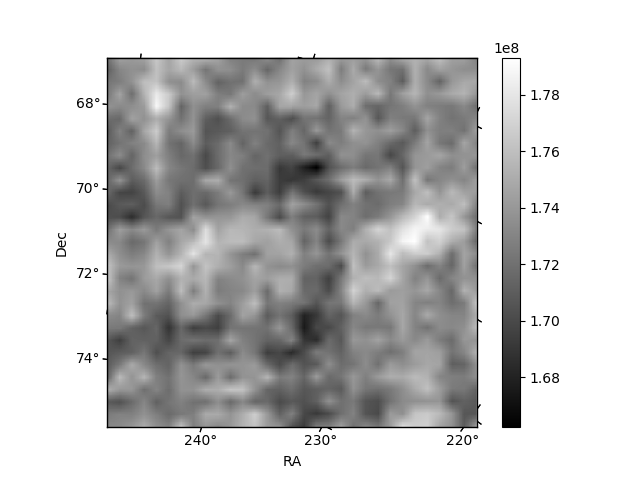
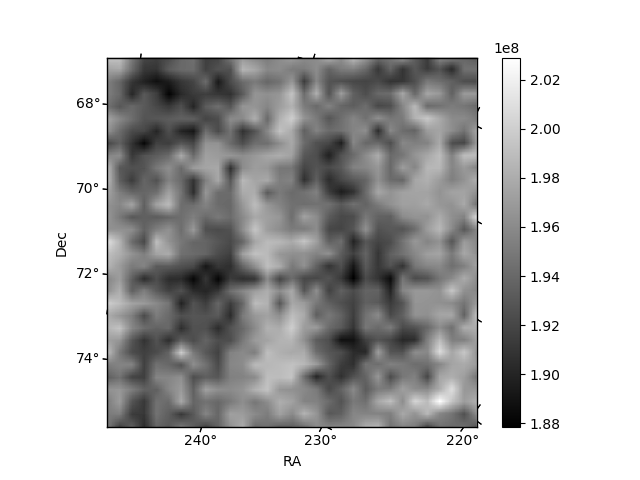
Histogram calculated using DETX and DETY for each event in the final _common_clean file
| Quadrant A | 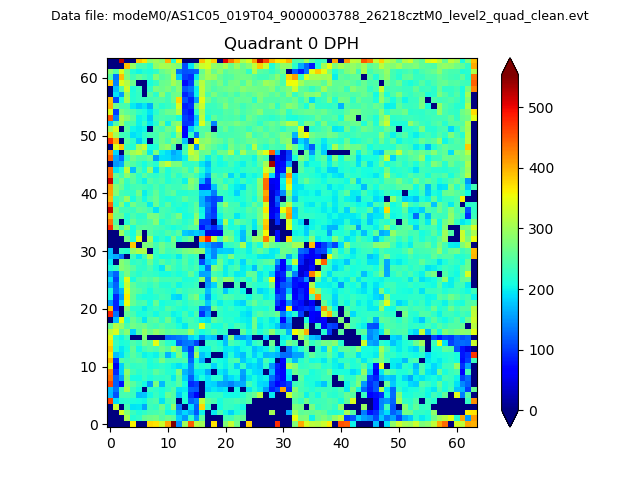 |
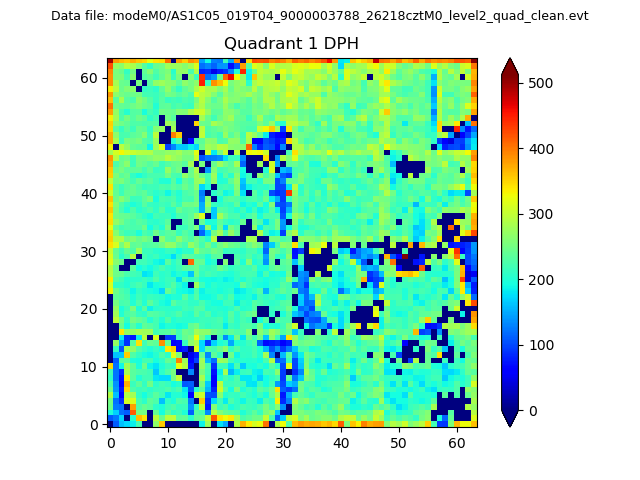 |
Quadrant B |
|---|---|---|---|
| Quadrant D | 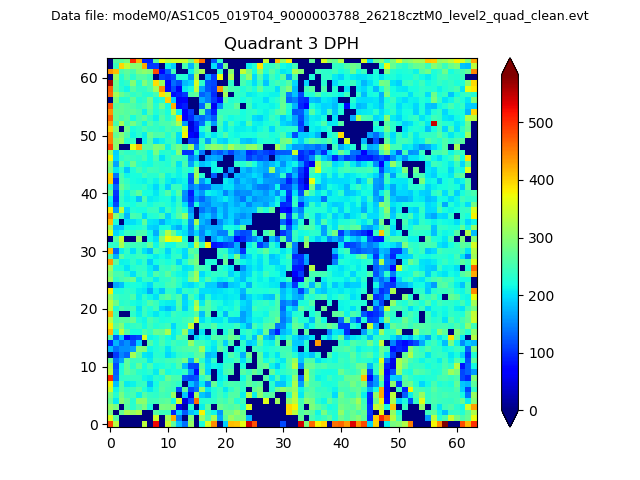 |
 |
Quadrant C |
| Plot type | Count rate plots | Images |
|---|---|---|
| Comparison with Poisson distribution Blue bars denote a histogram of data divided into 1 sec bins. Red curve is a Poisson curve with rate = median count rate of data. |
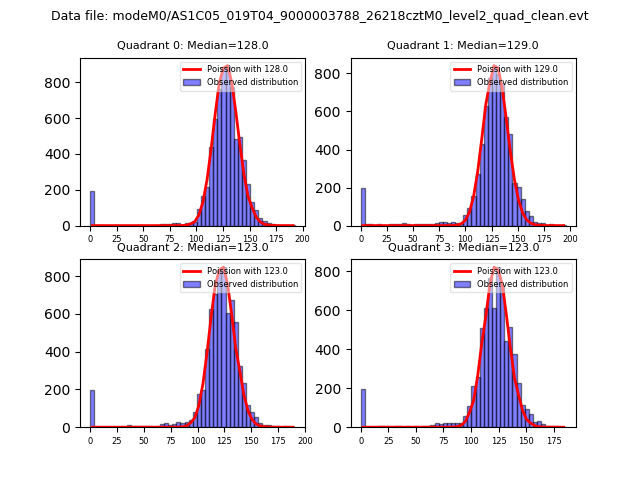 |
 |
| Quadrant-wise count rates Data is divided into 100 sec bins |
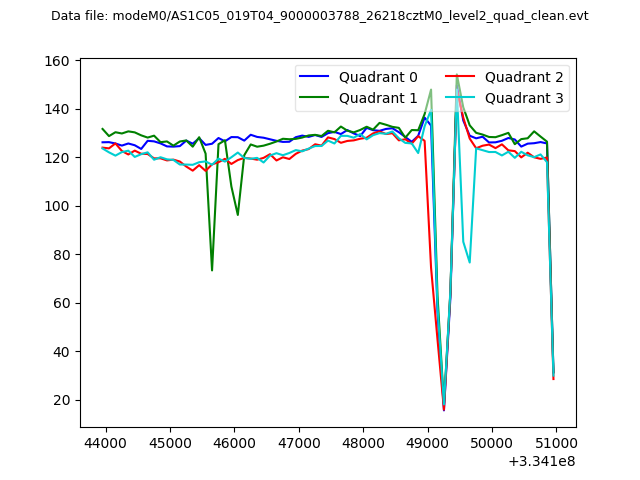 |
|
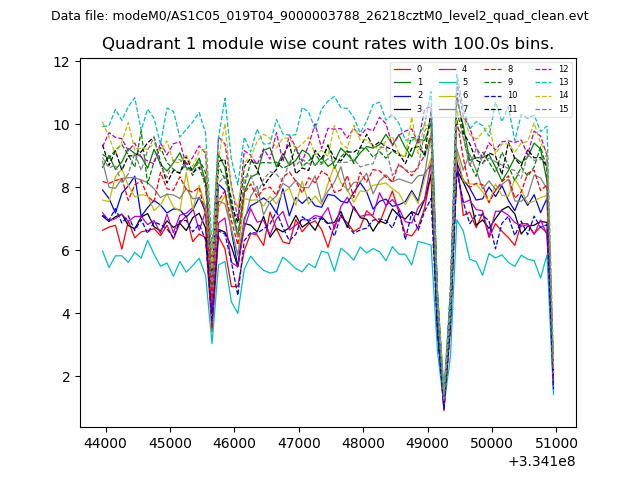
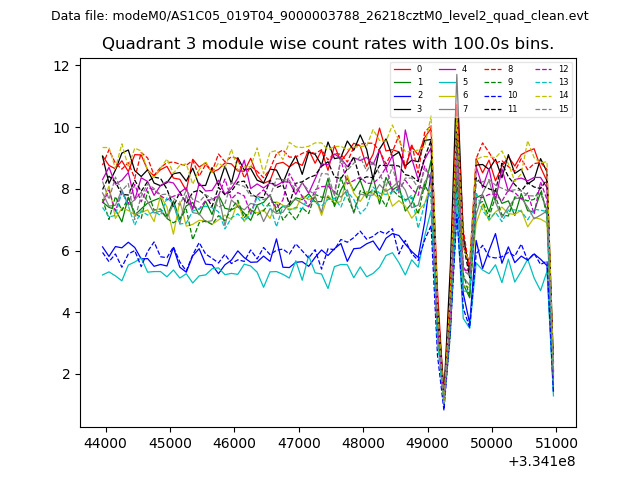
| Module-wise count rates for Quadrant A Data is divided into 100 sec bins |
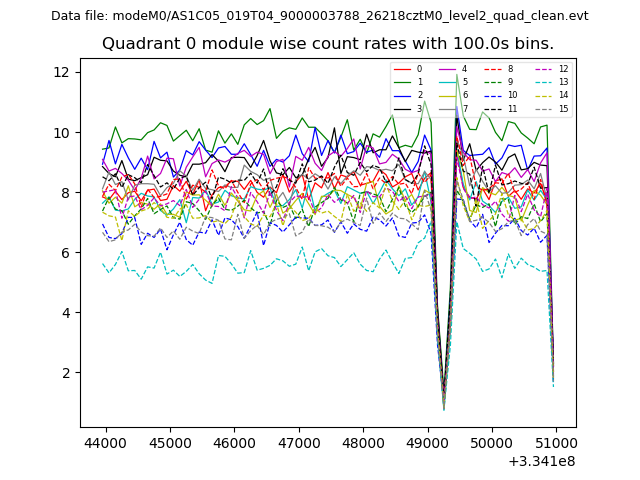 |
 |
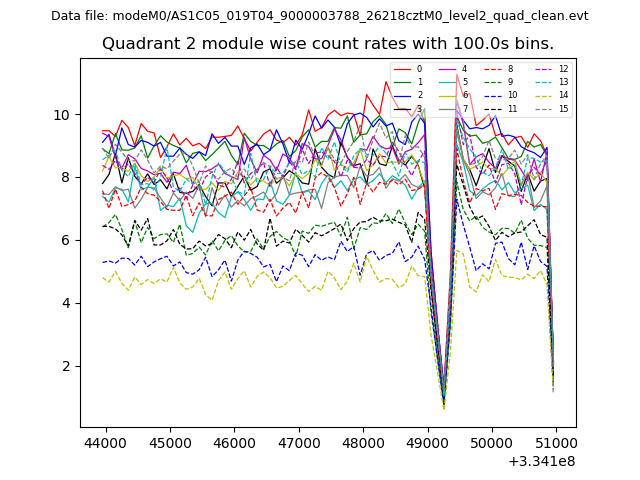
| Module-wise count rates for Quadrant B Data is divided into 100 sec bins |
 |
 |
| Module-wise count rates for Quadrant C Data is divided into 100 sec bins |
 |
 |
| Module-wise count rates for Quadrant D Data is divided into 100 sec bins |
 |
 |
| Parameter | Plot |
|---|---|
| CZT HV Monitor | 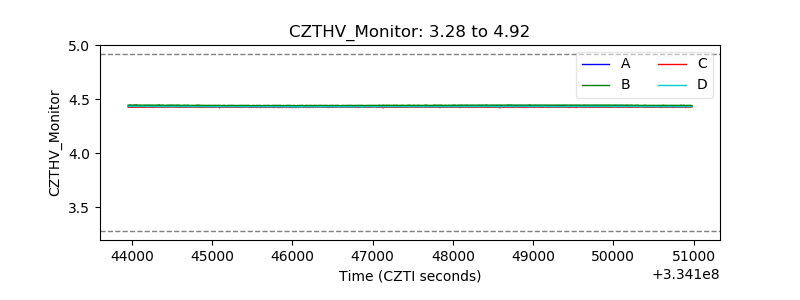 |
| D_VDD | 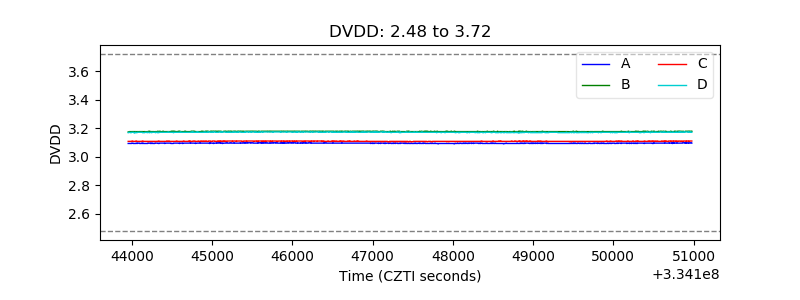 |
| Temperature 1 | 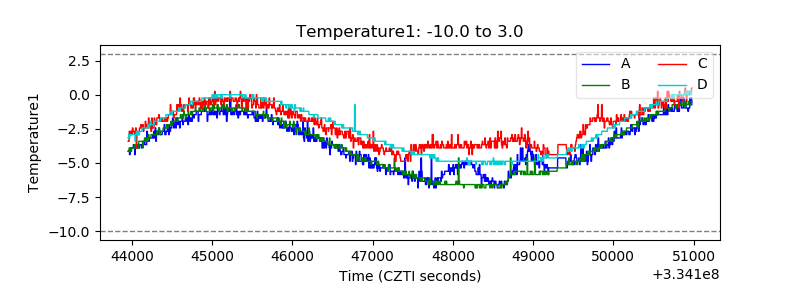 |
| Veto HV Monitor |  |
| Veto LLD | 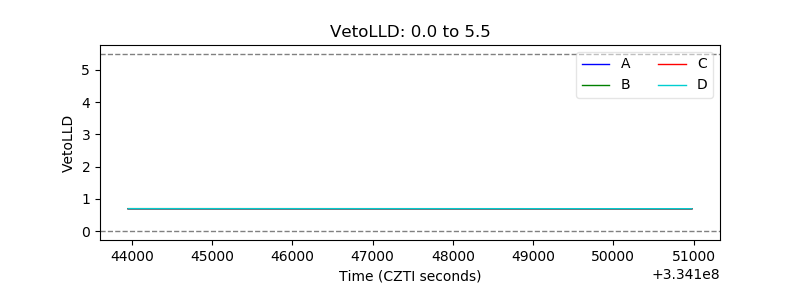 |
| Alpha Counter | 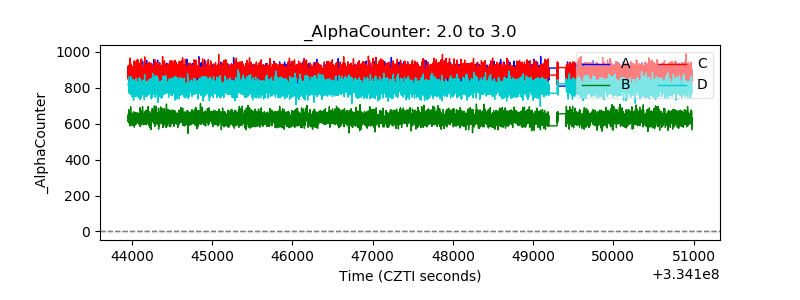 |
| _CPM_Rate |  |
| CZT Counter | 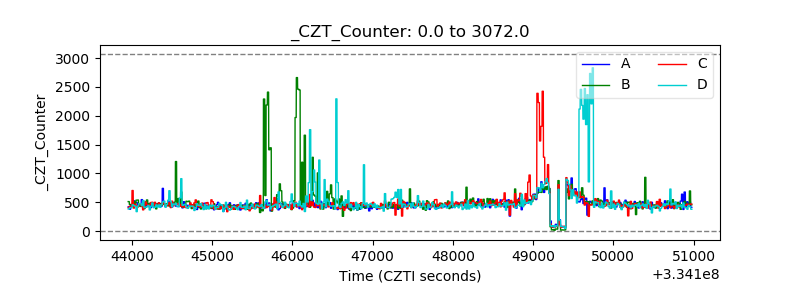 |
| +2.5 Volts monitor | 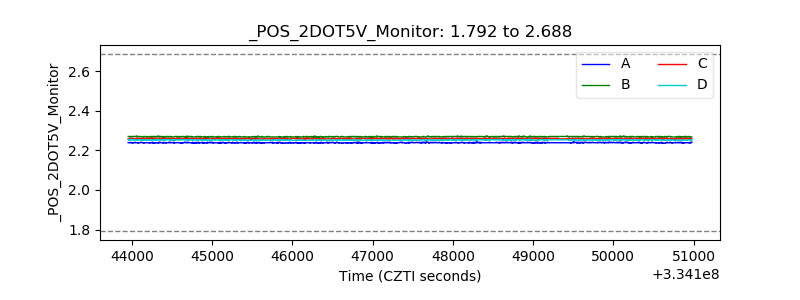 |
| +5 Volts monitor |  |
| _ROLL_ROT | 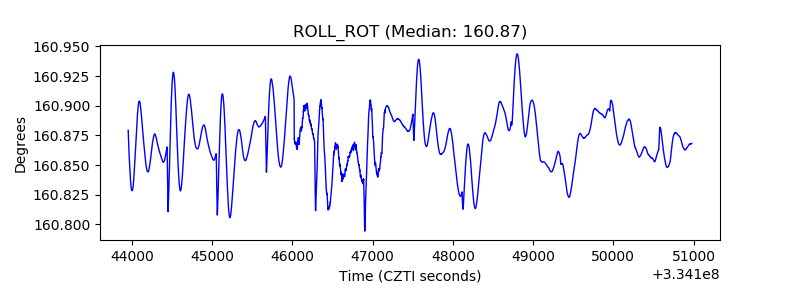 |
| _Roll_DEC | 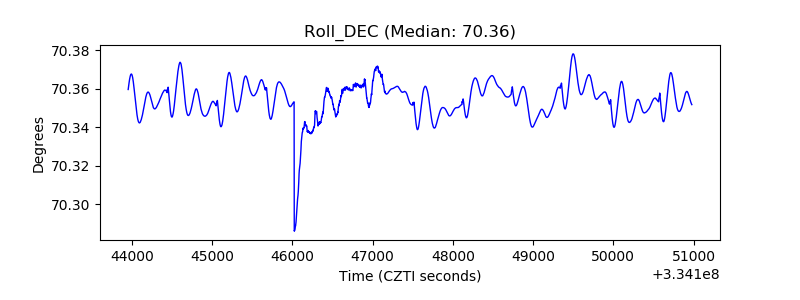 |
| _Roll_RA | 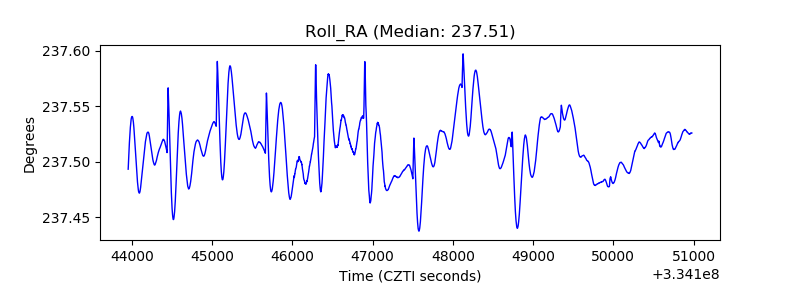 |
| Veto Counter | 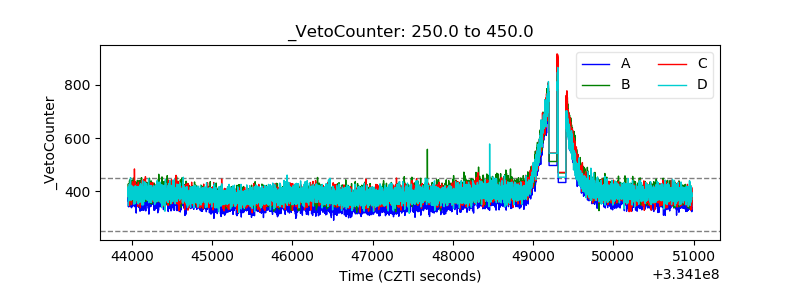 |