| Param | Original file | Final file |
|---|---|---|
| Filename | modeM0/AS1C05_019T04_9000003788_26219cztM0_level2.evt | modeM0/AS1C05_019T04_9000003788_26219cztM0_level2_quad_clean.evt |
| Size (bytes) | 514,290,240 | 143,360,640 |
| Size | 490.5 MB | 136.7 MB |
| Events in quadrant A | 3,576,870 | 970,090 |
| Events in quadrant B | 3,739,259 | 981,482 |
| Events in quadrant C | 3,576,770 | 937,044 |
| Events in quadrant D | 4,163,066 | 921,800 |
| Mode M9 | |||
|---|---|---|---|
| Quadrant | BADHDUFLAG | Total packets | Discarded packets |
| A | 0 | 2 | 0 |
| B | 0 | 2 | 0 |
| C | 0 | 2 | 0 |
| D | 0 | 2 | 0 |
| Mode M0 | |||
|---|---|---|---|
| Quadrant | BADHDUFLAG | Total packets | Discarded packets |
| A | 0 | 15693 | 0 |
| B | 0 | 16105 | 0 |
| C | 0 | 15674 | 0 |
| D | 0 | 17590 | 0 |
| Quadrant | Total seconds | Saturated seconds | Saturation percentage |
|---|---|---|---|
| A | 7643 | 166 | 2.171922% |
| B | 7644 | 207 | 2.708006% |
| C | 7644 | 210 | 2.747253% |
| D | 7644 | 344 | 4.500262% |
Noise dominated data is calculated using 1-second bins in cleaned event files. If a bin has >2000 counts, and if more than 50% of those come from <1% of pixels, then it is considered to be noise-dominated and hence unusable.
| Quadrant | # 1 sec bins | Bins with >0 counts | Bins with >2000 counts | High rate bins dominated by noise | Noise dominated (total time) | Noise dominated (detector-on time) | Marked lightcurve |
|---|---|---|---|---|---|---|---|
| A | 7823 | 7645 | 0 | 0 | 0.00% | 0.00% | 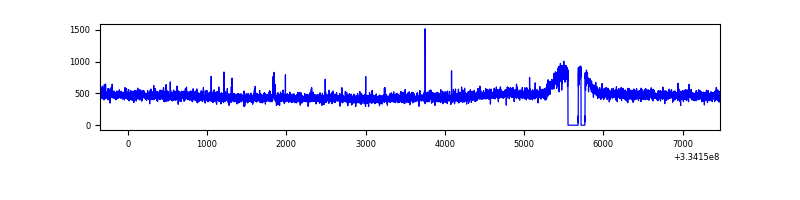 |
| B | 7824 | 7646 | 24 | 24 | 0.31% | 0.31% | 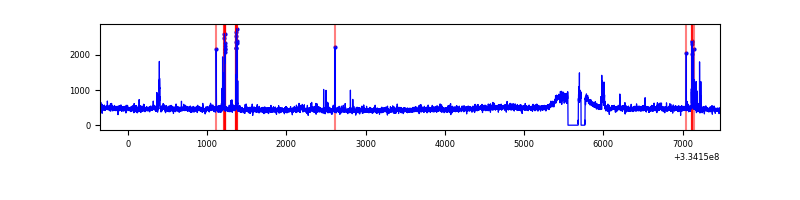 |
| C | 7824 | 7646 | 0 | 0 | 0.00% | 0.00% | 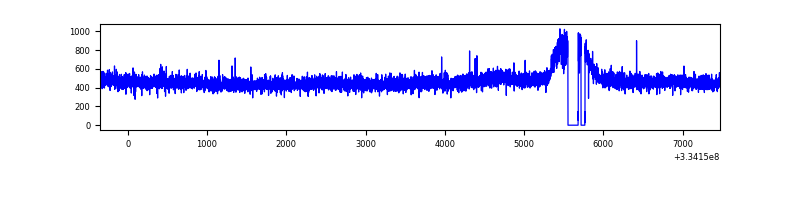 |
| D | 7824 | 7646 | 161 | 161 | 2.06% | 2.11% | 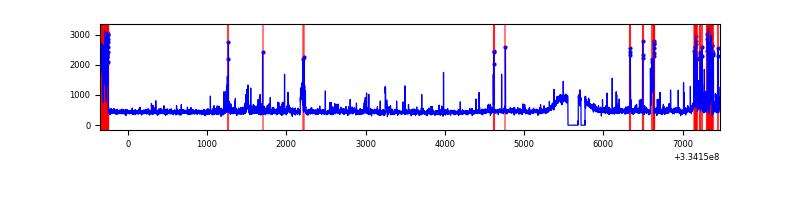 |
Top three noisy pixels from each quadrant. If the there are fewer than three noisy pixels in the level2.evt file, extra rows are filled as -1
| Pixel properties | Quadrant properties | ||||||
|---|---|---|---|---|---|---|---|
| Quadrant | DetID | PixID | Counts | Sigma | Mean | Median | Sigma |
| A | 13 | 254 | 12287 | 60.88 | 923 | 902 | 187.0 |
| A | 0 | 13 | 9186 | 44.3 | 923 | 902 | 187.0 |
| A | 3 | 137 | 8408 | 40.14 | 923 | 902 | 187.0 |
| B | 5 | 172 | 110982 | 626.51 | 912 | 887 | 175.7 |
| B | 0 | 190 | 34477 | 191.15 | 912 | 887 | 175.7 |
| B | 0 | 230 | 27835 | 153.35 | 912 | 887 | 175.7 |
| C | 14 | 238 | 139225 | 671.07 | 879 | 884 | 206.2 |
| C | 3 | 233 | 11028 | 49.21 | 879 | 884 | 206.2 |
| C | 13 | 61 | 5954 | 24.59 | 879 | 884 | 206.2 |
| D | 1 | 52 | 555083 | 2596.37 | 889 | 865 | 213.5 |
| D | 7 | 38 | 126562 | 588.86 | 889 | 865 | 213.5 |
| D | 13 | 174 | 54262 | 250.15 | 889 | 865 | 213.5 |
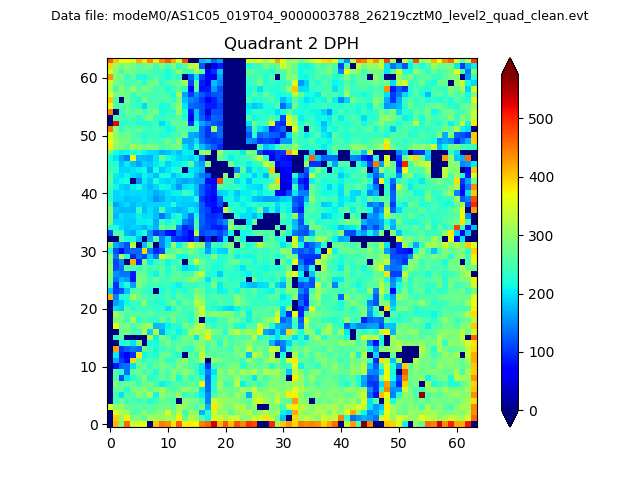
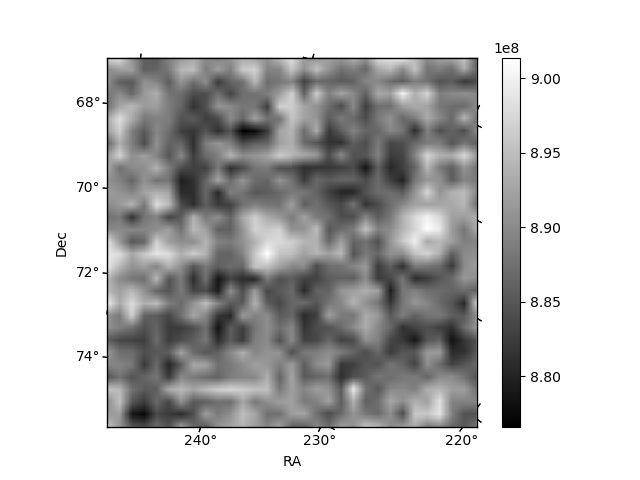
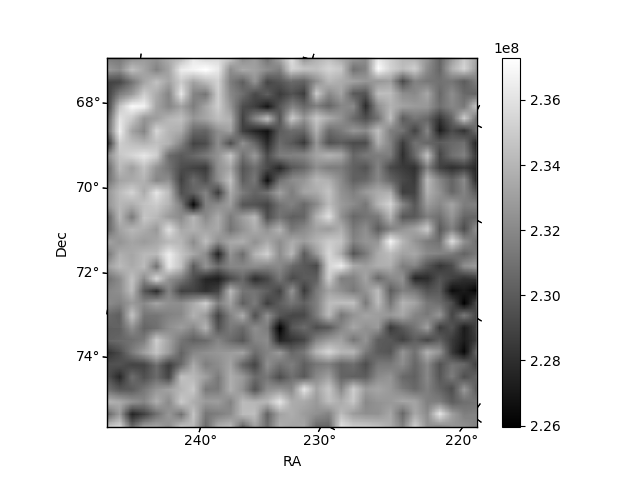
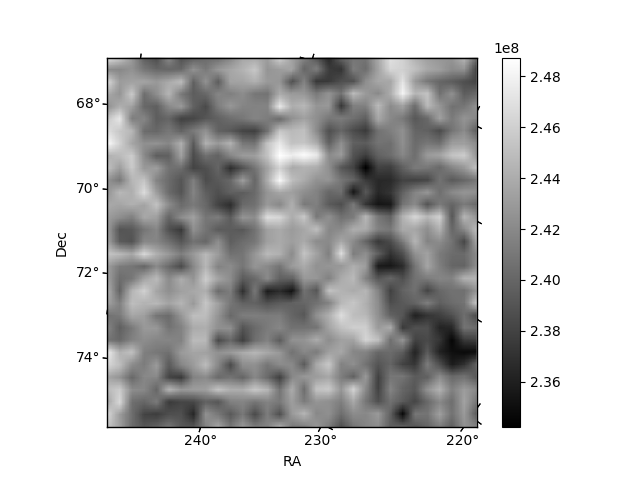
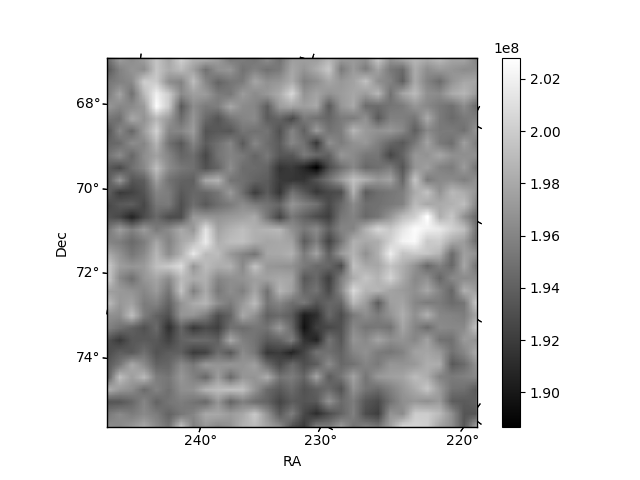
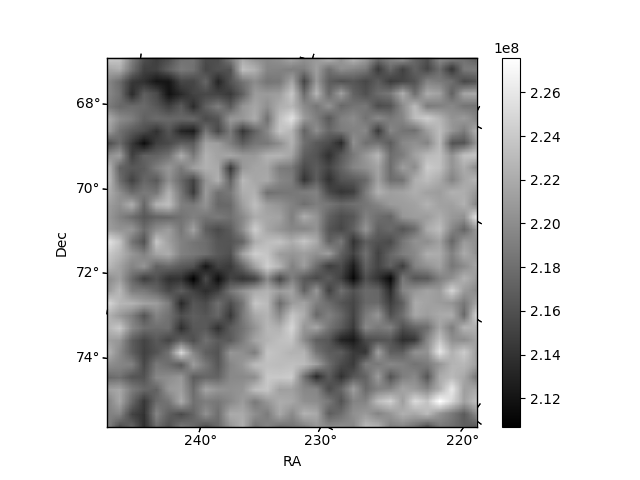
Histogram calculated using DETX and DETY for each event in the final _common_clean file
| Quadrant A | 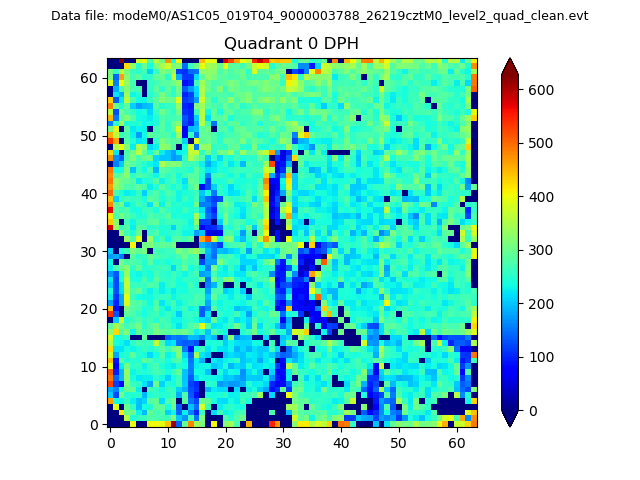 |
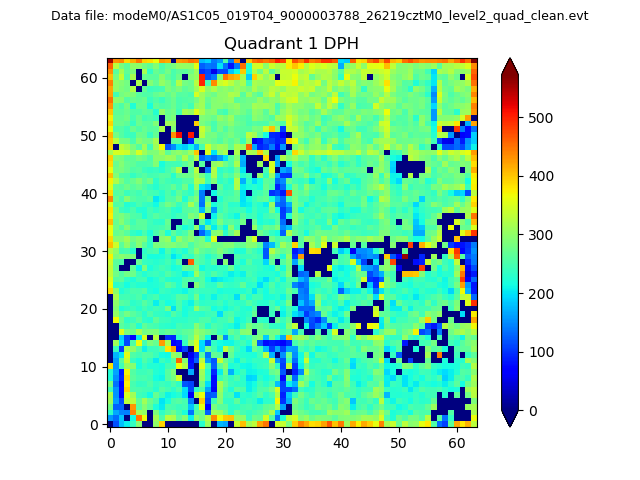 |
Quadrant B |
|---|---|---|---|
| Quadrant D | 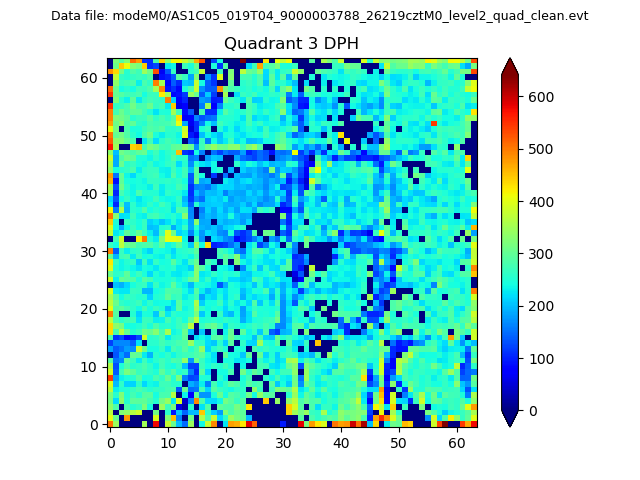 |
 |
Quadrant C |
| Plot type | Count rate plots | Images |
|---|---|---|
| Comparison with Poisson distribution Blue bars denote a histogram of data divided into 1 sec bins. Red curve is a Poisson curve with rate = median count rate of data. |
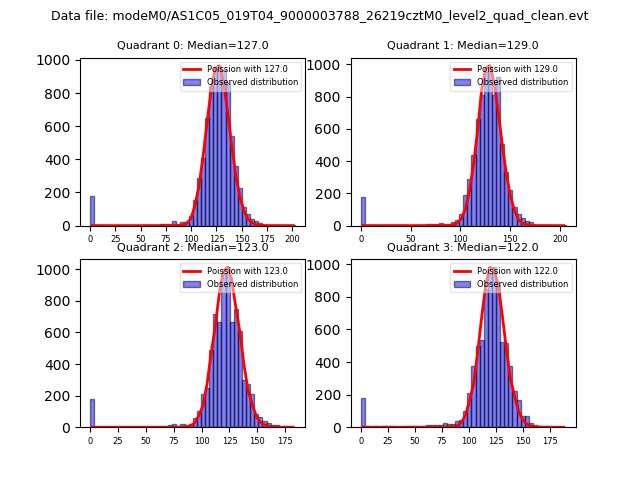 |
 |
| Quadrant-wise count rates Data is divided into 100 sec bins |
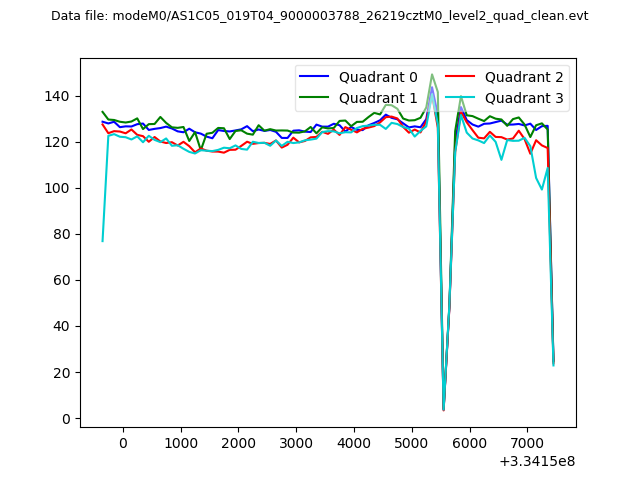 |
|
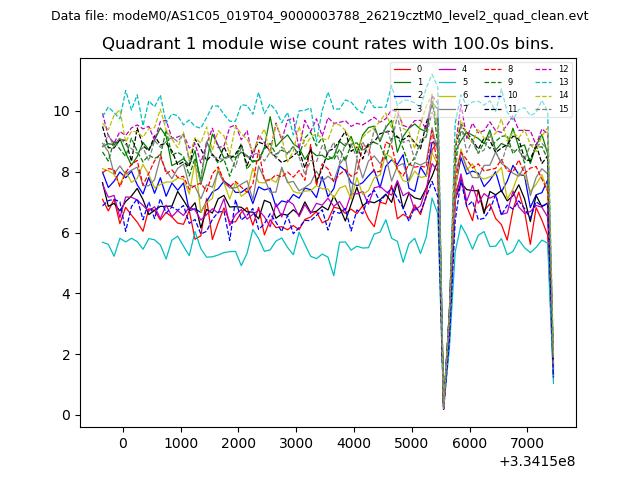
| Module-wise count rates for Quadrant A Data is divided into 100 sec bins |
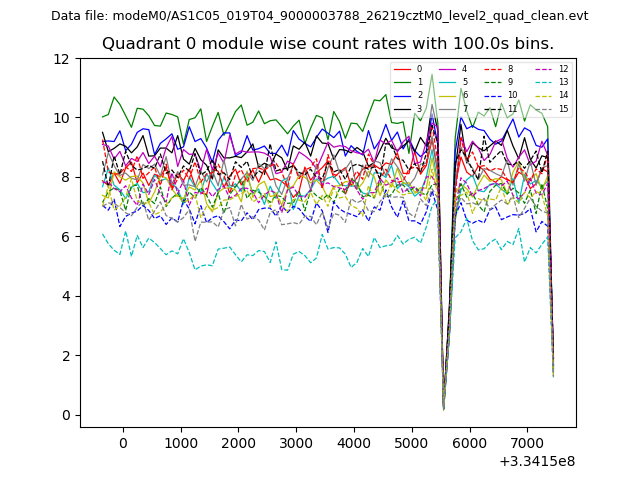 |
 |
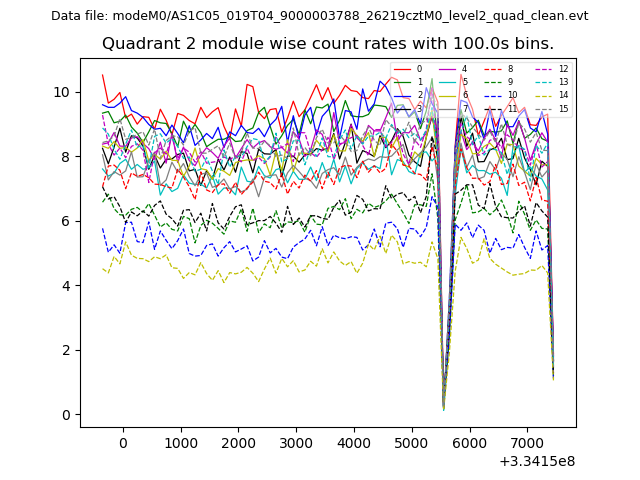
| Module-wise count rates for Quadrant B Data is divided into 100 sec bins |
 |
 |
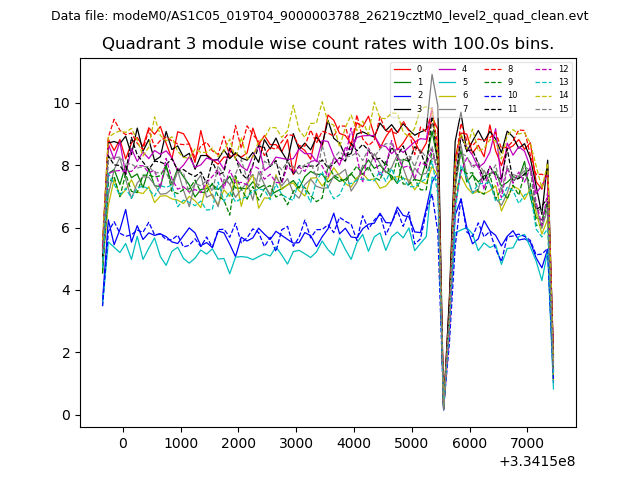
| Module-wise count rates for Quadrant C Data is divided into 100 sec bins |
 |
 |
| Module-wise count rates for Quadrant D Data is divided into 100 sec bins |
 |
 |
| Parameter | Plot |
|---|---|
| CZT HV Monitor | 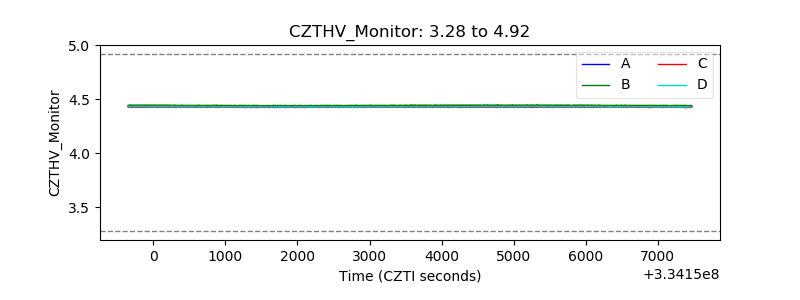 |
| D_VDD | 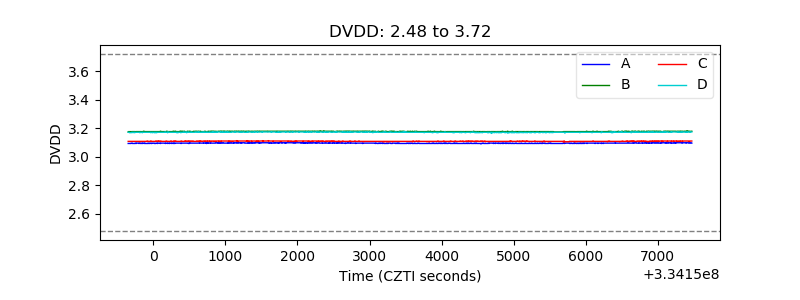 |
| Temperature 1 | 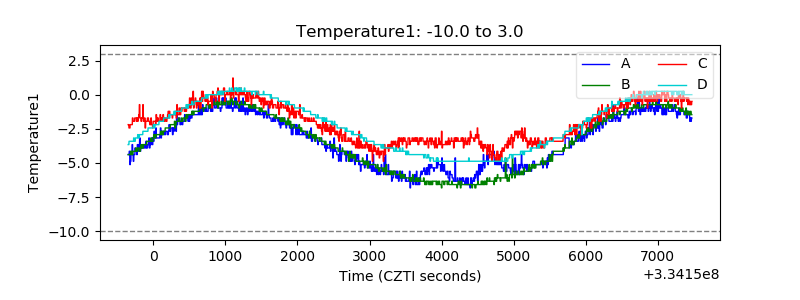 |
| Veto HV Monitor | 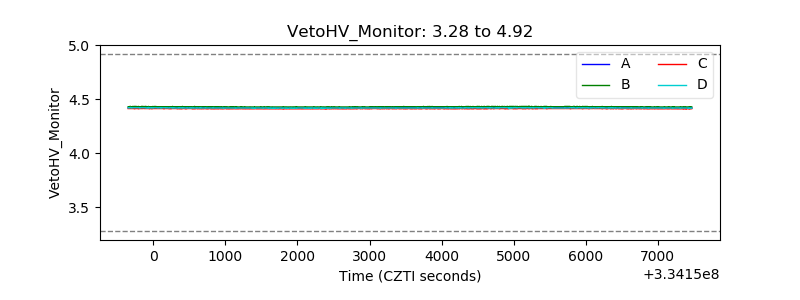 |
| Veto LLD | 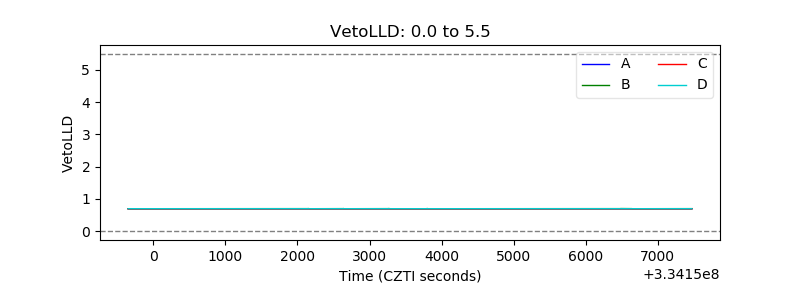 |
| Alpha Counter | 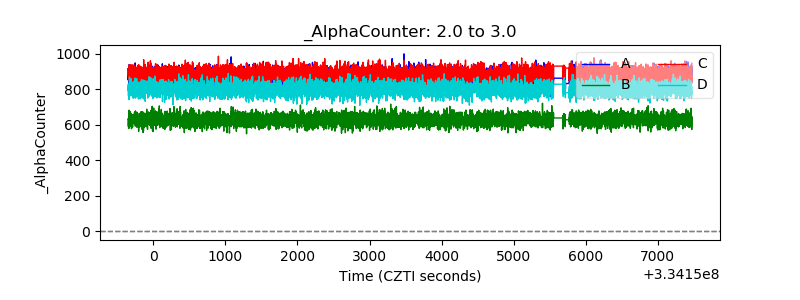 |
| _CPM_Rate | 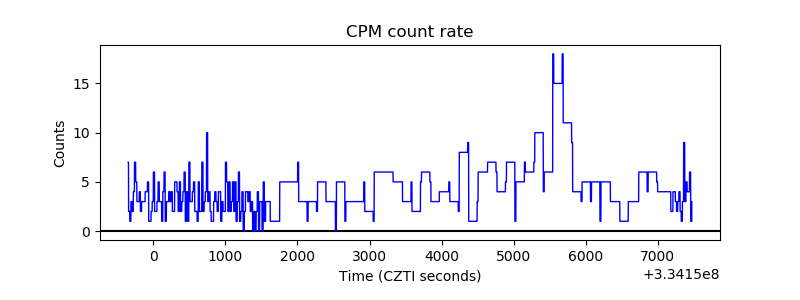 |
| CZT Counter | 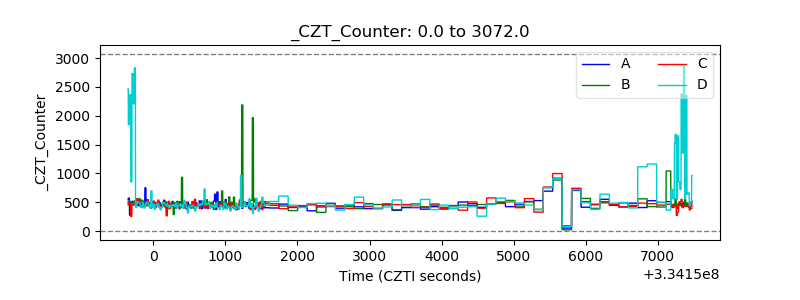 |
| +2.5 Volts monitor | 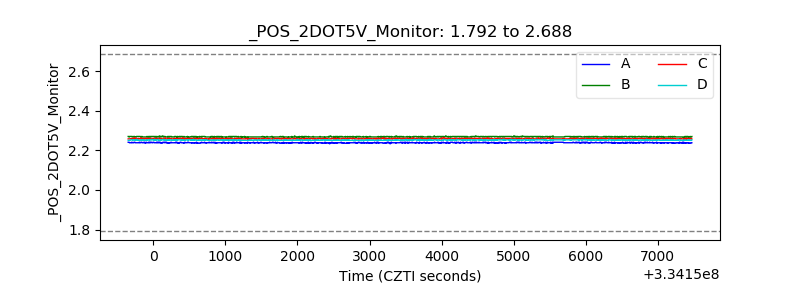 |
| +5 Volts monitor |  |
| _ROLL_ROT | 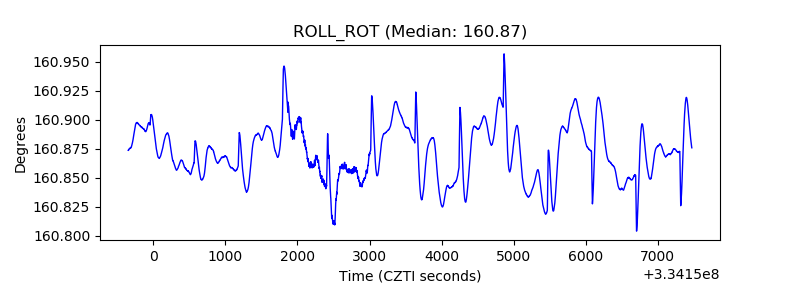 |
| _Roll_DEC | 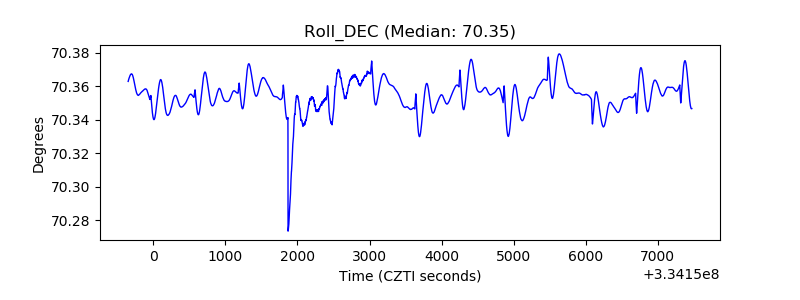 |
| _Roll_RA | 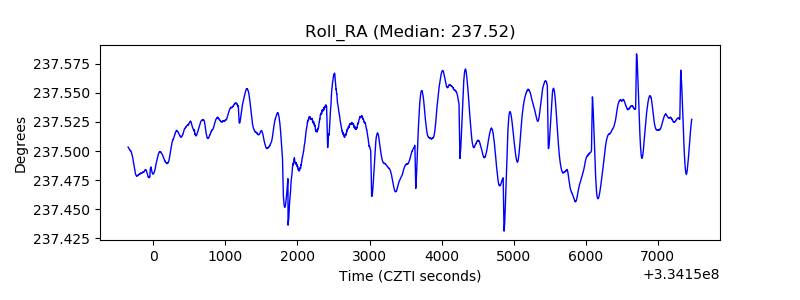 |
| Veto Counter | 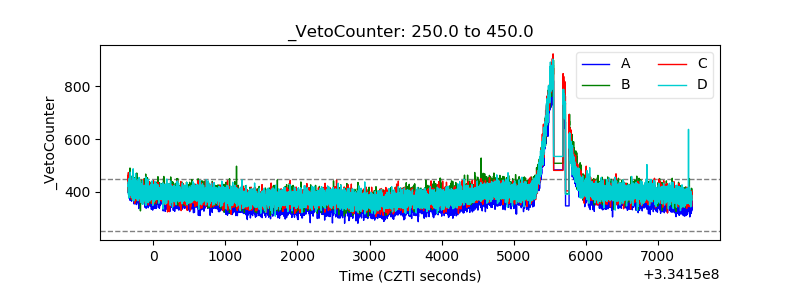 |