| Param | Original file | Final file |
|---|---|---|
| Filename | modeM0/AS1C05_019T04_9000003788_26222cztM0_level2.evt | modeM0/AS1C05_019T04_9000003788_26222cztM0_level2_quad_clean.evt |
| Size (bytes) | 1,303,845,120 | 339,534,720 |
| Size | 1.2 GB | 323.8 MB |
| Events in quadrant A | 8,336,199 | 2,306,714 |
| Events in quadrant B | 8,660,164 | 2,317,067 |
| Events in quadrant C | 10,178,156 | 2,217,556 |
| Events in quadrant D | 11,079,808 | 2,186,576 |
| Mode M9 | |||
|---|---|---|---|
| Quadrant | BADHDUFLAG | Total packets | Discarded packets |
| A | 0 | 19 | 0 |
| B | 0 | 19 | 0 |
| C | 0 | 19 | 0 |
| D | 0 | 19 | 0 |
| Mode M0 | |||
|---|---|---|---|
| Quadrant | BADHDUFLAG | Total packets | Discarded packets |
| A | 0 | 37050 | 0 |
| B | 0 | 37900 | 0 |
| C | 0 | 42190 | 0 |
| D | 0 | 45365 | 0 |
| Quadrant | Total seconds | Saturated seconds | Saturation percentage |
|---|---|---|---|
| A | 18239 | 111 | 0.608586% |
| B | 18240 | 180 | 0.986842% |
| C | 18240 | 408 | 2.236842% |
| D | 18240 | 610 | 3.344298% |
Noise dominated data is calculated using 1-second bins in cleaned event files. If a bin has >2000 counts, and if more than 50% of those come from <1% of pixels, then it is considered to be noise-dominated and hence unusable.
| Quadrant | # 1 sec bins | Bins with >0 counts | Bins with >2000 counts | High rate bins dominated by noise | Noise dominated (total time) | Noise dominated (detector-on time) | Marked lightcurve |
|---|---|---|---|---|---|---|---|
| A | 20099 | 18242 | 0 | 0 | 0.00% | 0.00% | 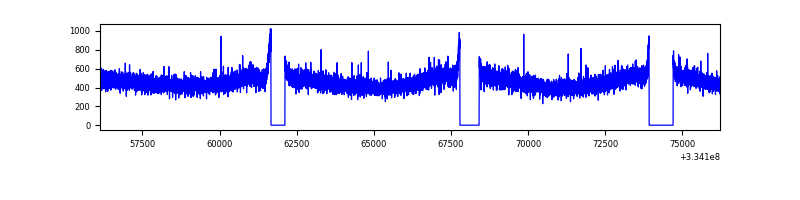 |
| B | 20100 | 18243 | 30 | 30 | 0.15% | 0.16% | 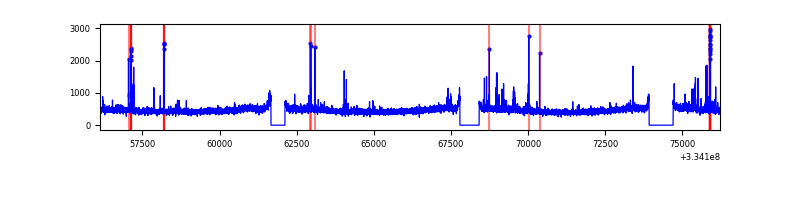 |
| C | 20100 | 18243 | 77 | 77 | 0.38% | 0.42% | 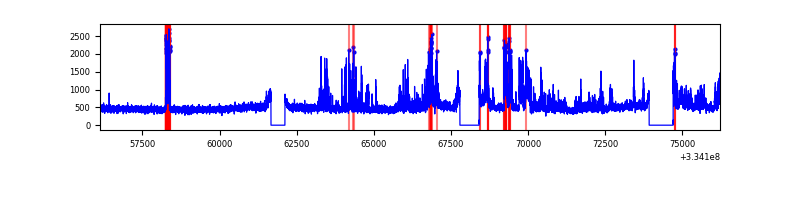 |
| D | 20100 | 18243 | 414 | 414 | 2.06% | 2.27% | 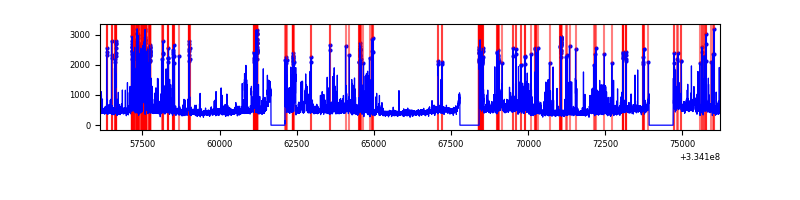 |
Top three noisy pixels from each quadrant. If the there are fewer than three noisy pixels in the level2.evt file, extra rows are filled as -1
| Pixel properties | Quadrant properties | ||||||
|---|---|---|---|---|---|---|---|
| Quadrant | DetID | PixID | Counts | Sigma | Mean | Median | Sigma |
| A | 13 | 254 | 30743 | 66.62 | 2154 | 2106 | 429.8 |
| A | 0 | 13 | 28432 | 61.25 | 2154 | 2106 | 429.8 |
| A | 3 | 137 | 19924 | 41.45 | 2154 | 2106 | 429.8 |
| B | 5 | 172 | 181337 | 443.15 | 2140 | 2082 | 404.5 |
| B | 0 | 190 | 97738 | 236.48 | 2140 | 2082 | 404.5 |
| B | 12 | 111 | 48732 | 115.33 | 2140 | 2082 | 404.5 |
| C | 3 | 233 | 1768768 | 3672.82 | 2063 | 2071 | 481.0 |
| C | 14 | 238 | 326246 | 673.93 | 2063 | 2071 | 481.0 |
| C | 2 | 16 | 45651 | 90.6 | 2063 | 2071 | 481.0 |
| D | 1 | 52 | 1749979 | 3534.81 | 2073 | 2020 | 494.5 |
| D | 7 | 38 | 451364 | 908.69 | 2073 | 2020 | 494.5 |
| D | 13 | 174 | 280262 | 562.67 | 2073 | 2020 | 494.5 |
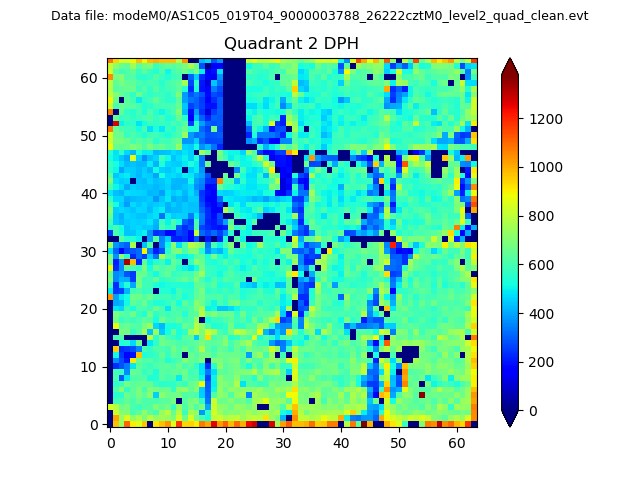
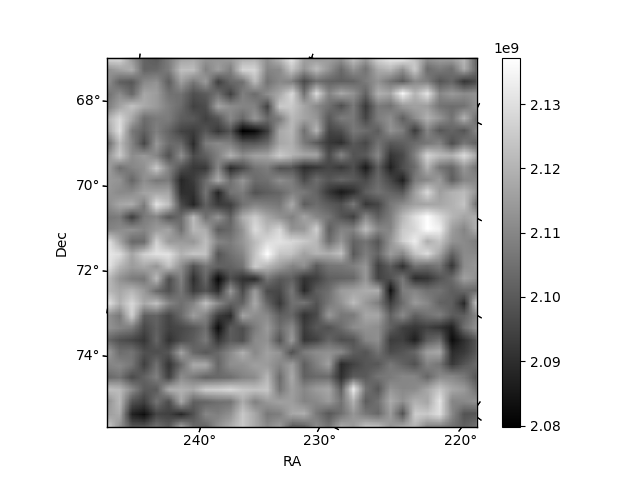
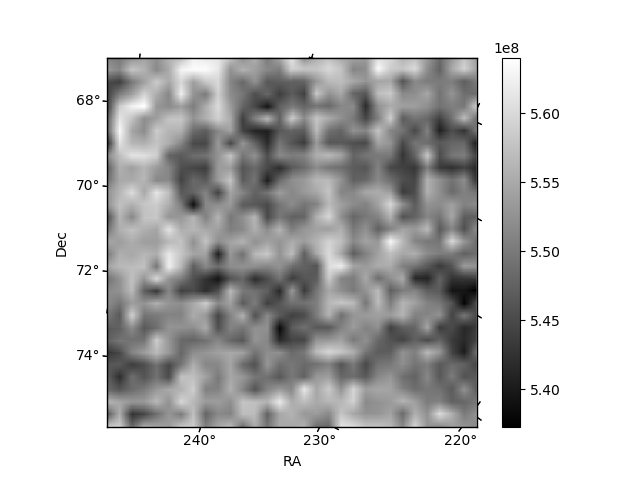
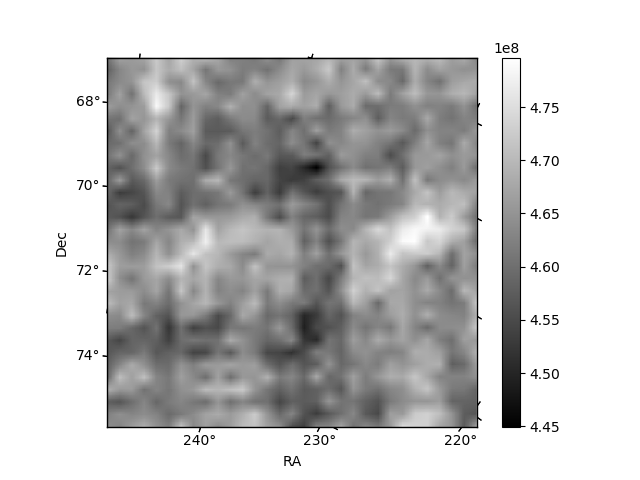
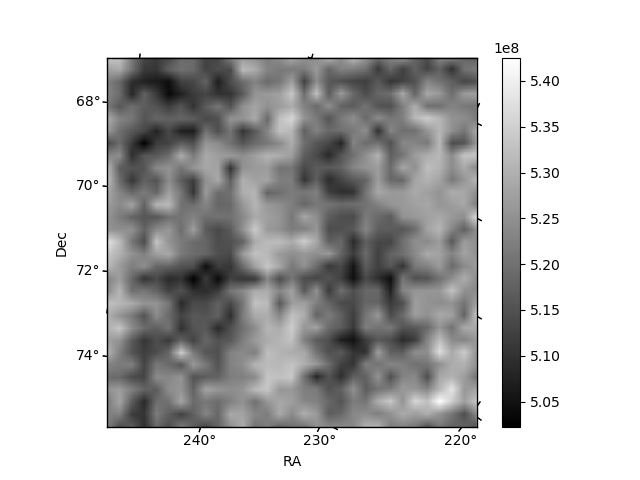
Histogram calculated using DETX and DETY for each event in the final _common_clean file
| Quadrant A | 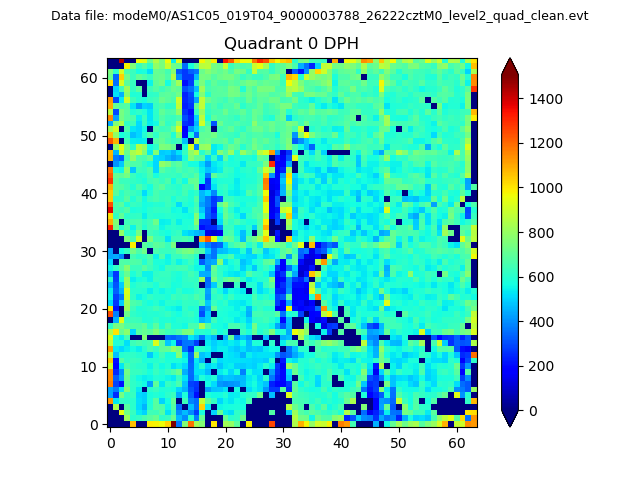 |
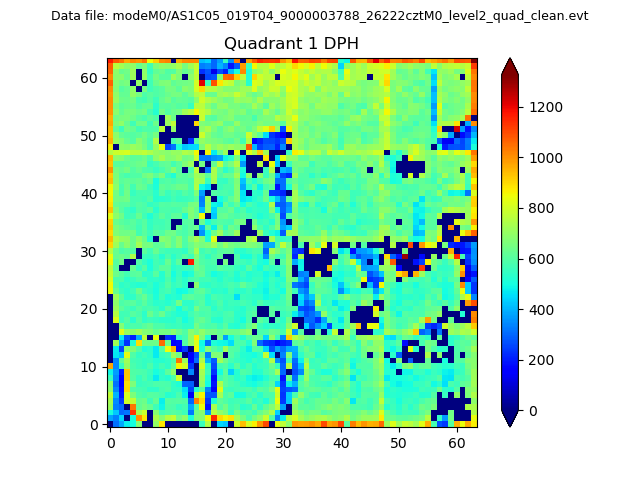 |
Quadrant B |
|---|---|---|---|
| Quadrant D | 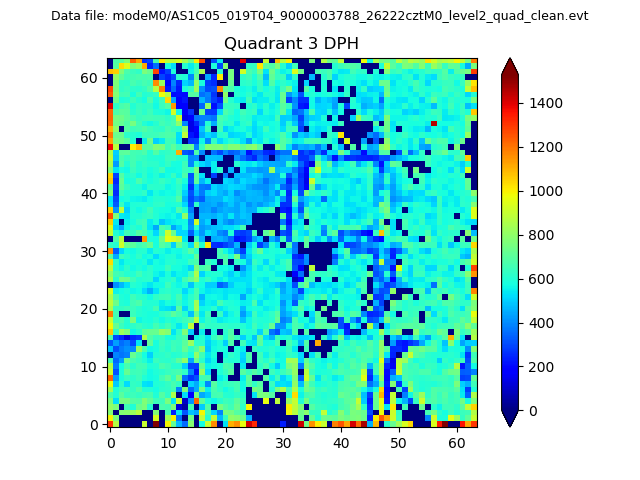 |
 |
Quadrant C |
| Plot type | Count rate plots | Images |
|---|---|---|
| Comparison with Poisson distribution Blue bars denote a histogram of data divided into 1 sec bins. Red curve is a Poisson curve with rate = median count rate of data. |
 |
 |
| Quadrant-wise count rates Data is divided into 100 sec bins |
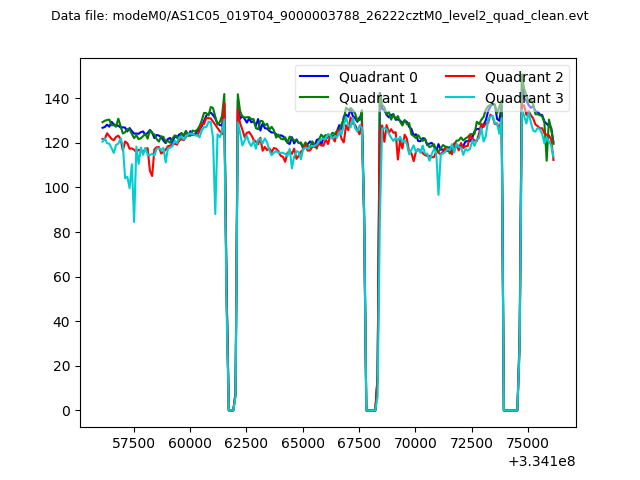 |
|
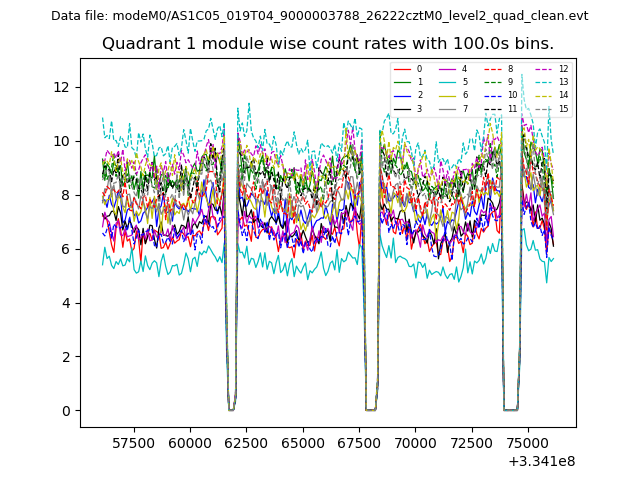
| Module-wise count rates for Quadrant A Data is divided into 100 sec bins |
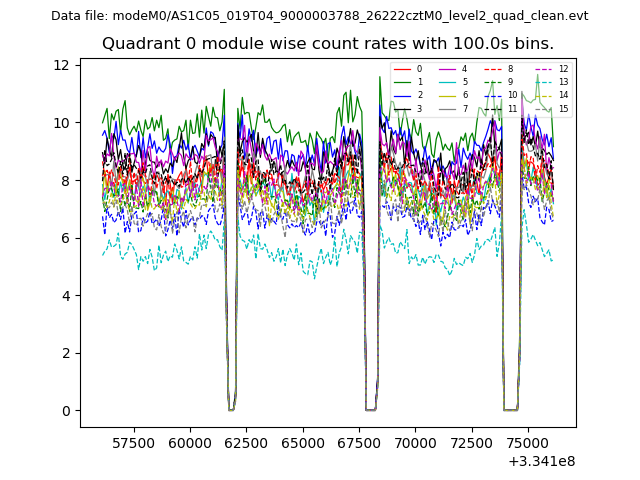 |
 |
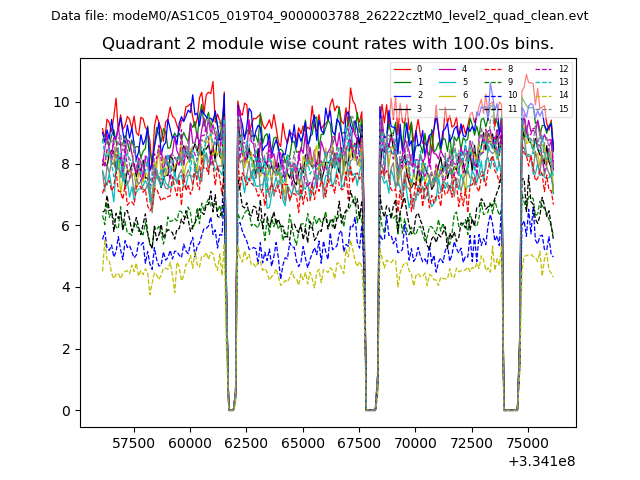
| Module-wise count rates for Quadrant B Data is divided into 100 sec bins |
 |
 |
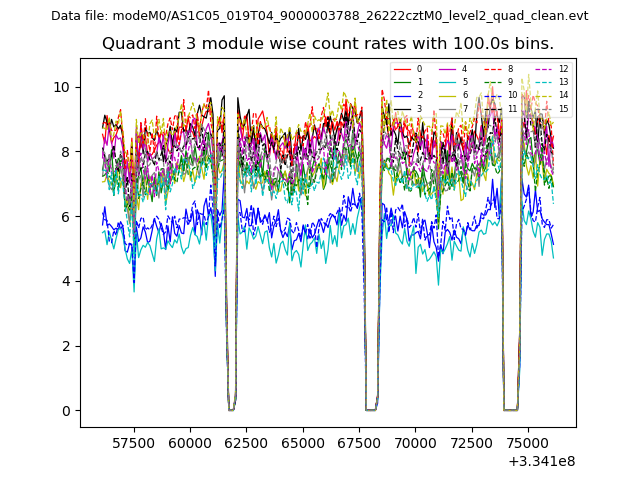
| Module-wise count rates for Quadrant C Data is divided into 100 sec bins |
 |
 |
| Module-wise count rates for Quadrant D Data is divided into 100 sec bins |
 |
 |
| Parameter | Plot |
|---|---|
| CZT HV Monitor | 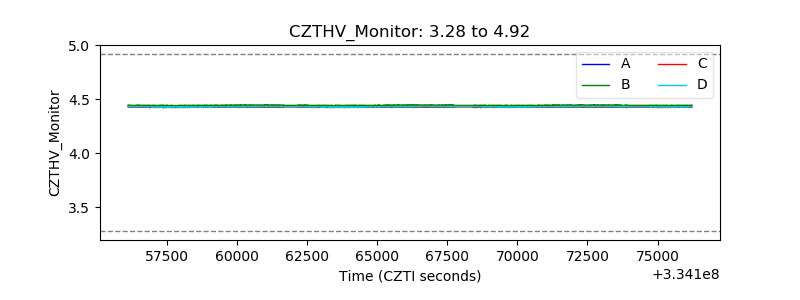 |
| D_VDD | 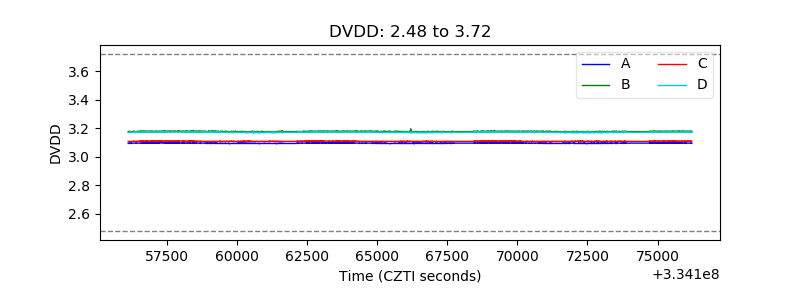 |
| Temperature 1 | 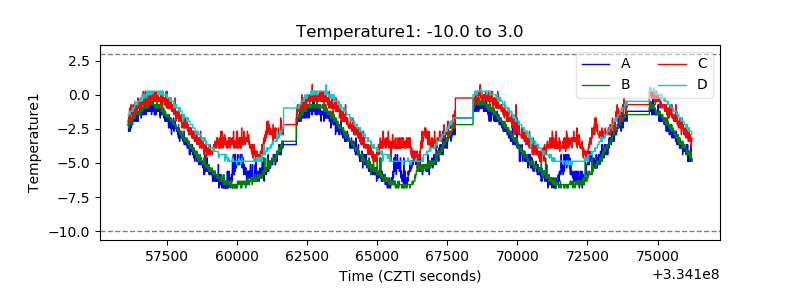 |
| Veto HV Monitor | 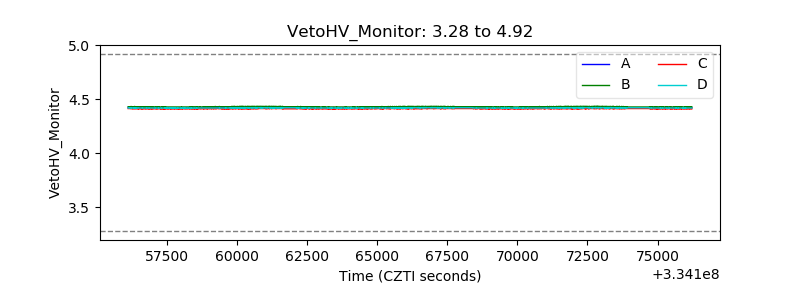 |
| Veto LLD | 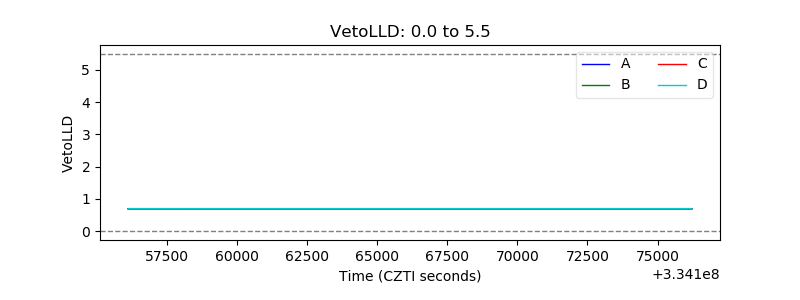 |
| Alpha Counter | 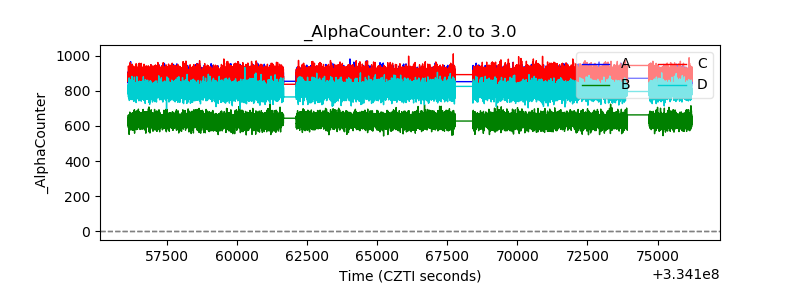 |
| _CPM_Rate | 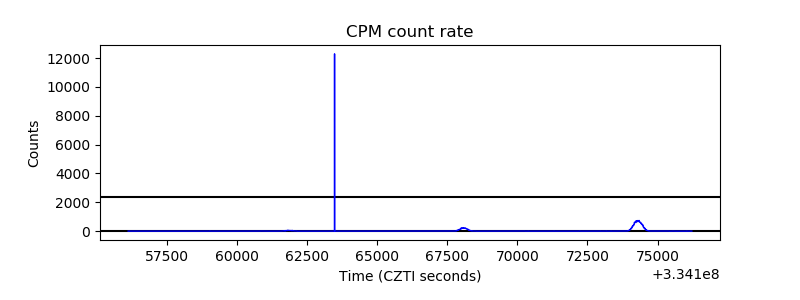 |
| CZT Counter | 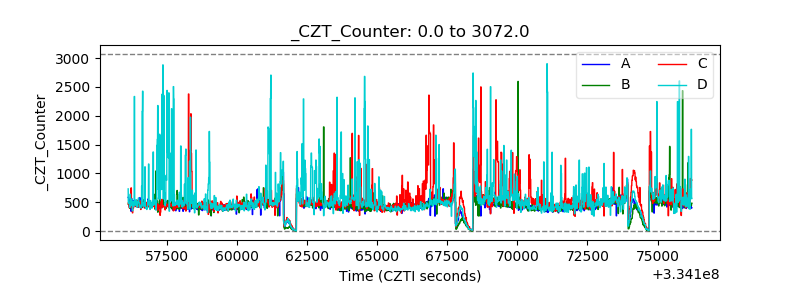 |
| +2.5 Volts monitor |  |
| +5 Volts monitor | 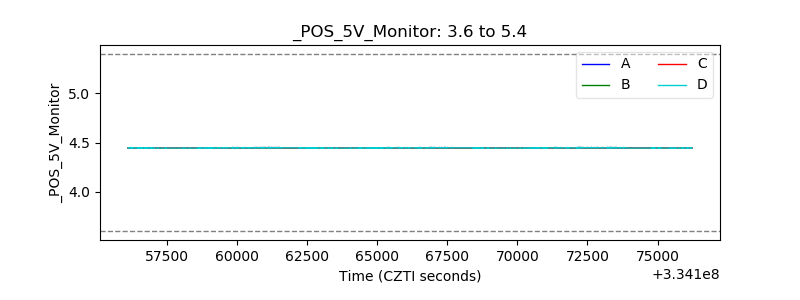 |
| _ROLL_ROT | 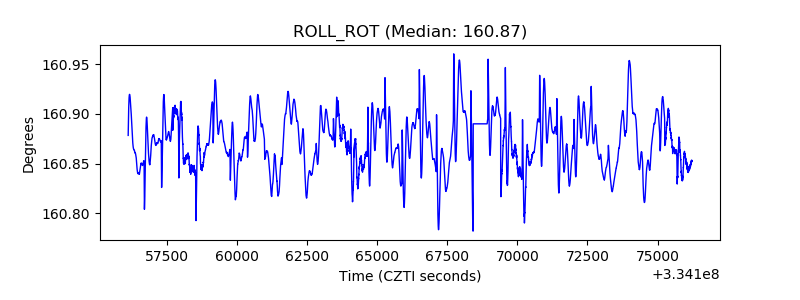 |
| _Roll_DEC | 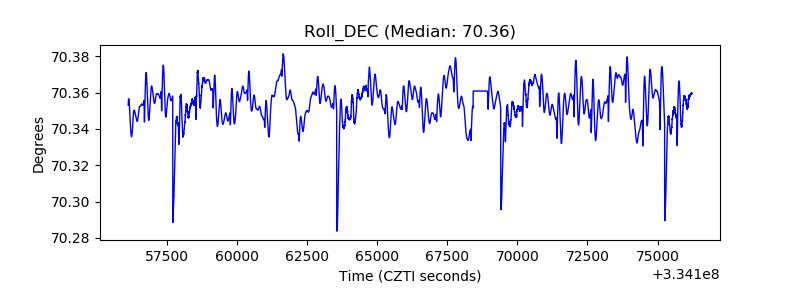 |
| _Roll_RA | 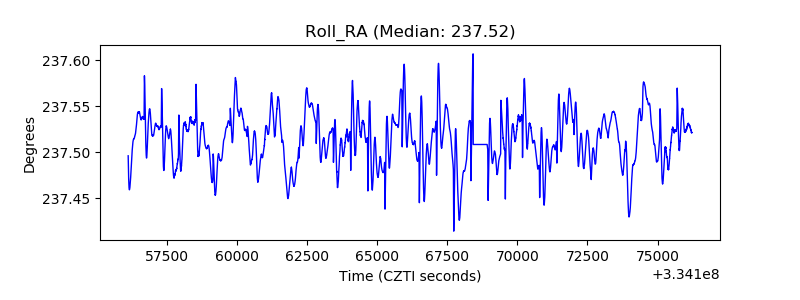 |
| Veto Counter | 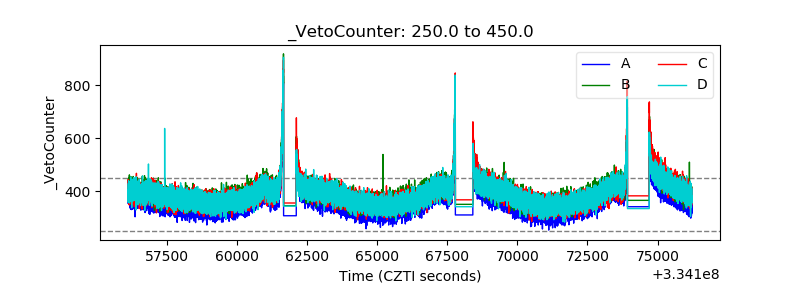 |