| Param | Original file | Final file |
|---|---|---|
| Filename | modeM0/AS1C05_019T04_9000003788_26223cztM0_level2.evt | modeM0/AS1C05_019T04_9000003788_26223cztM0_level2_quad_clean.evt |
| Size (bytes) | 548,674,560 | 123,730,560 |
| Size | 523.3 MB | 118.0 MB |
| Events in quadrant A | 3,302,841 | 843,241 |
| Events in quadrant B | 3,267,416 | 857,546 |
| Events in quadrant C | 3,418,328 | 829,057 |
| Events in quadrant D | 6,181,184 | 757,951 |
| Mode M9 | |||
|---|---|---|---|
| Quadrant | BADHDUFLAG | Total packets | Discarded packets |
| A | 0 | 10 | 0 |
| B | 0 | 10 | 0 |
| C | 0 | 10 | 0 |
| D | 0 | 10 | 0 |
| Mode M0 | |||
|---|---|---|---|
| Quadrant | BADHDUFLAG | Total packets | Discarded packets |
| A | 0 | 14304 | 0 |
| B | 0 | 14047 | 0 |
| C | 0 | 14451 | 0 |
| D | 0 | 22926 | 0 |
| Quadrant | Total seconds | Saturated seconds | Saturation percentage |
|---|---|---|---|
| A | 6594 | 87 | 1.319381% |
| B | 6594 | 64 | 0.970579% |
| C | 6594 | 77 | 1.167728% |
| D | 6594 | 875 | 13.269639% |
Noise dominated data is calculated using 1-second bins in cleaned event files. If a bin has >2000 counts, and if more than 50% of those come from <1% of pixels, then it is considered to be noise-dominated and hence unusable.
| Quadrant | # 1 sec bins | Bins with >0 counts | Bins with >2000 counts | High rate bins dominated by noise | Noise dominated (total time) | Noise dominated (detector-on time) | Marked lightcurve |
|---|---|---|---|---|---|---|---|
| A | 7539 | 6595 | 48 | 48 | 0.64% | 0.73% | 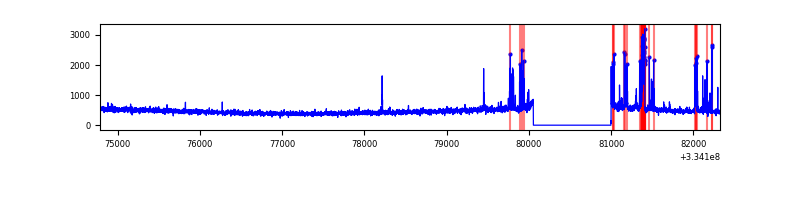 |
| B | 7539 | 6595 | 26 | 26 | 0.34% | 0.39% | 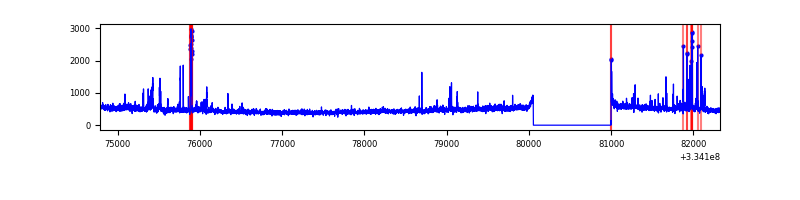 |
| C | 7539 | 6595 | 6 | 6 | 0.08% | 0.09% | 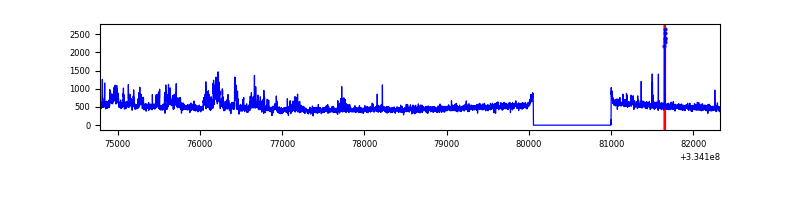 |
| D | 7539 | 6595 | 777 | 777 | 10.31% | 11.78% | 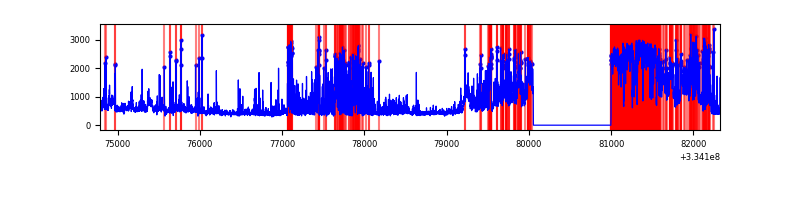 |
Top three noisy pixels from each quadrant. If the there are fewer than three noisy pixels in the level2.evt file, extra rows are filled as -1
| Pixel properties | Quadrant properties | ||||||
|---|---|---|---|---|---|---|---|
| Quadrant | DetID | PixID | Counts | Sigma | Mean | Median | Sigma |
| A | 0 | 13 | 294529 | 1880.25 | 779 | 763 | 156.2 |
| A | 13 | 254 | 11124 | 66.32 | 779 | 763 | 156.2 |
| A | 3 | 137 | 7000 | 39.92 | 779 | 763 | 156.2 |
| B | 5 | 172 | 123839 | 824.31 | 782 | 762 | 149.3 |
| B | 0 | 190 | 35213 | 230.73 | 782 | 762 | 149.3 |
| B | 15 | 36 | 26640 | 173.32 | 782 | 762 | 149.3 |
| C | 3 | 233 | 288545 | 1613.91 | 761 | 765 | 178.3 |
| C | 14 | 238 | 120477 | 671.36 | 761 | 765 | 178.3 |
| C | 0 | 239 | 17080 | 91.5 | 761 | 765 | 178.3 |
| D | 1 | 52 | 3309093 | 18709.81 | 717 | 700 | 176.8 |
| D | 7 | 38 | 61623 | 344.54 | 717 | 700 | 176.8 |
| D | 2 | 234 | 31118 | 172.02 | 717 | 700 | 176.8 |
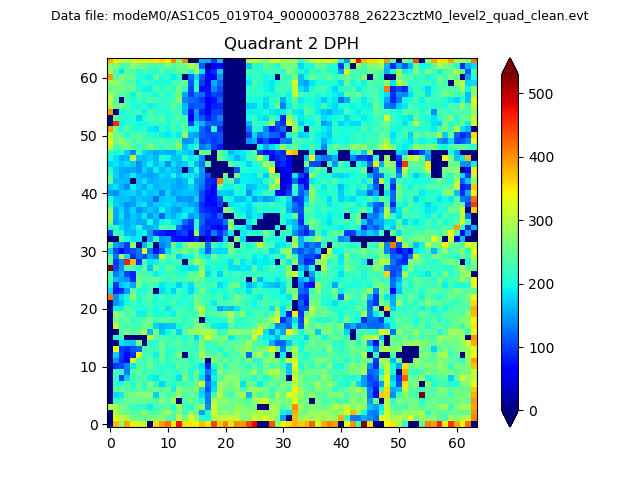
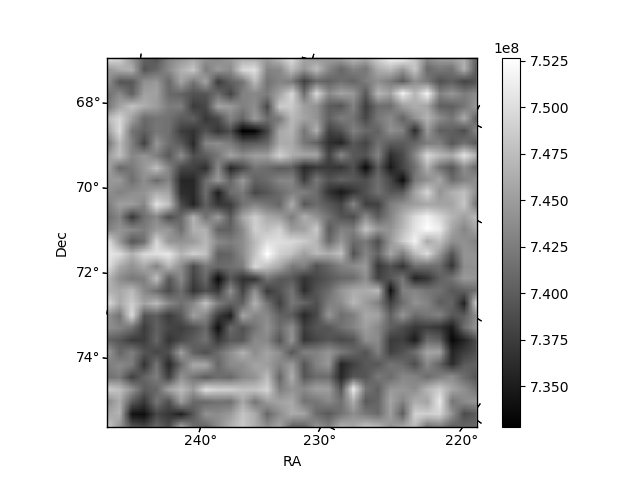
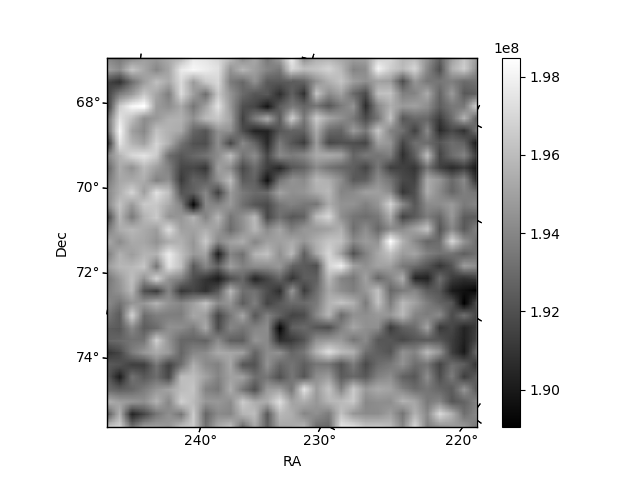
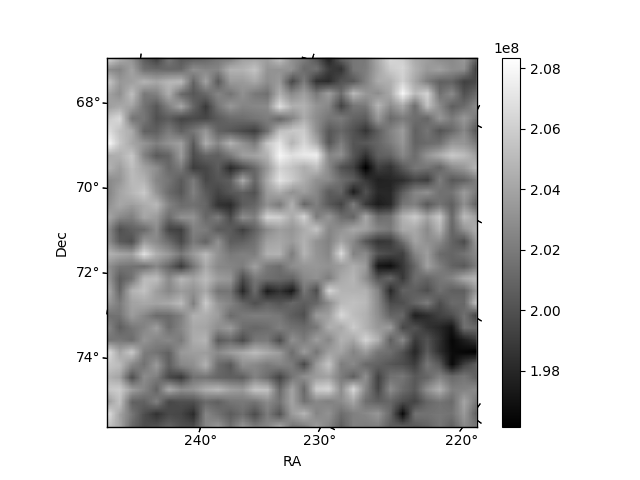
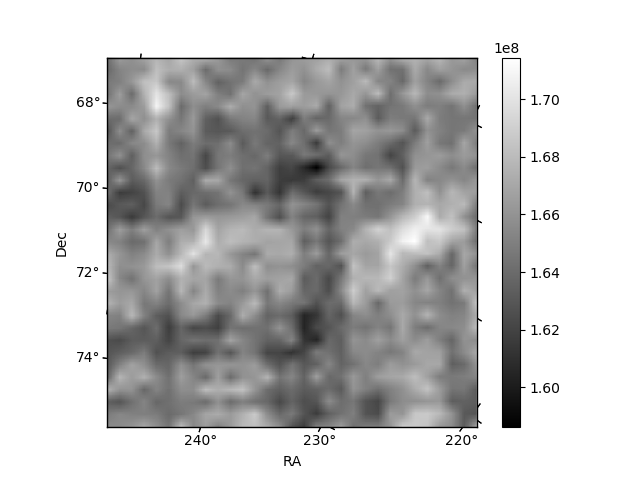
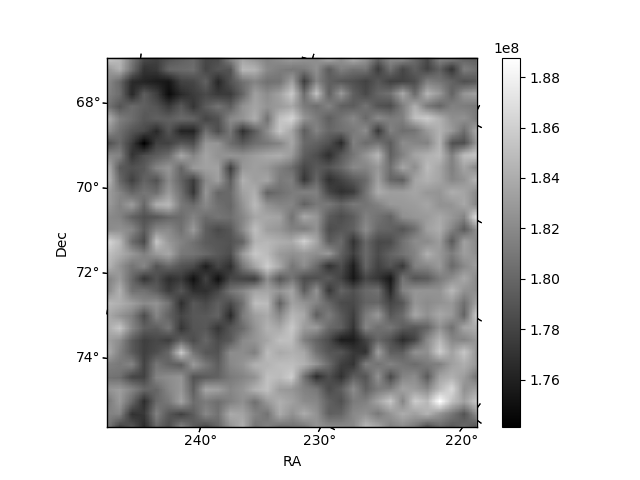
Histogram calculated using DETX and DETY for each event in the final _common_clean file
| Quadrant A | 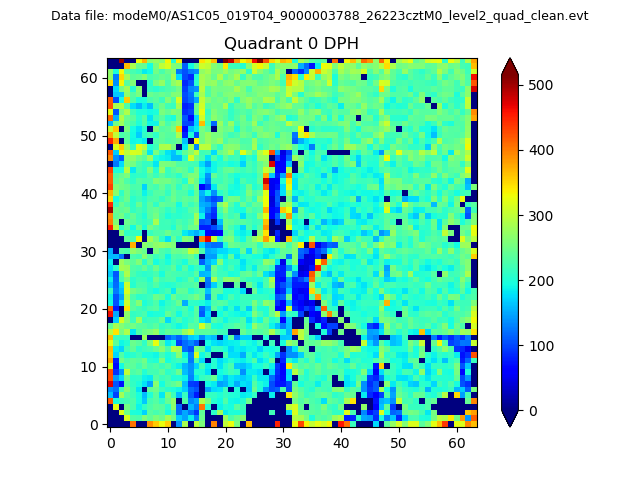 |
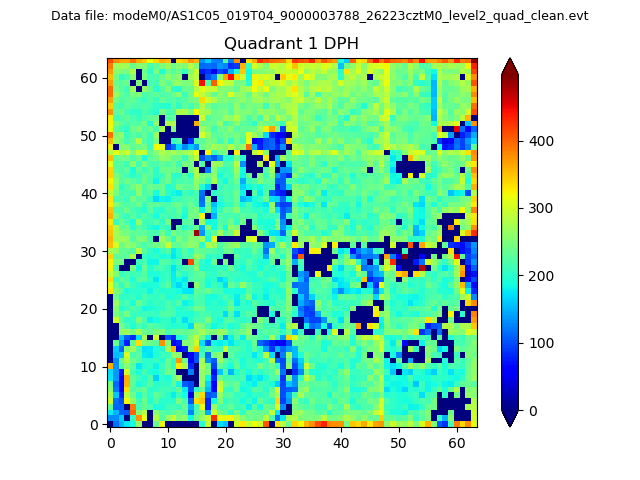 |
Quadrant B |
|---|---|---|---|
| Quadrant D | 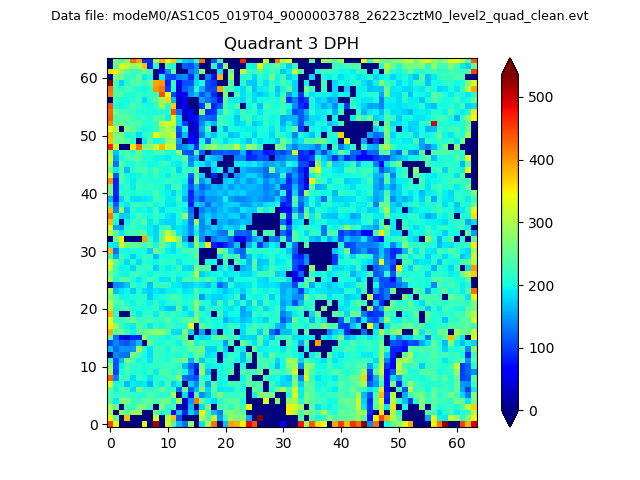 |
 |
Quadrant C |
| Plot type | Count rate plots | Images |
|---|---|---|
| Comparison with Poisson distribution Blue bars denote a histogram of data divided into 1 sec bins. Red curve is a Poisson curve with rate = median count rate of data. |
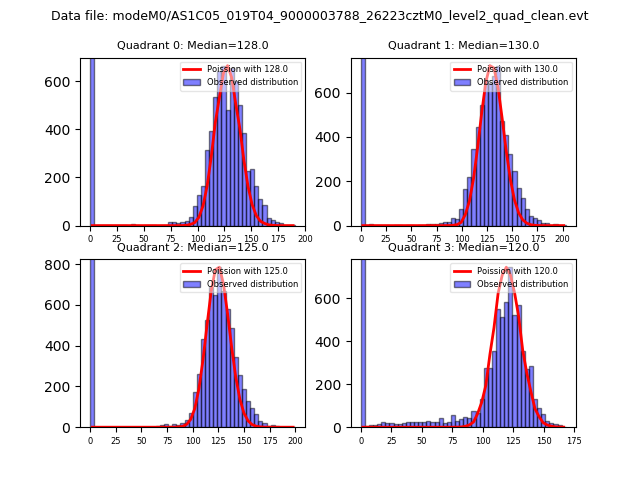 |
 |
| Quadrant-wise count rates Data is divided into 100 sec bins |
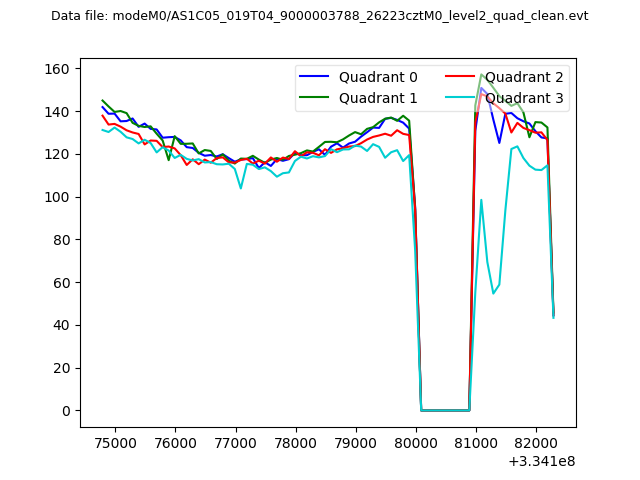 |
|
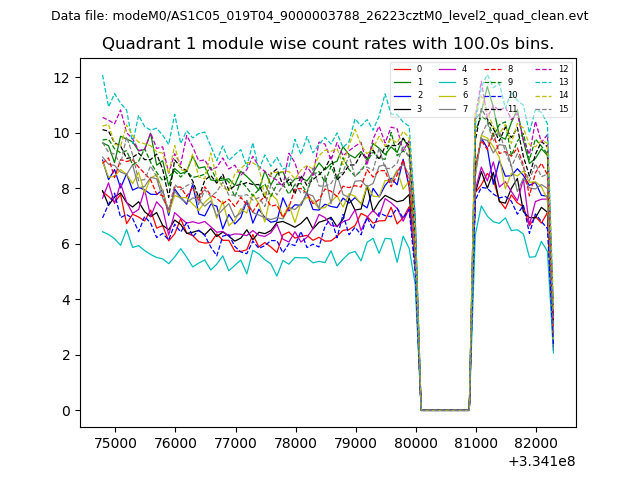
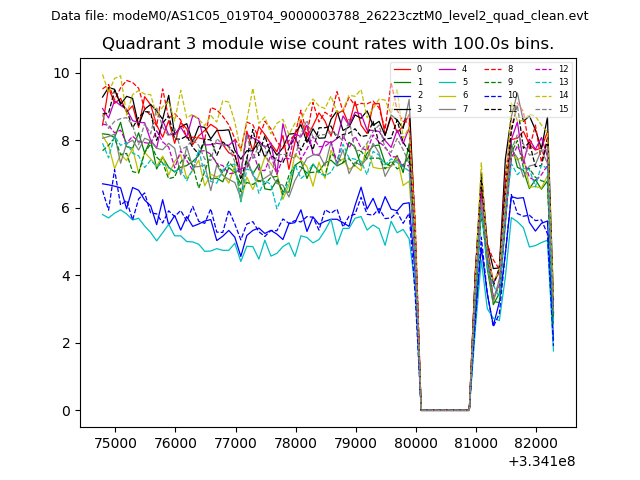
| Module-wise count rates for Quadrant A Data is divided into 100 sec bins |
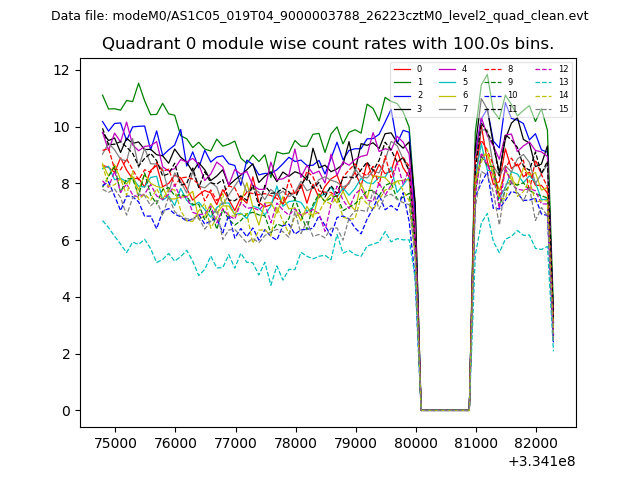 |
 |
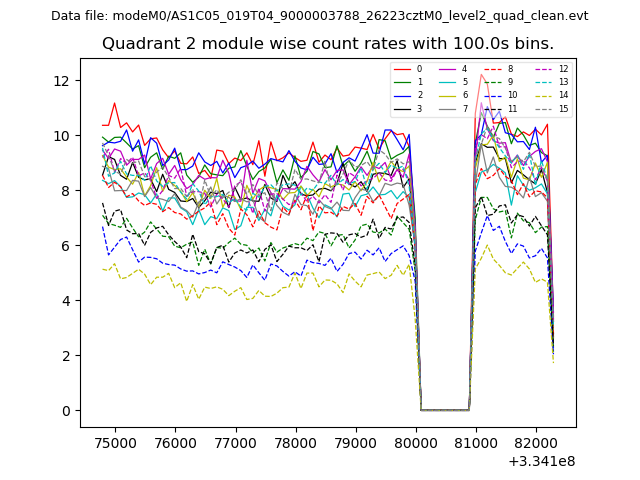
| Module-wise count rates for Quadrant B Data is divided into 100 sec bins |
 |
 |
| Module-wise count rates for Quadrant C Data is divided into 100 sec bins |
 |
 |
| Module-wise count rates for Quadrant D Data is divided into 100 sec bins |
 |
 |
| Parameter | Plot |
|---|---|
| CZT HV Monitor | 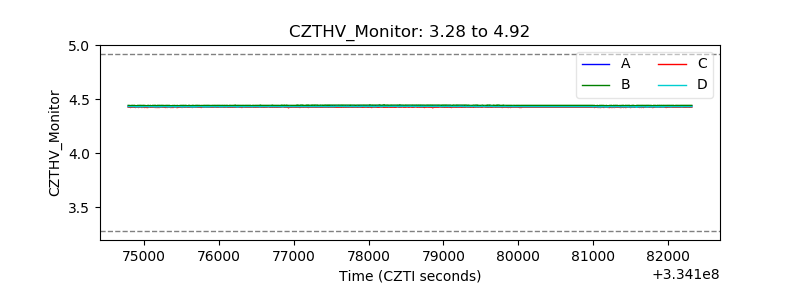 |
| D_VDD | 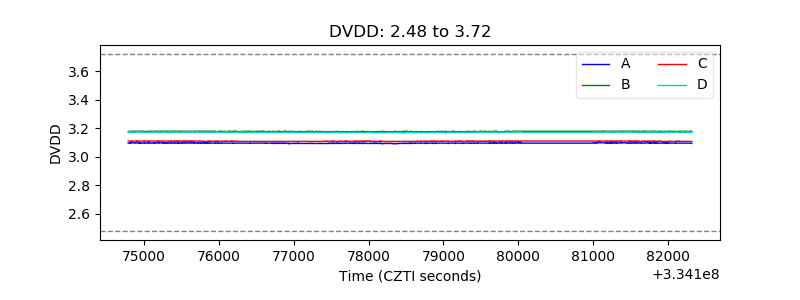 |
| Temperature 1 | 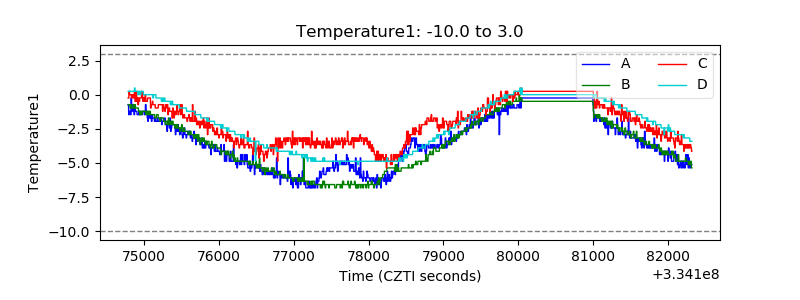 |
| Veto HV Monitor | 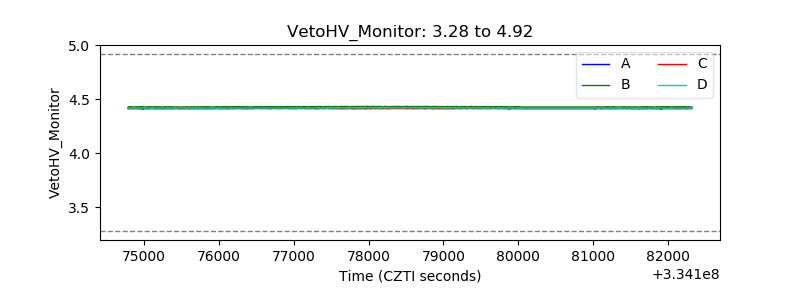 |
| Veto LLD | 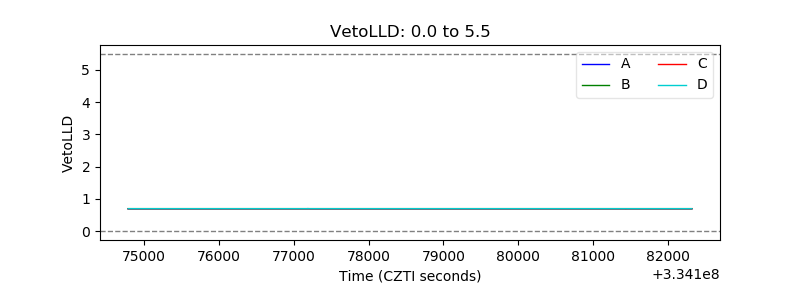 |
| Alpha Counter | 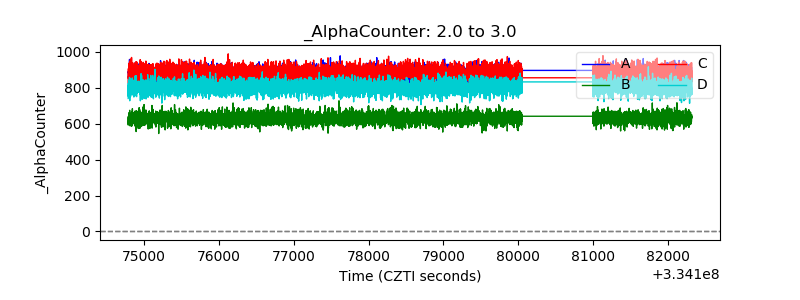 |
| _CPM_Rate | 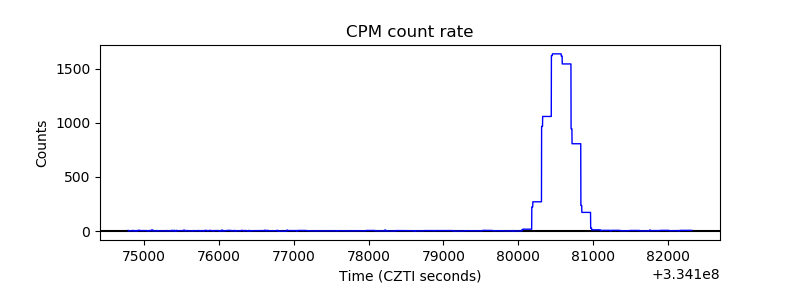 |
| CZT Counter | 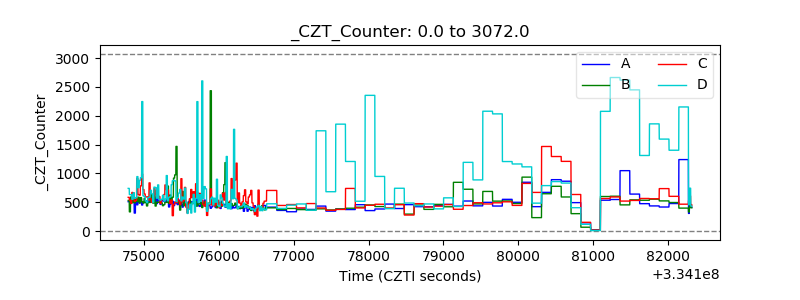 |
| +2.5 Volts monitor |  |
| +5 Volts monitor |  |
| _ROLL_ROT | 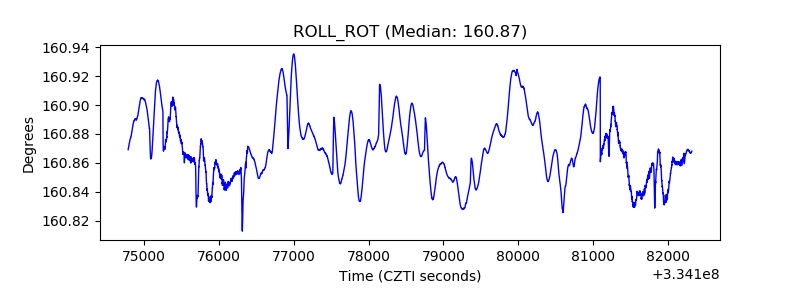 |
| _Roll_DEC | 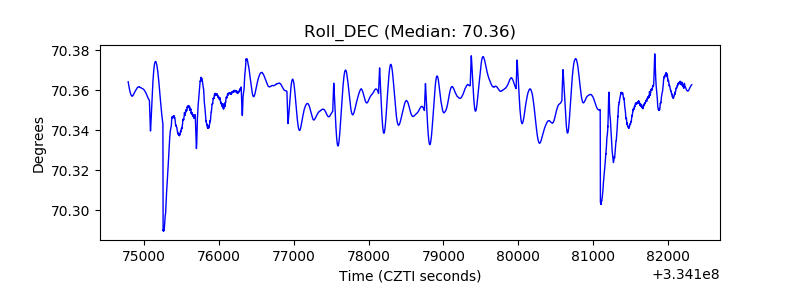 |
| _Roll_RA | 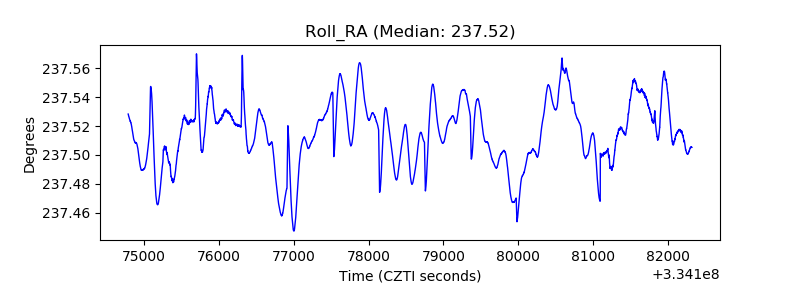 |
| Veto Counter | 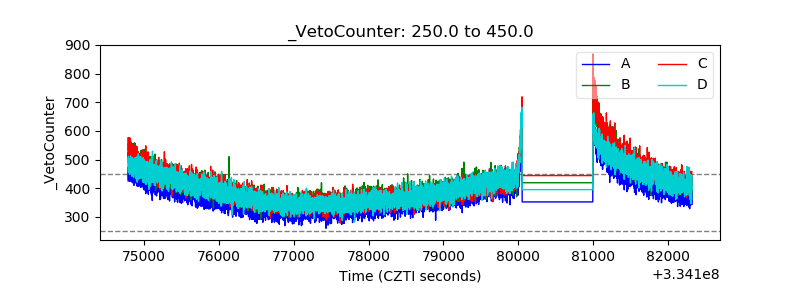 |