| Param | Original file | Final file |
|---|---|---|
| Filename | modeM0/AS1C05_019T04_9000003788_26225cztM0_level2.evt | modeM0/AS1C05_019T04_9000003788_26225cztM0_level2_quad_clean.evt |
| Size (bytes) | 542,162,880 | 125,516,160 |
| Size | 517.0 MB | 119.7 MB |
| Events in quadrant A | 3,406,843 | 854,800 |
| Events in quadrant B | 3,257,409 | 883,050 |
| Events in quadrant C | 3,172,578 | 852,229 |
| Events in quadrant D | 6,141,841 | 758,004 |
| Mode M9 | |||
|---|---|---|---|
| Quadrant | BADHDUFLAG | Total packets | Discarded packets |
| A | 0 | 17 | 0 |
| B | 0 | 18 | 0 |
| C | 0 | 18 | 0 |
| D | 0 | 18 | 0 |
| Mode M0 | |||
|---|---|---|---|
| Quadrant | BADHDUFLAG | Total packets | Discarded packets |
| A | 0 | 14480 | 0 |
| B | 0 | 13971 | 0 |
| C | 0 | 13714 | 0 |
| D | 0 | 22806 | 0 |
| Quadrant | Total seconds | Saturated seconds | Saturation percentage |
|---|---|---|---|
| A | 6496 | 105 | 1.616379% |
| B | 6496 | 54 | 0.831281% |
| C | 6496 | 60 | 0.923645% |
| D | 6496 | 1026 | 15.794335% |
Noise dominated data is calculated using 1-second bins in cleaned event files. If a bin has >2000 counts, and if more than 50% of those come from <1% of pixels, then it is considered to be noise-dominated and hence unusable.
| Quadrant | # 1 sec bins | Bins with >0 counts | Bins with >2000 counts | High rate bins dominated by noise | Noise dominated (total time) | Noise dominated (detector-on time) | Marked lightcurve |
|---|---|---|---|---|---|---|---|
| A | 7601 | 6497 | 69 | 69 | 0.91% | 1.06% | 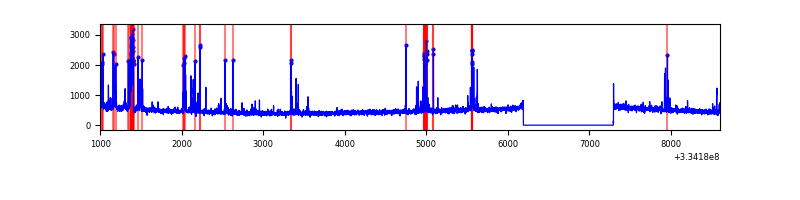 |
| B | 7601 | 6497 | 18 | 18 | 0.24% | 0.28% | 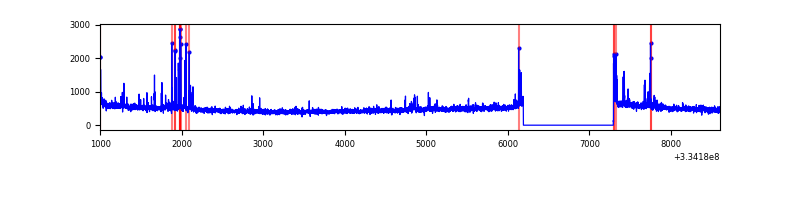 |
| C | 7601 | 6497 | 6 | 6 | 0.08% | 0.09% | 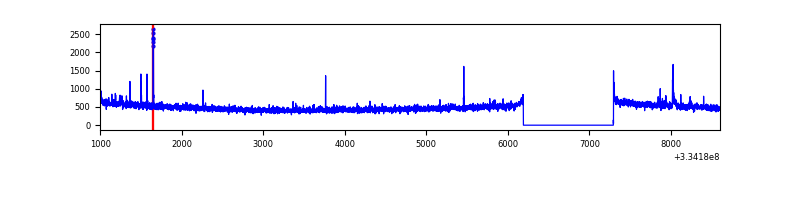 |
| D | 7601 | 6497 | 941 | 941 | 12.38% | 14.48% | 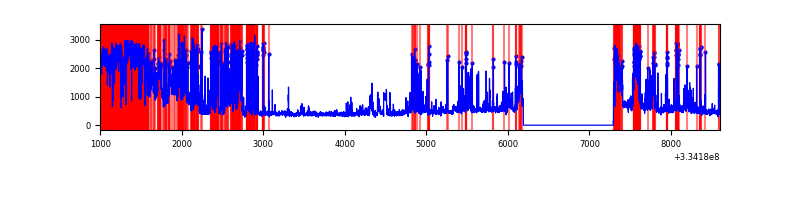 |
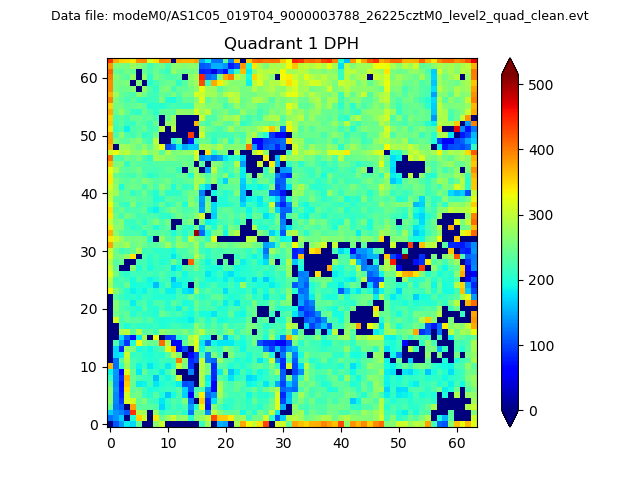
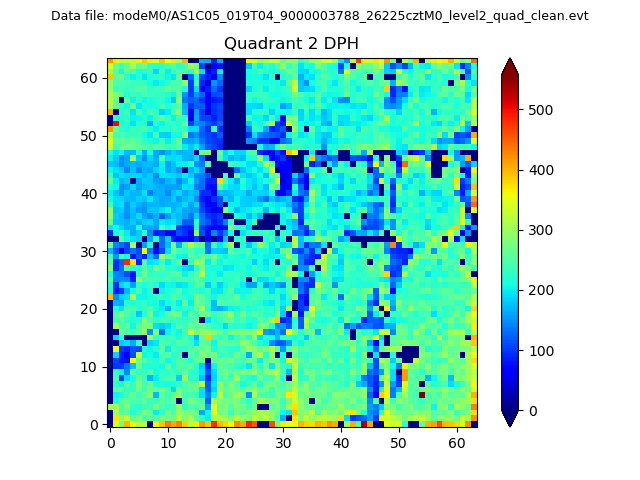
Top three noisy pixels from each quadrant. If the there are fewer than three noisy pixels in the level2.evt file, extra rows are filled as -1
| Pixel properties | Quadrant properties | ||||||
|---|---|---|---|---|---|---|---|
| Quadrant | DetID | PixID | Counts | Sigma | Mean | Median | Sigma |
| A | 0 | 13 | 410446 | 2607.81 | 776 | 759 | 157.1 |
| A | 13 | 254 | 10747 | 63.58 | 776 | 759 | 157.1 |
| A | 3 | 137 | 6870 | 38.9 | 776 | 759 | 157.1 |
| B | 5 | 172 | 130145 | 879.08 | 786 | 766 | 147.2 |
| B | 12 | 111 | 17274 | 112.17 | 786 | 766 | 147.2 |
| B | 0 | 230 | 15899 | 102.82 | 786 | 766 | 147.2 |
| C | 14 | 238 | 122070 | 681.55 | 763 | 768 | 178.0 |
| C | 3 | 233 | 25334 | 138.03 | 763 | 768 | 178.0 |
| C | 2 | 16 | 22992 | 124.87 | 763 | 768 | 178.0 |
| D | 1 | 52 | 3019774 | 17987.22 | 703 | 686 | 167.8 |
| D | 15 | 0 | 305124 | 1813.79 | 703 | 686 | 167.8 |
| D | 7 | 38 | 51591 | 303.28 | 703 | 686 | 167.8 |
Histogram calculated using DETX and DETY for each event in the final _common_clean file
| Quadrant A | 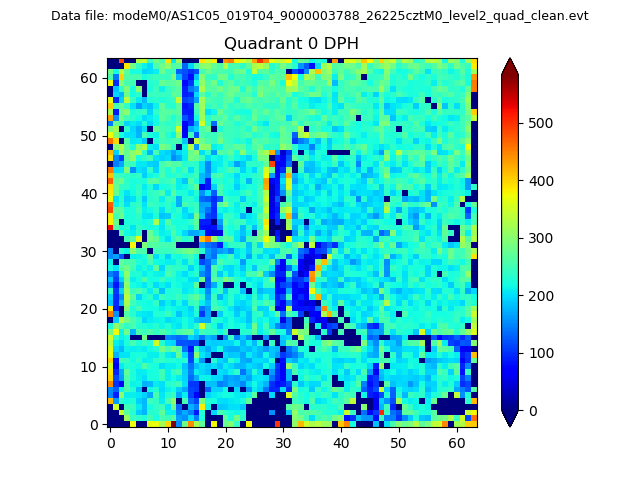 |
 |
Quadrant B |
|---|---|---|---|
| Quadrant D | 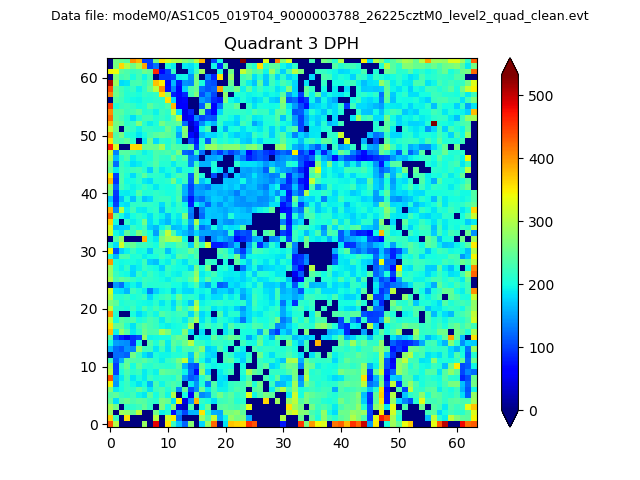 |
 |
Quadrant C |
| Plot type | Count rate plots | Images |
|---|---|---|
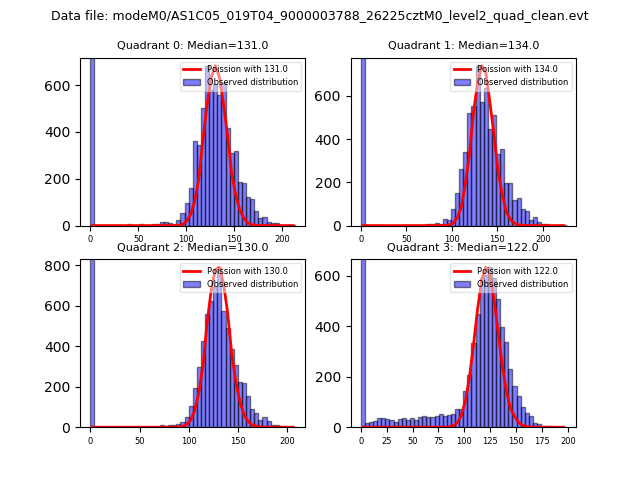
| Comparison with Poisson distribution Blue bars denote a histogram of data divided into 1 sec bins. Red curve is a Poisson curve with rate = median count rate of data. |
 |
 |
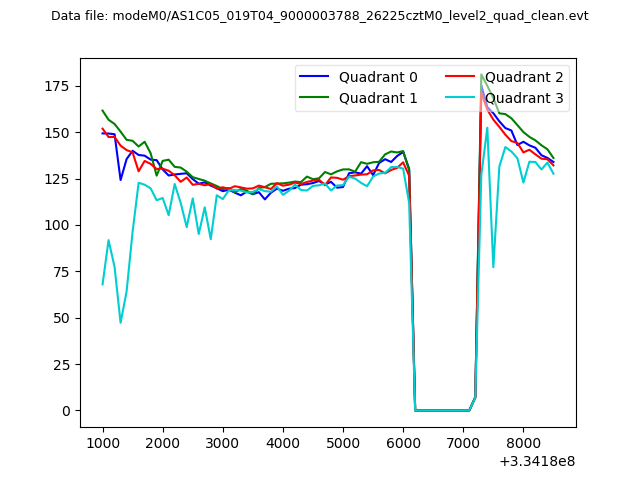
| Quadrant-wise count rates Data is divided into 100 sec bins |
 |
|
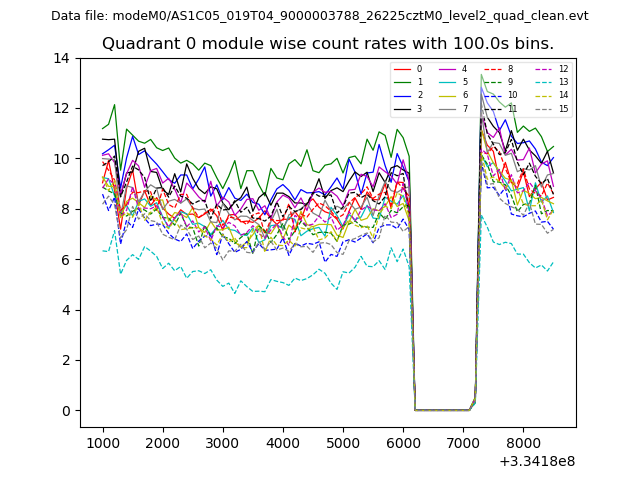
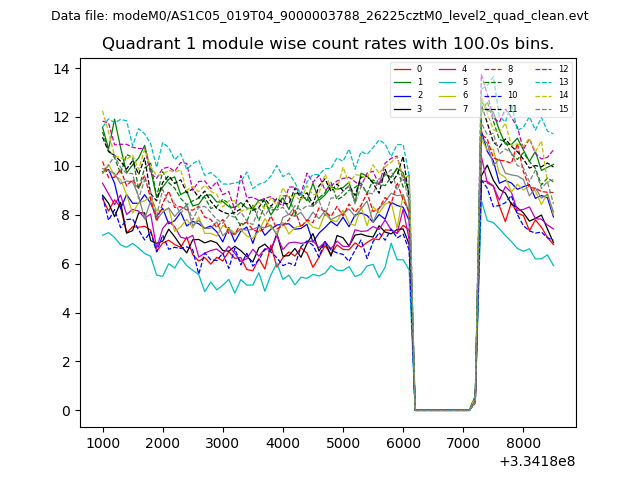
| Module-wise count rates for Quadrant A Data is divided into 100 sec bins |
 |
 |
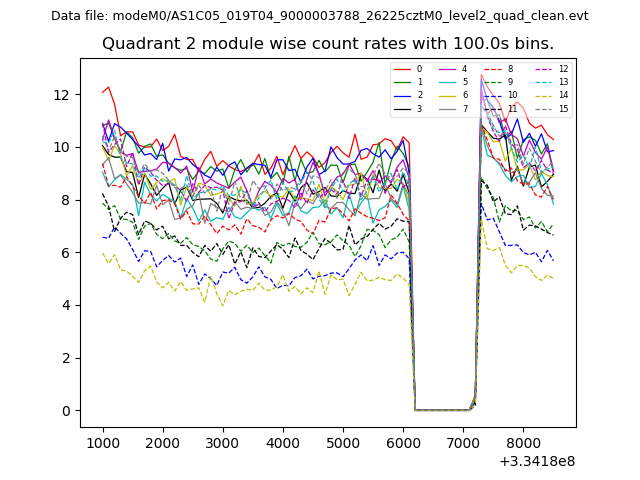
| Module-wise count rates for Quadrant B Data is divided into 100 sec bins |
 |
 |
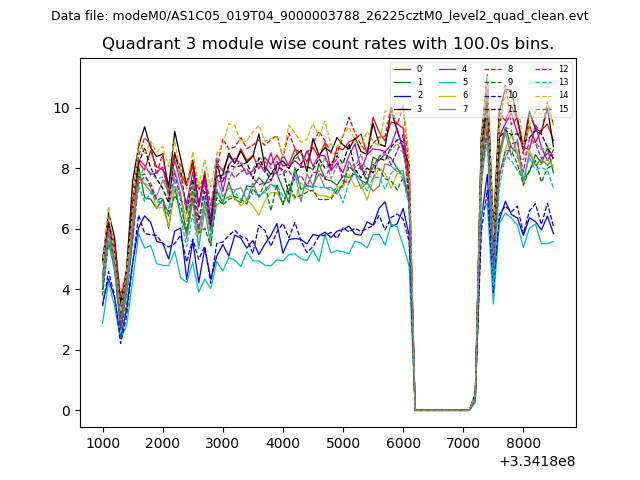
| Module-wise count rates for Quadrant C Data is divided into 100 sec bins |
 |
 |
| Module-wise count rates for Quadrant D Data is divided into 100 sec bins |
 |
 |
| Parameter | Plot |
|---|---|
| CZT HV Monitor | 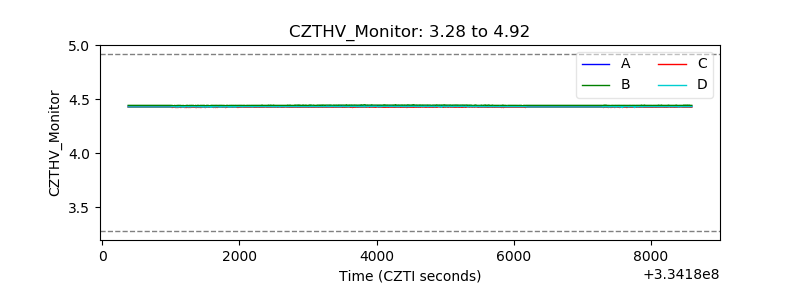 |
| D_VDD | 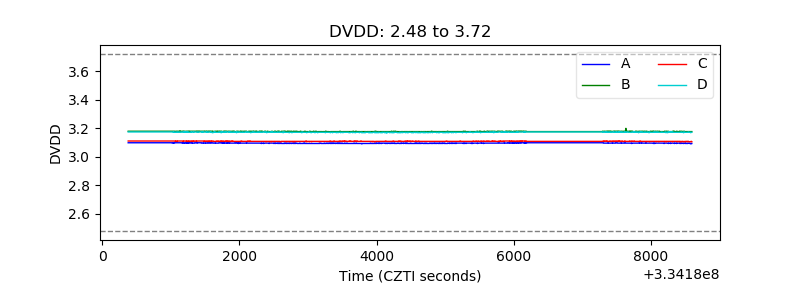 |
| Temperature 1 | 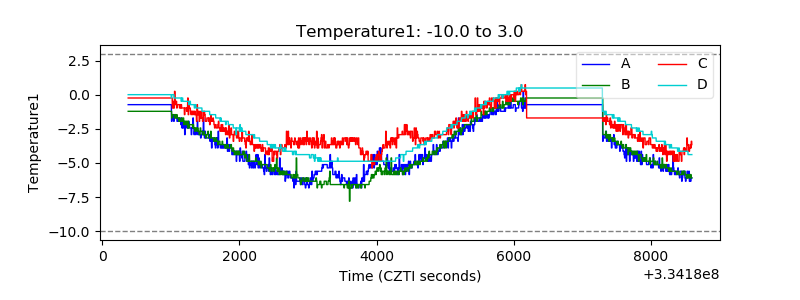 |
| Veto HV Monitor | 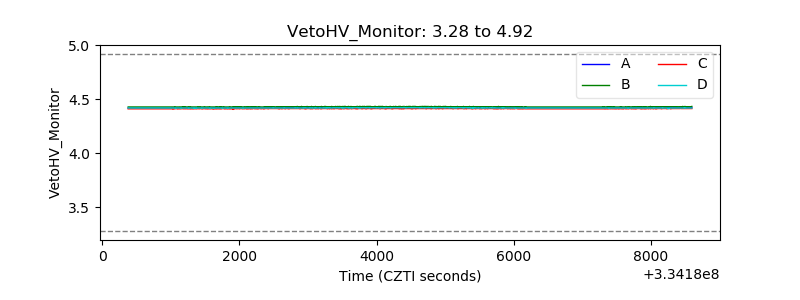 |
| Veto LLD | 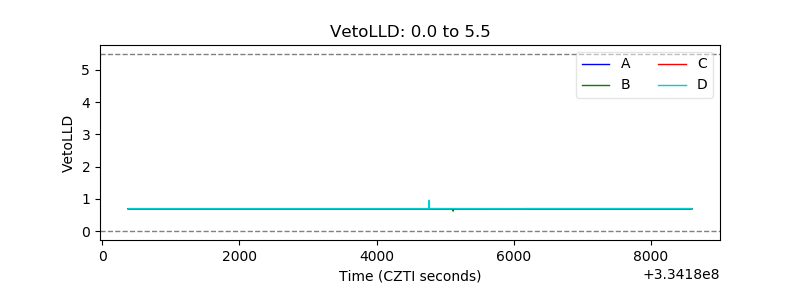 |
| Alpha Counter | 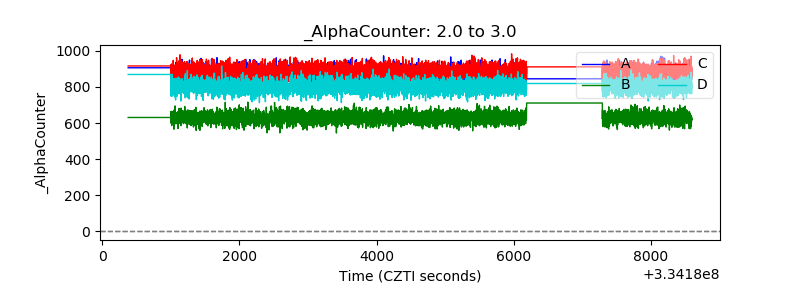 |
| _CPM_Rate | 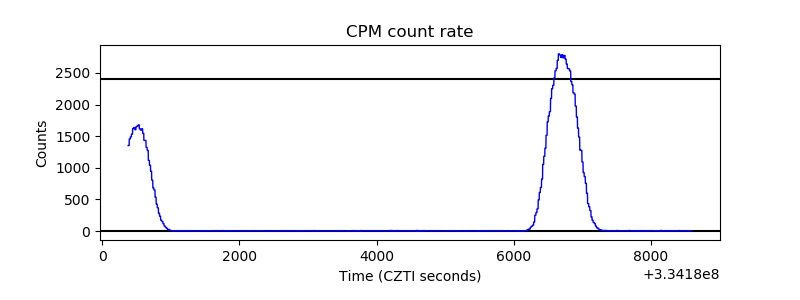 |
| CZT Counter |  |
| +2.5 Volts monitor |  |
| +5 Volts monitor | 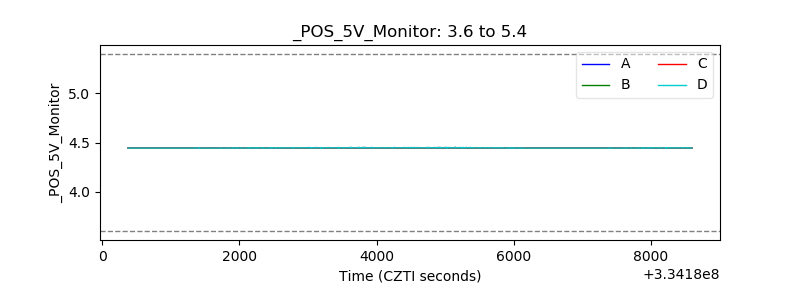 |
| _ROLL_ROT | 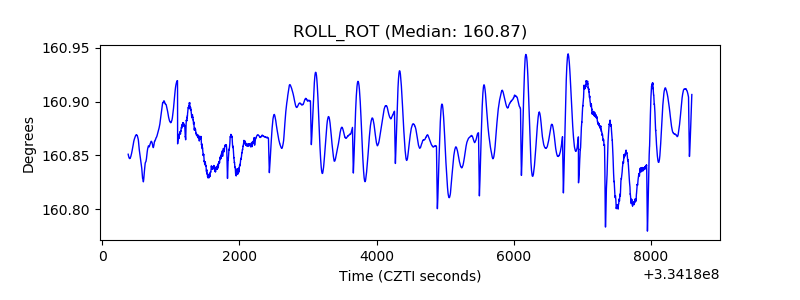 |
| _Roll_DEC |  |
| _Roll_RA | 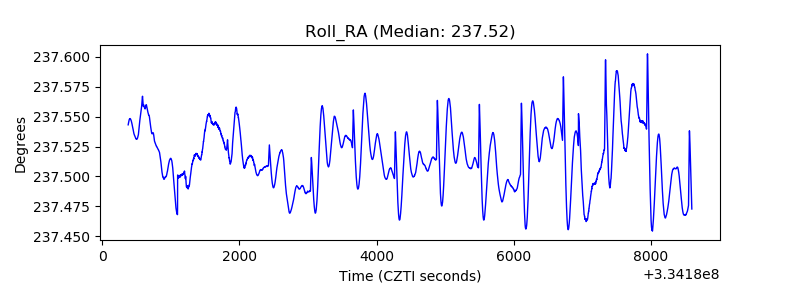 |
| Veto Counter | 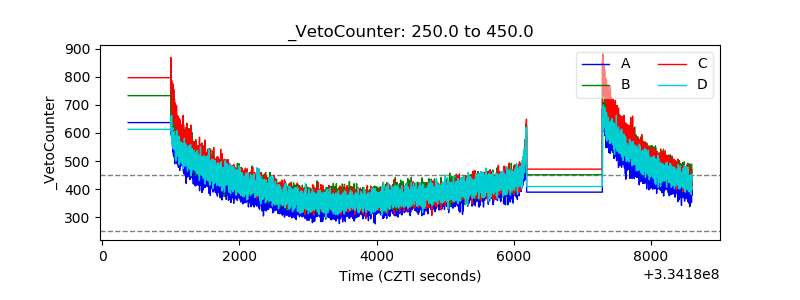 |