| Param | Original file | Final file |
|---|---|---|
| Filename | modeM0/AS1C05_019T04_9000003788_26226cztM0_level2.evt | modeM0/AS1C05_019T04_9000003788_26226cztM0_level2_quad_clean.evt |
| Size (bytes) | 492,877,440 | 127,739,520 |
| Size | 470.0 MB | 121.8 MB |
| Events in quadrant A | 3,256,051 | 868,288 |
| Events in quadrant B | 3,144,453 | 902,691 |
| Events in quadrant C | 3,100,884 | 860,250 |
| Events in quadrant D | 4,998,584 | 798,690 |
| Mode M9 | |||
|---|---|---|---|
| Quadrant | BADHDUFLAG | Total packets | Discarded packets |
| A | 0 | 17 | 0 |
| B | 0 | 18 | 0 |
| C | 0 | 18 | 0 |
| D | 0 | 18 | 0 |
| Mode M0 | |||
|---|---|---|---|
| Quadrant | BADHDUFLAG | Total packets | Discarded packets |
| A | 0 | 13817 | 0 |
| B | 0 | 13457 | 0 |
| C | 0 | 13347 | 0 |
| D | 0 | 19191 | 0 |
| Quadrant | Total seconds | Saturated seconds | Saturation percentage |
|---|---|---|---|
| A | 6288 | 54 | 0.858779% |
| B | 6288 | 35 | 0.556616% |
| C | 6288 | 56 | 0.890585% |
| D | 6288 | 501 | 7.967557% |
Noise dominated data is calculated using 1-second bins in cleaned event files. If a bin has >2000 counts, and if more than 50% of those come from <1% of pixels, then it is considered to be noise-dominated and hence unusable.
| Quadrant | # 1 sec bins | Bins with >0 counts | Bins with >2000 counts | High rate bins dominated by noise | Noise dominated (total time) | Noise dominated (detector-on time) | Marked lightcurve |
|---|---|---|---|---|---|---|---|
| A | 7498 | 6289 | 47 | 47 | 0.63% | 0.75% | 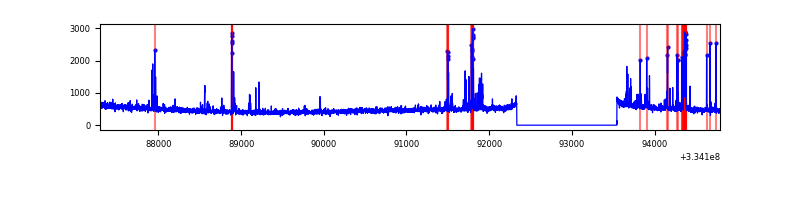 |
| B | 7498 | 6289 | 14 | 14 | 0.19% | 0.22% | 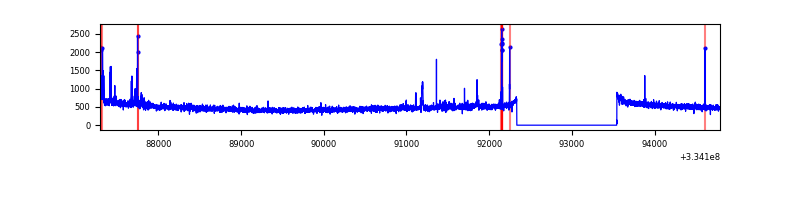 |
| C | 7498 | 6289 | 0 | 0 | 0.00% | 0.00% | 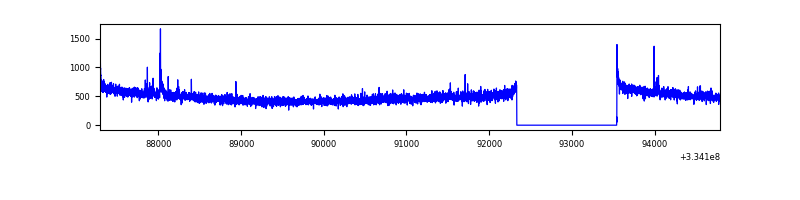 |
| D | 7498 | 6289 | 464 | 464 | 6.19% | 7.38% | 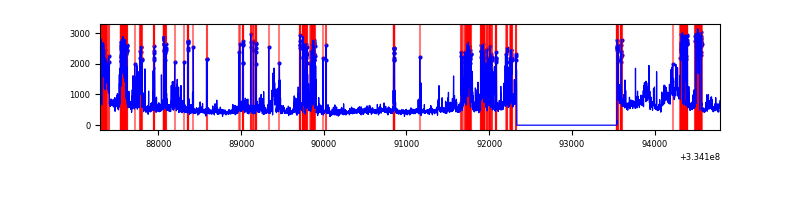 |
Top three noisy pixels from each quadrant. If the there are fewer than three noisy pixels in the level2.evt file, extra rows are filled as -1
| Pixel properties | Quadrant properties | ||||||
|---|---|---|---|---|---|---|---|
| Quadrant | DetID | PixID | Counts | Sigma | Mean | Median | Sigma |
| A | 0 | 13 | 298456 | 1939.67 | 766 | 751 | 153.5 |
| A | 13 | 254 | 10703 | 64.84 | 766 | 751 | 153.5 |
| A | 3 | 137 | 6891 | 40.0 | 766 | 751 | 153.5 |
| B | 5 | 172 | 78599 | 533.39 | 778 | 759 | 145.9 |
| B | 0 | 230 | 18834 | 123.85 | 778 | 759 | 145.9 |
| B | 12 | 111 | 16793 | 109.87 | 778 | 759 | 145.9 |
| C | 14 | 238 | 122756 | 702.66 | 752 | 757 | 173.6 |
| C | 3 | 233 | 27597 | 154.59 | 752 | 757 | 173.6 |
| C | 2 | 16 | 10514 | 56.2 | 752 | 757 | 173.6 |
| D | 1 | 52 | 1450224 | 8514.12 | 720 | 703 | 170.2 |
| D | 13 | 174 | 362903 | 2127.47 | 720 | 703 | 170.2 |
| D | 15 | 0 | 299905 | 1757.44 | 720 | 703 | 170.2 |
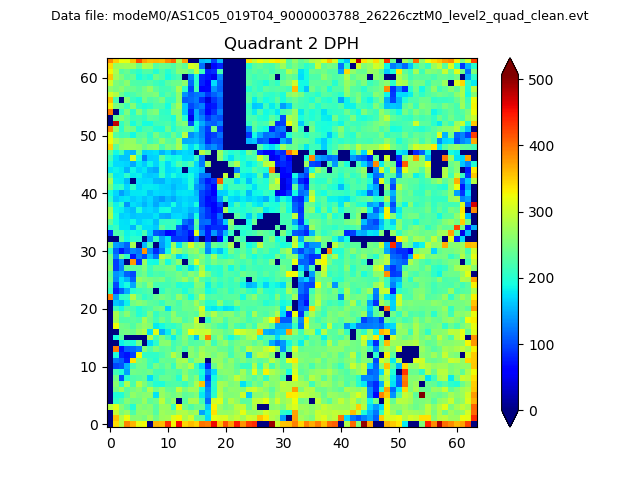
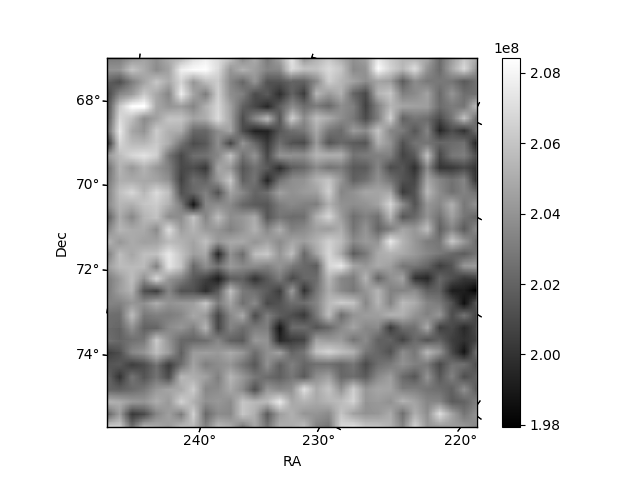
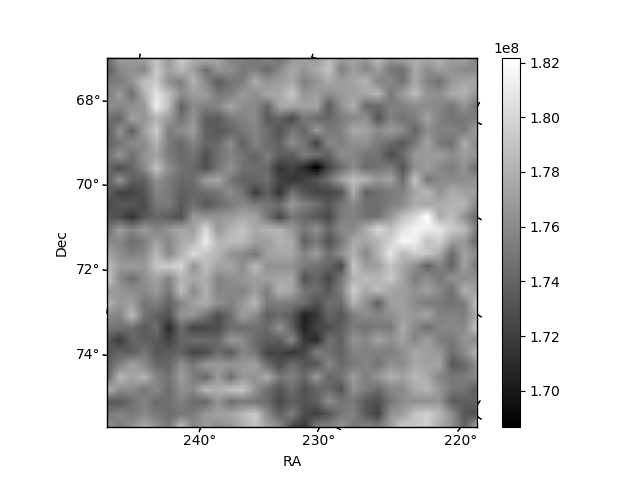
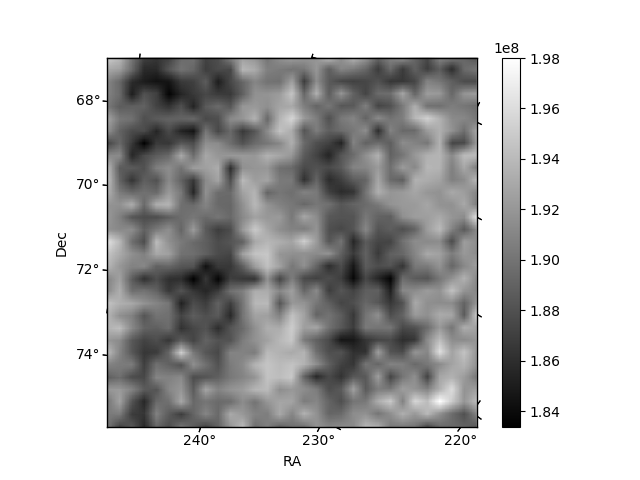
Histogram calculated using DETX and DETY for each event in the final _common_clean file
| Quadrant A | 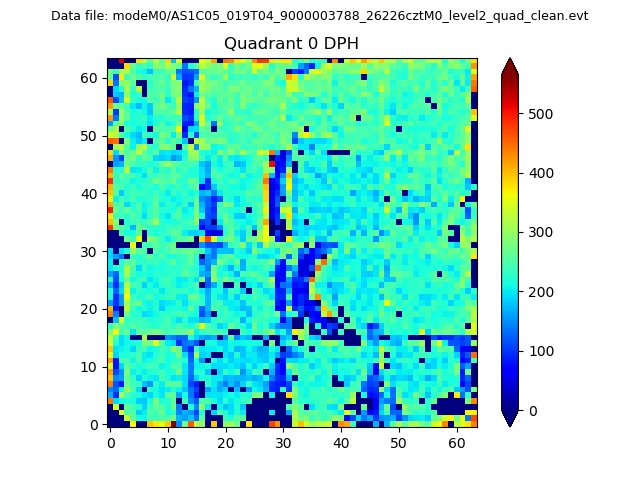 |
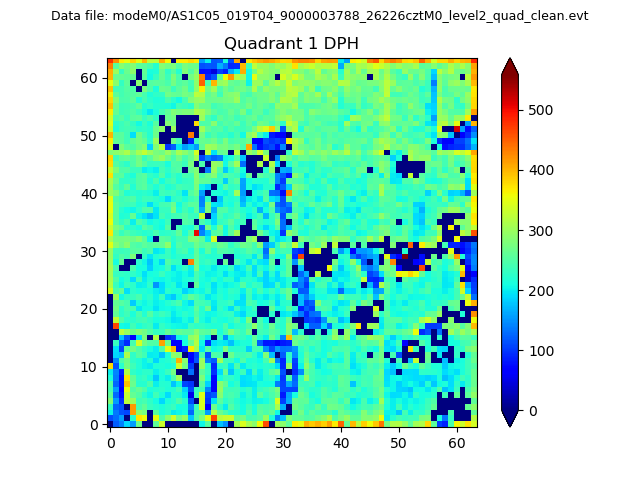 |
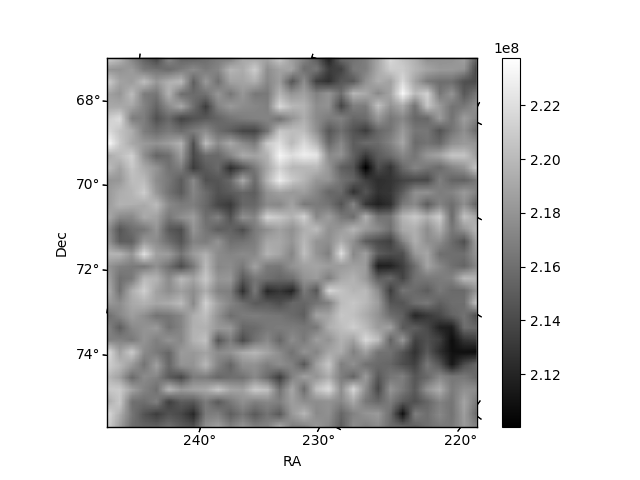
Quadrant B |
|---|---|---|---|
| Quadrant D | 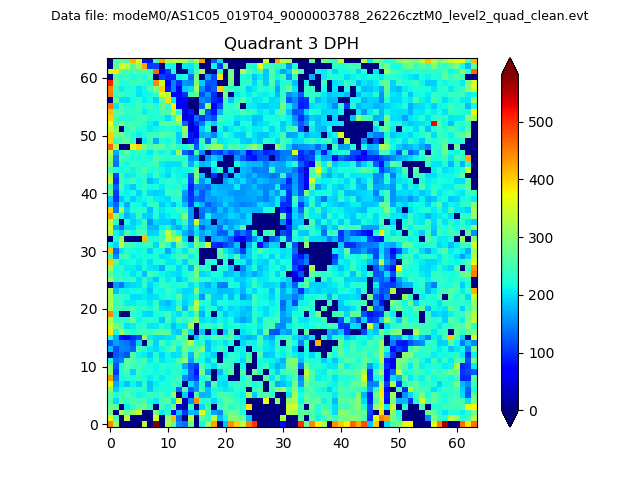 |
 |
Quadrant C |
| Plot type | Count rate plots | Images |
|---|---|---|
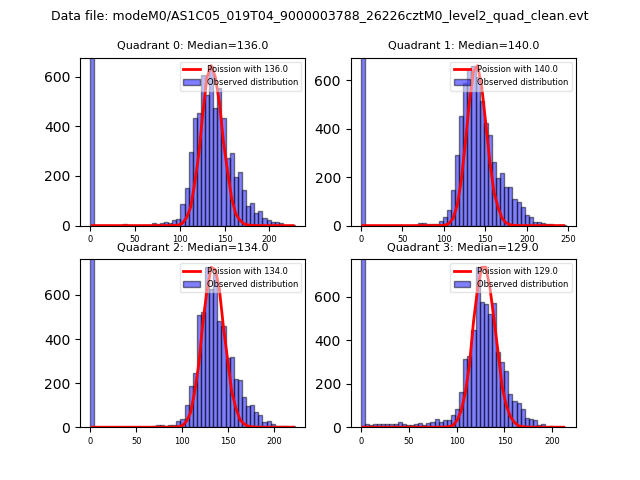
| Comparison with Poisson distribution Blue bars denote a histogram of data divided into 1 sec bins. Red curve is a Poisson curve with rate = median count rate of data. |
 |
 |
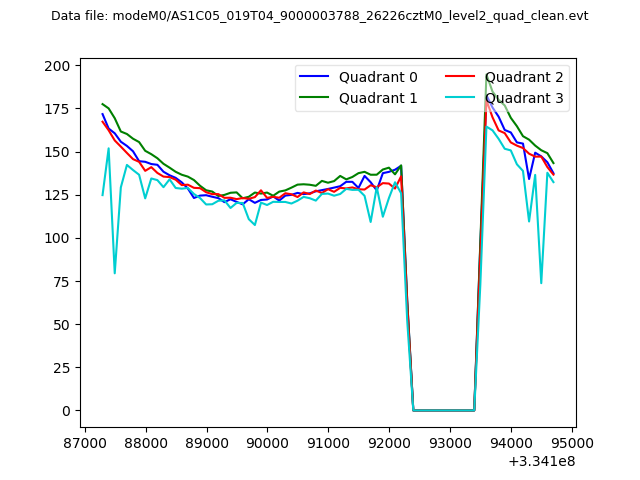
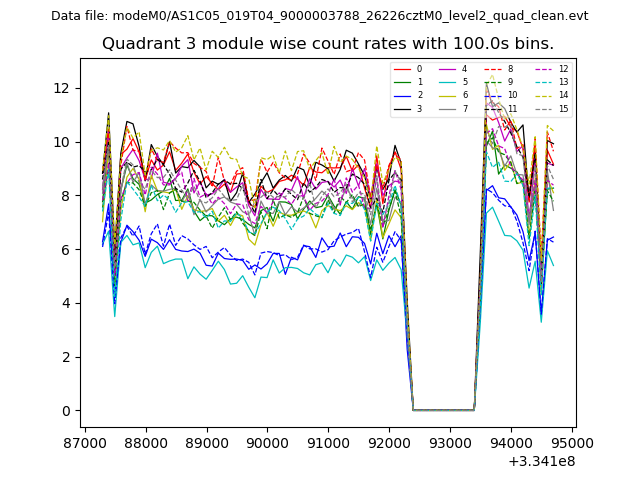
| Quadrant-wise count rates Data is divided into 100 sec bins |
 |
|
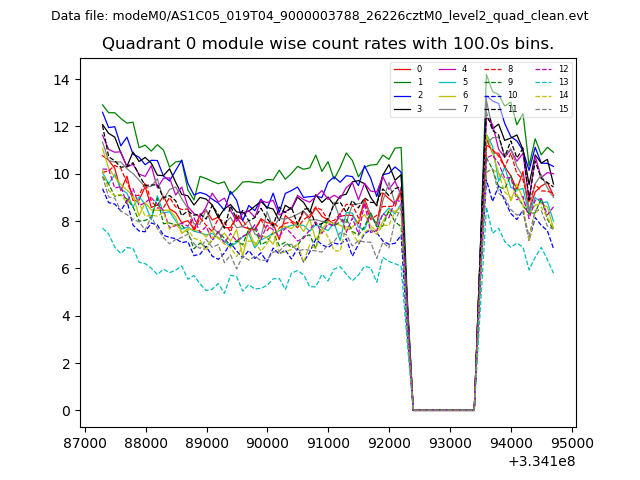
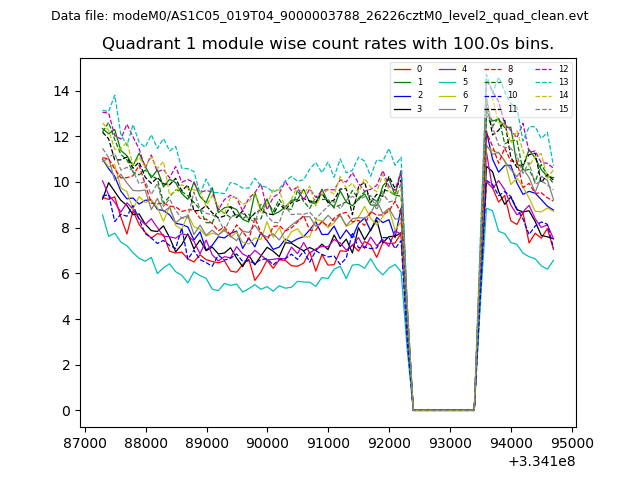
| Module-wise count rates for Quadrant A Data is divided into 100 sec bins |
 |
 |
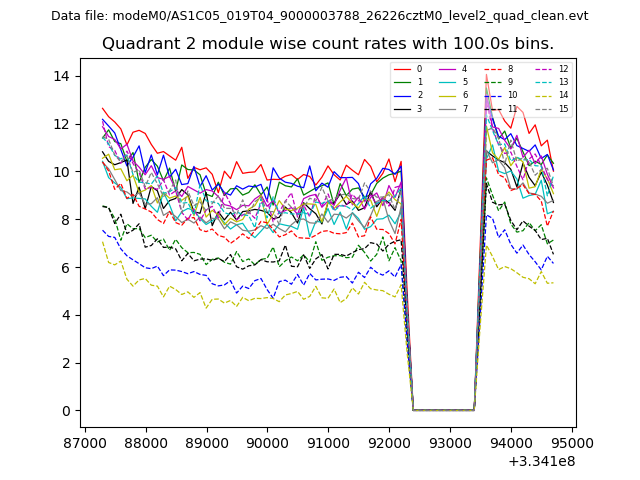
| Module-wise count rates for Quadrant B Data is divided into 100 sec bins |
 |
 |
| Module-wise count rates for Quadrant C Data is divided into 100 sec bins |
 |
 |
| Module-wise count rates for Quadrant D Data is divided into 100 sec bins |
 |
 |
| Parameter | Plot |
|---|---|
| CZT HV Monitor | 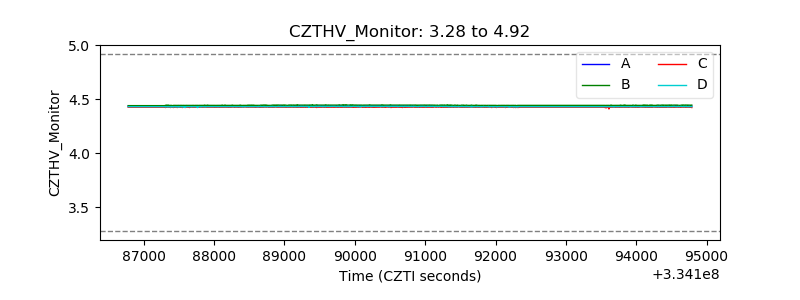 |
| D_VDD | 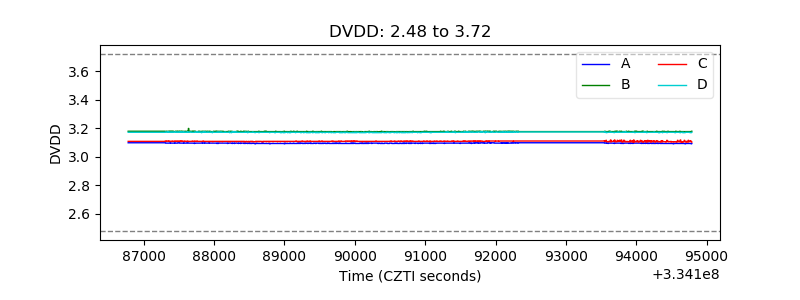 |
| Temperature 1 | 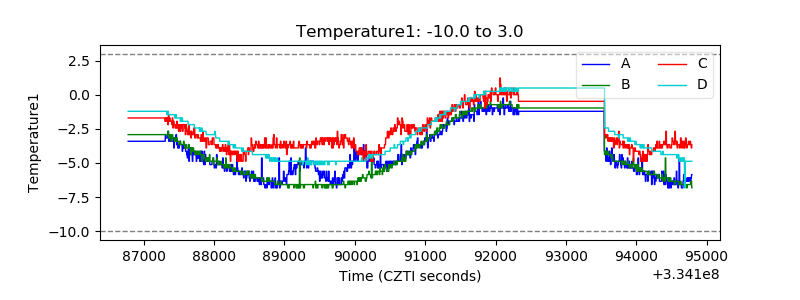 |
| Veto HV Monitor |  |
| Veto LLD | 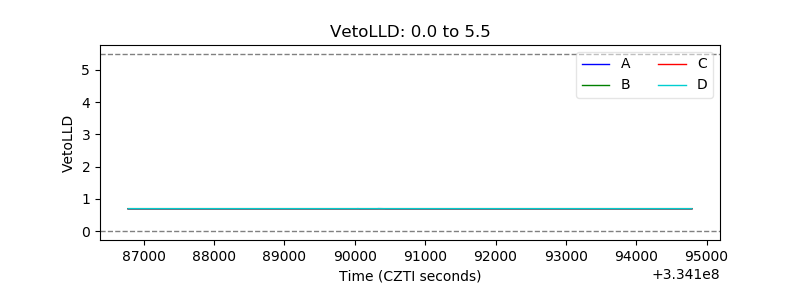 |
| Alpha Counter | 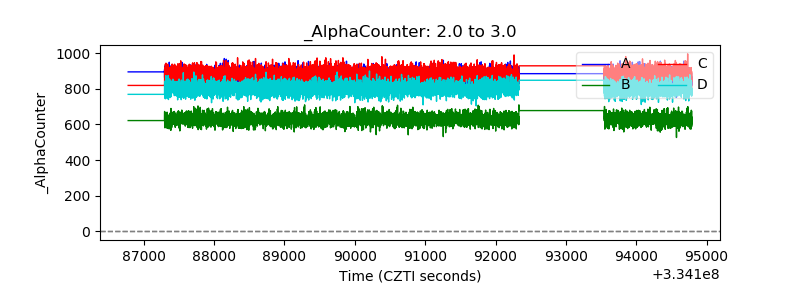 |
| _CPM_Rate | 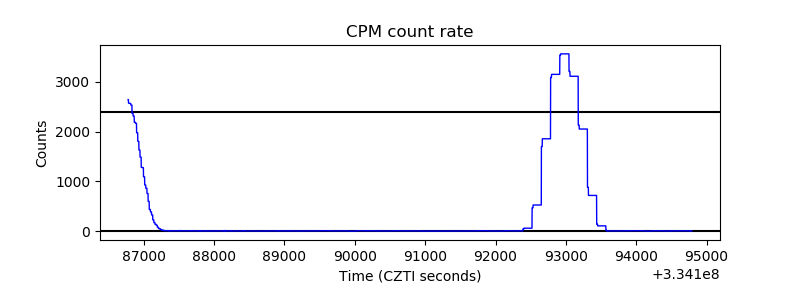 |
| CZT Counter | 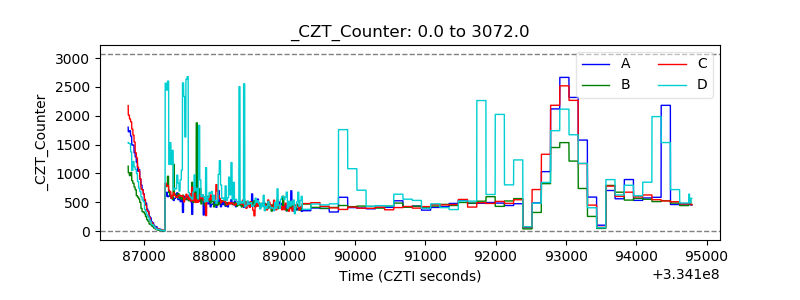 |
| +2.5 Volts monitor |  |
| +5 Volts monitor |  |
| _ROLL_ROT |  |
| _Roll_DEC | 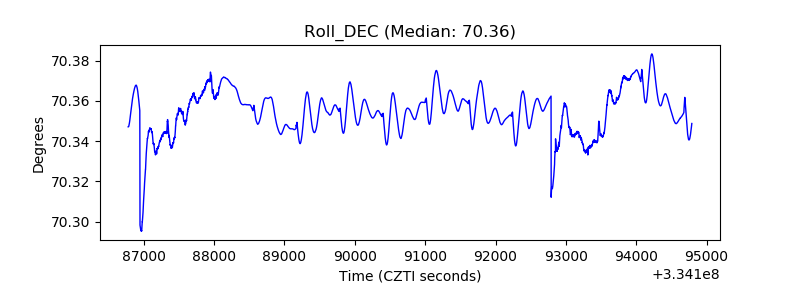 |
| _Roll_RA | 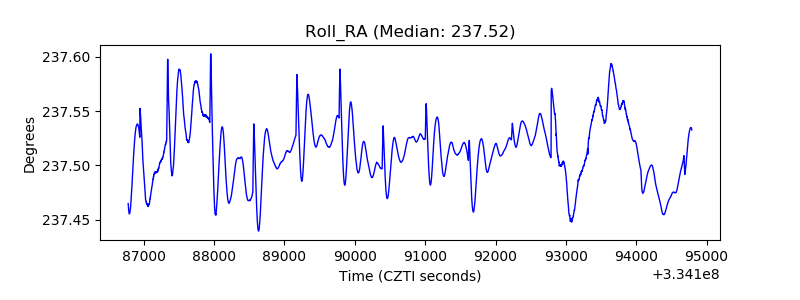 |
| Veto Counter |  |