| Param | Original file | Final file |
|---|---|---|
| Filename | modeM0/AS1C05_019T04_9000003788_26227cztM0_level2.evt | modeM0/AS1C05_019T04_9000003788_26227cztM0_level2_quad_clean.evt |
| Size (bytes) | 412,755,840 | 101,422,080 |
| Size | 393.6 MB | 96.7 MB |
| Events in quadrant A | 2,676,962 | 694,748 |
| Events in quadrant B | 2,430,614 | 722,890 |
| Events in quadrant C | 2,441,299 | 685,688 |
| Events in quadrant D | 4,612,778 | 618,856 |
| Mode M9 | |||
|---|---|---|---|
| Quadrant | BADHDUFLAG | Total packets | Discarded packets |
| A | 0 | 8 | 0 |
| B | 0 | 9 | 0 |
| C | 0 | 9 | 0 |
| D | 0 | 9 | 0 |
| Mode M0 | |||
|---|---|---|---|
| Quadrant | BADHDUFLAG | Total packets | Discarded packets |
| A | 0 | 11227 | 0 |
| B | 0 | 10370 | 0 |
| C | 0 | 10444 | 0 |
| D | 0 | 17221 | 0 |
| Quadrant | Total seconds | Saturated seconds | Saturation percentage |
|---|---|---|---|
| A | 4980 | 78 | 1.566265% |
| B | 4980 | 43 | 0.863454% |
| C | 4980 | 60 | 1.204819% |
| D | 4980 | 615 | 12.349398% |
Noise dominated data is calculated using 1-second bins in cleaned event files. If a bin has >2000 counts, and if more than 50% of those come from <1% of pixels, then it is considered to be noise-dominated and hence unusable.
| Quadrant | # 1 sec bins | Bins with >0 counts | Bins with >2000 counts | High rate bins dominated by noise | Noise dominated (total time) | Noise dominated (detector-on time) | Marked lightcurve |
|---|---|---|---|---|---|---|---|
| A | 4980 | 4980 | 45 | 45 | 0.90% | 0.90% | 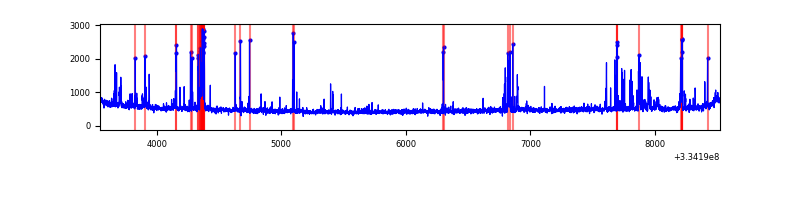 |
| B | 4980 | 4980 | 1 | 1 | 0.02% | 0.02% | 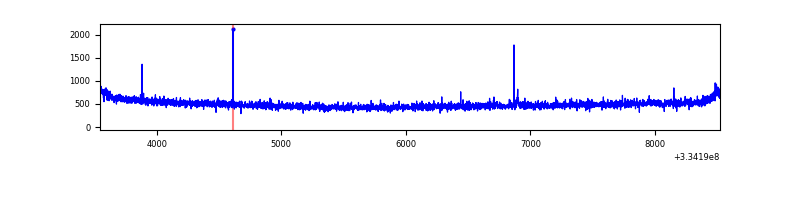 |
| C | 4980 | 4980 | 0 | 0 | 0.00% | 0.00% | 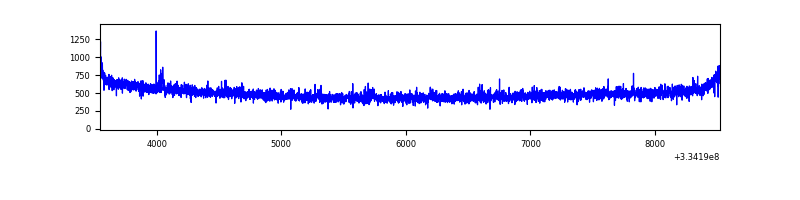 |
| D | 4980 | 4980 | 552 | 552 | 11.08% | 11.08% | 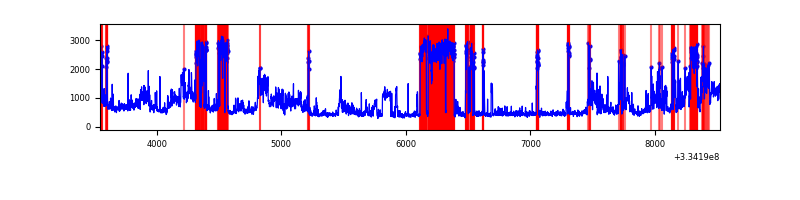 |
Top three noisy pixels from each quadrant. If the there are fewer than three noisy pixels in the level2.evt file, extra rows are filled as -1
| Pixel properties | Quadrant properties | ||||||
|---|---|---|---|---|---|---|---|
| Quadrant | DetID | PixID | Counts | Sigma | Mean | Median | Sigma |
| A | 0 | 13 | 316207 | 2587.13 | 612 | 601 | 122.0 |
| A | 13 | 254 | 8071 | 61.23 | 612 | 601 | 122.0 |
| A | 0 | 226 | 5339 | 38.84 | 612 | 601 | 122.0 |
| B | 12 | 111 | 13338 | 109.46 | 617 | 600 | 116.4 |
| B | 11 | 111 | 12011 | 98.06 | 617 | 600 | 116.4 |
| B | 0 | 190 | 10905 | 88.56 | 617 | 600 | 116.4 |
| C | 14 | 238 | 97152 | 704.23 | 591 | 595 | 137.1 |
| C | 3 | 233 | 11730 | 81.21 | 591 | 595 | 137.1 |
| C | 8 | 128 | 9507 | 65.0 | 591 | 595 | 137.1 |
| D | 1 | 52 | 2294433 | 17256.57 | 558 | 545 | 132.9 |
| D | 13 | 174 | 109117 | 816.77 | 558 | 545 | 132.9 |
| D | 12 | 233 | 72531 | 541.54 | 558 | 545 | 132.9 |
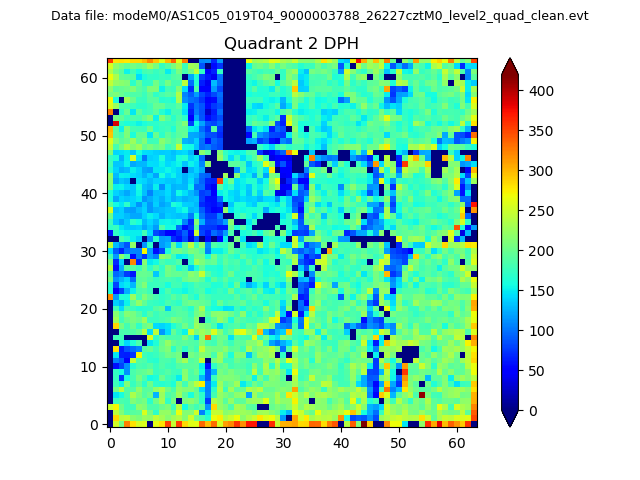
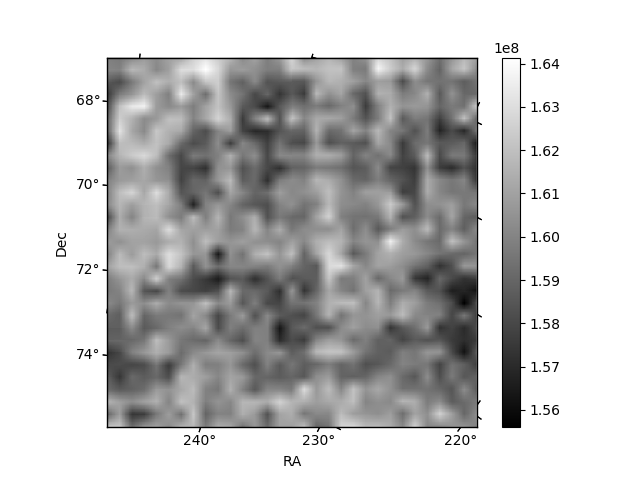
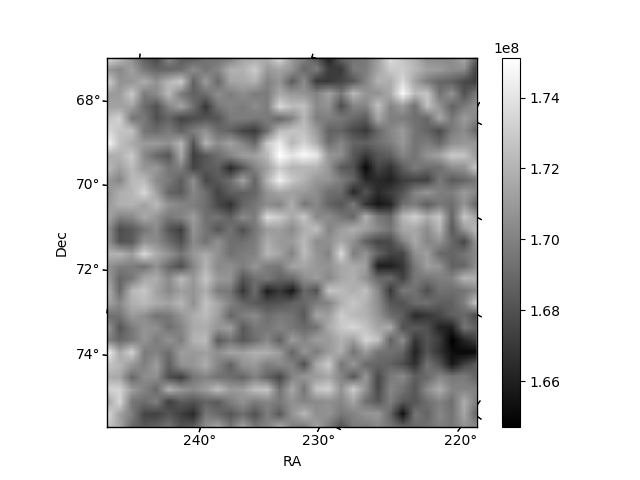
Histogram calculated using DETX and DETY for each event in the final _common_clean file
| Quadrant A | 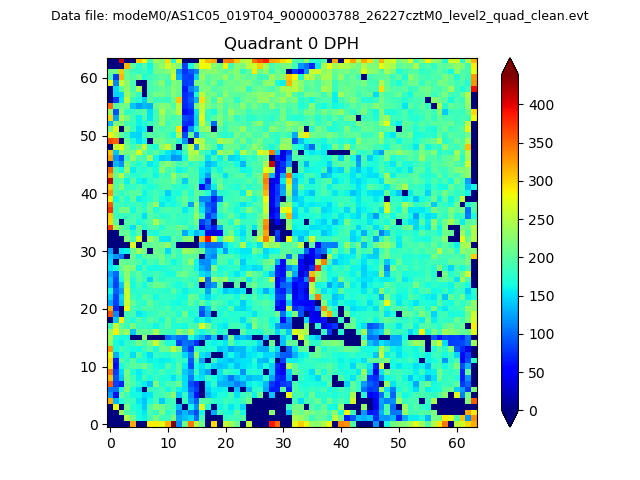 |
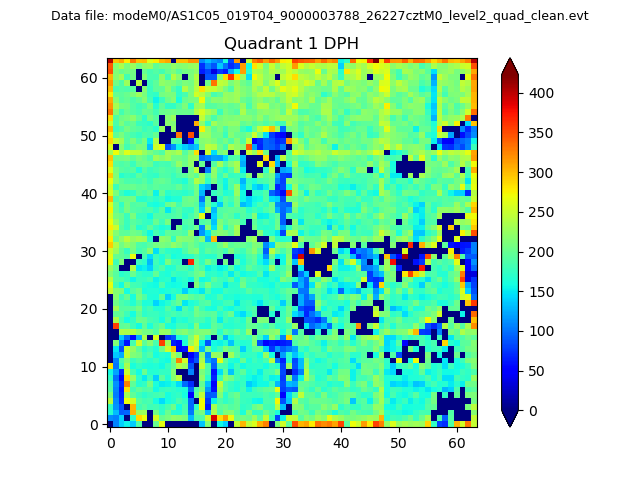 |
Quadrant B |
|---|---|---|---|
| Quadrant D | 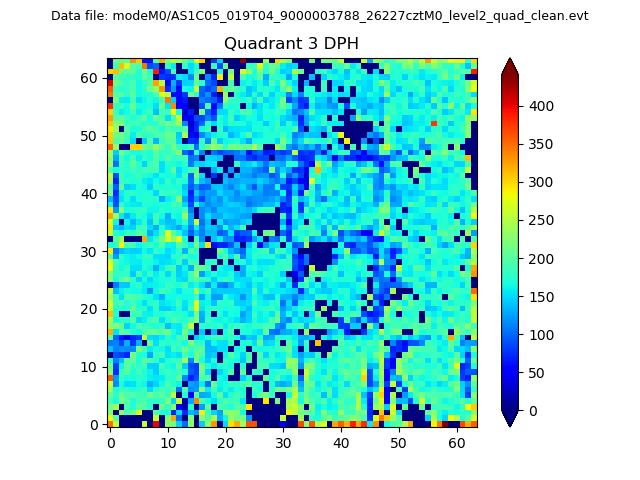 |
 |
Quadrant C |
| Plot type | Count rate plots | Images |
|---|---|---|
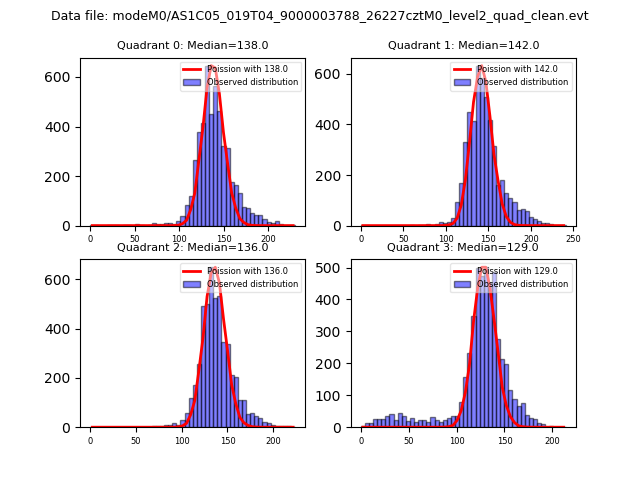
| Comparison with Poisson distribution Blue bars denote a histogram of data divided into 1 sec bins. Red curve is a Poisson curve with rate = median count rate of data. |
 |
 |
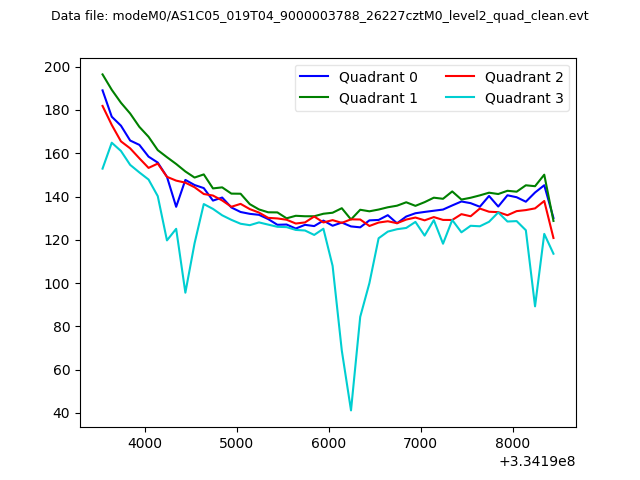
| Quadrant-wise count rates Data is divided into 100 sec bins |
 |
|
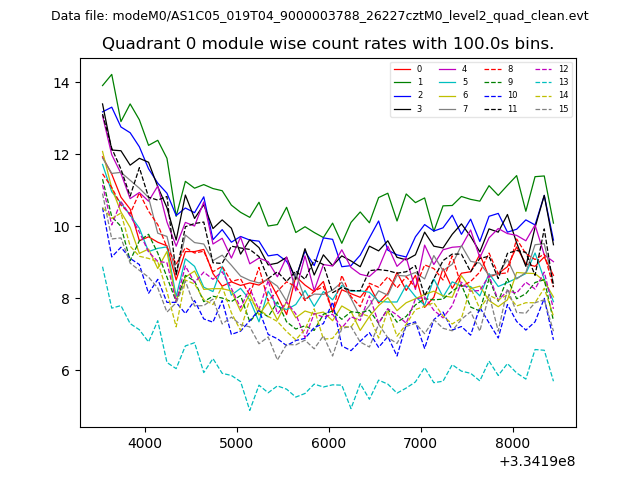
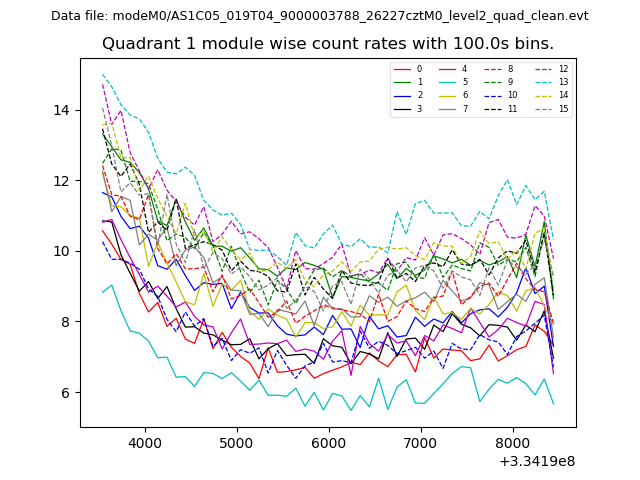
| Module-wise count rates for Quadrant A Data is divided into 100 sec bins |
 |
 |
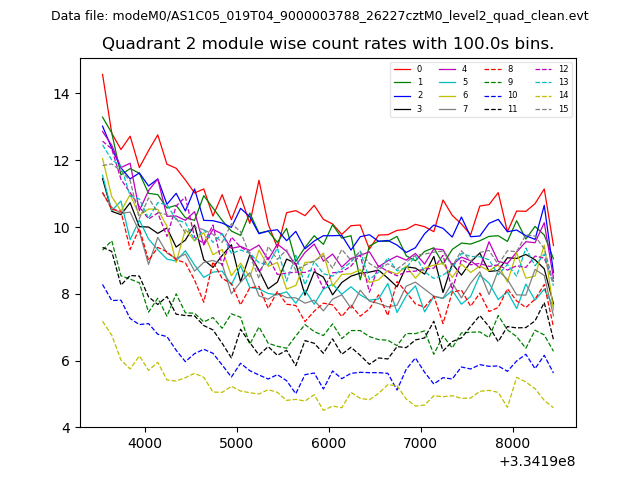
| Module-wise count rates for Quadrant B Data is divided into 100 sec bins |
 |
 |
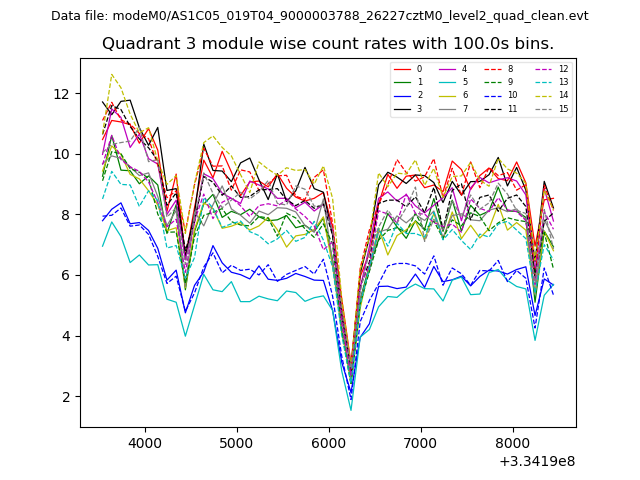
| Module-wise count rates for Quadrant C Data is divided into 100 sec bins |
 |
 |
| Module-wise count rates for Quadrant D Data is divided into 100 sec bins |
 |
 |
| Parameter | Plot |
|---|---|
| CZT HV Monitor | 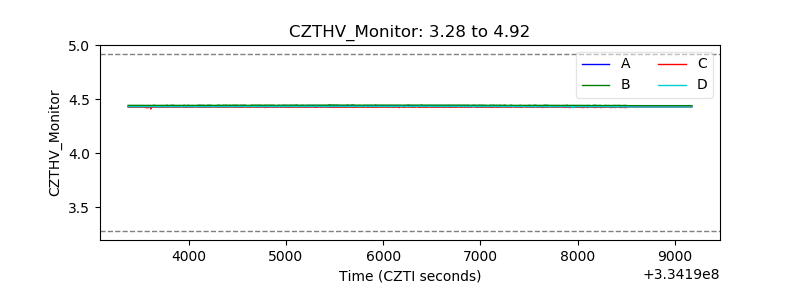 |
| D_VDD | 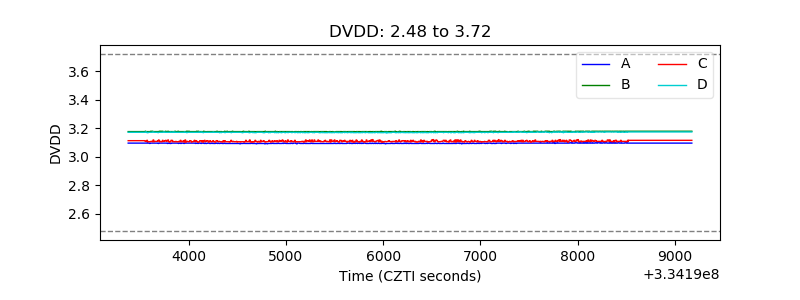 |
| Temperature 1 | 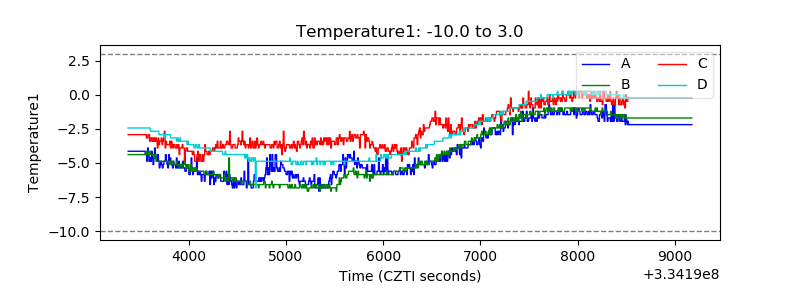 |
| Veto HV Monitor | 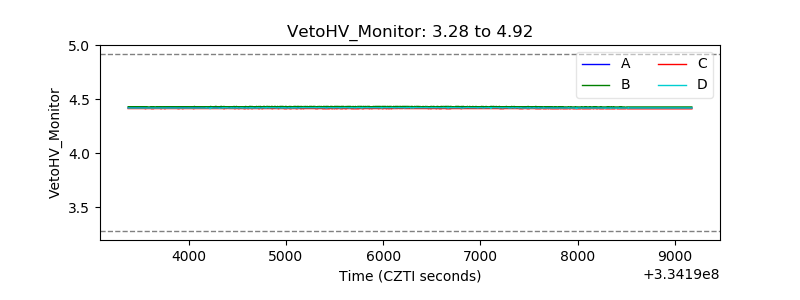 |
| Veto LLD | 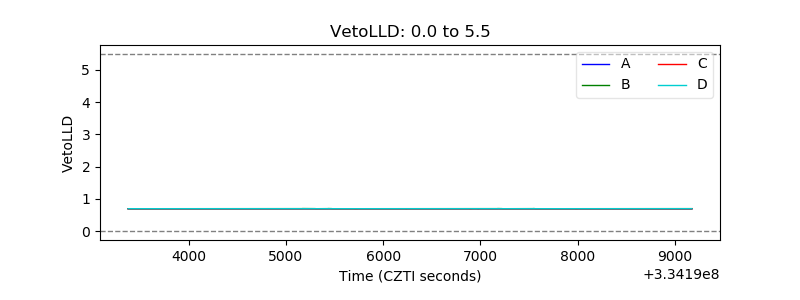 |
| Alpha Counter | 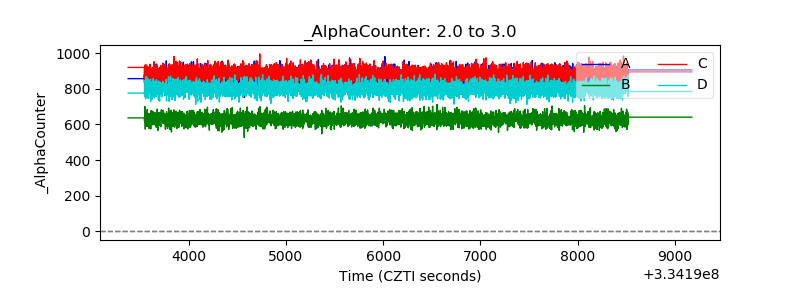 |
| _CPM_Rate | 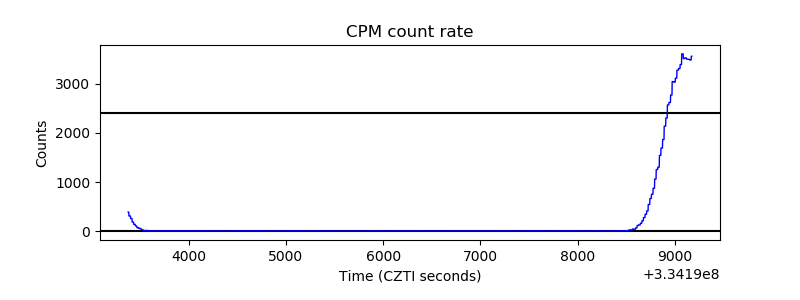 |
| CZT Counter | 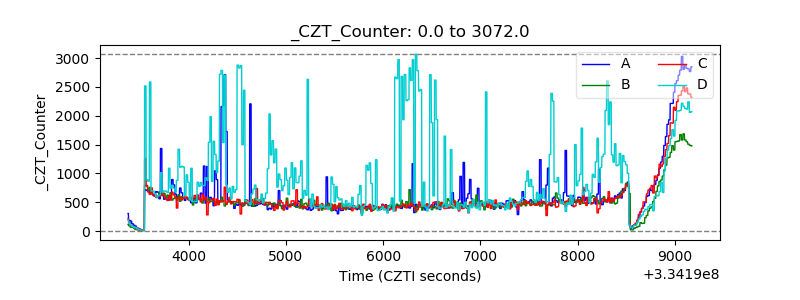 |
| +2.5 Volts monitor |  |
| +5 Volts monitor |  |
| _ROLL_ROT | 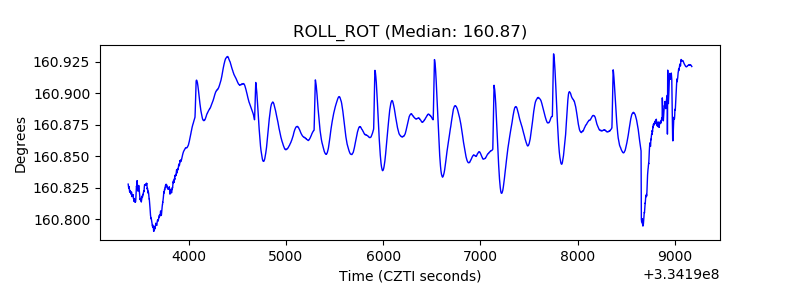 |
| _Roll_DEC | 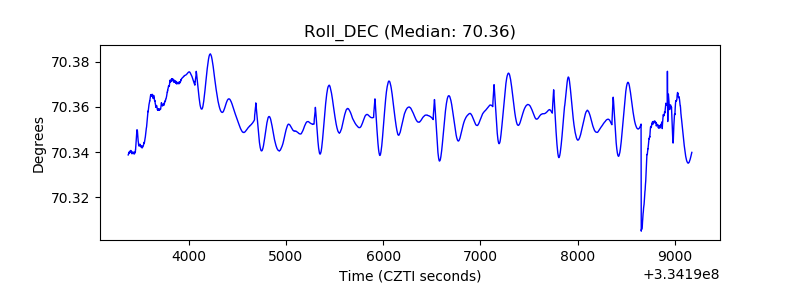 |
| _Roll_RA | 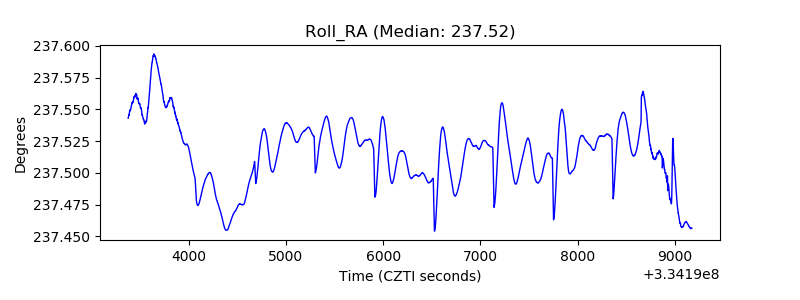 |
| Veto Counter | 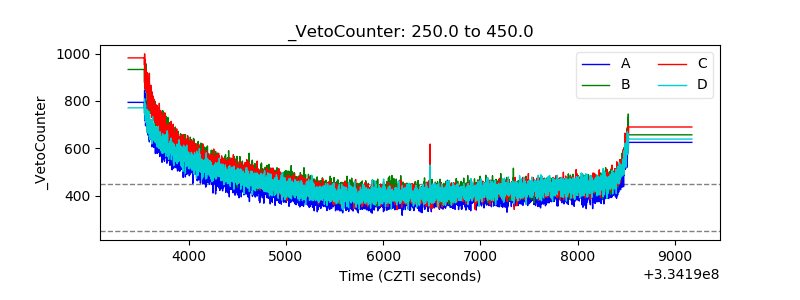 |