| Param | Original file | Final file |
|---|---|---|
| Filename | modeM0/AS1A09_079T03_9000003790cztM0_level2.fits | modeM0/AS1A09_079T03_9000003790cztM0_level2_quad_clean.evt |
| Size (bytes) | 2,858,080,320 | 2,695,924,800 |
| Size | 2.7 GB | 2.5 GB |
| Events in quadrant A | 17,539,714 | 15,861,114 |
| Events in quadrant B | 17,003,148 | 16,213,962 |
| Events in quadrant C | 17,169,876 | 15,556,363 |
| Events in quadrant D | 14,921,256 | 14,101,674 |
| Mode SS | |||
|---|---|---|---|
| Quadrant | BADHDUFLAG | Total packets | Discarded packets |
| A | 0 | 5912 | 0 |
| B | 0 | 5910 | 0 |
| C | 0 | 5912 | 0 |
| D | 0 | 5912 | 0 |
| Mode M0 | |||
|---|---|---|---|
| Quadrant | BADHDUFLAG | Total packets | Discarded packets |
| A | 0 | 633536 | 0 |
| B | 0 | 619116 | 0 |
| C | 0 | 680553 | 0 |
| D | 0 | 719964 | 0 |
| Mode M9 | |||
|---|---|---|---|
| Quadrant | BADHDUFLAG | Total packets | Discarded packets |
| A | 0 | 467 | 0 |
| B | 0 | 467 | 0 |
| C | 0 | 467 | 0 |
| D | 0 | 467 | 0 |
| Quadrant | Total seconds | Saturated seconds | Saturation percentage |
|---|---|---|---|
| A | 290858 | 5055 | 1.737961% |
| B | 290854 | 4702 | 1.616619% |
| C | 290859 | 11965 | 4.113677% |
| D | 290853 | 10977 | 3.774071% |
Noise dominated data is calculated using 1-second bins in cleaned event files. If a bin has >2000 counts, and if more than 50% of those come from <1% of pixels, then it is considered to be noise-dominated and hence unusable.
| Quadrant | # 1 sec bins | Bins with >0 counts | Bins with >2000 counts | High rate bins dominated by noise | Noise dominated (total time) | Noise dominated (detector-on time) | Marked lightcurve |
|---|---|---|---|---|---|---|---|
| A | 336917 | 290858 | 0 | 0 | 0.00% | 0.00% | 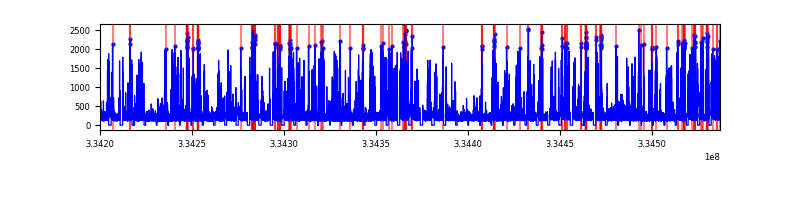 |
| B | 336917 | 290840 | 0 | 0 | 0.00% | 0.00% | 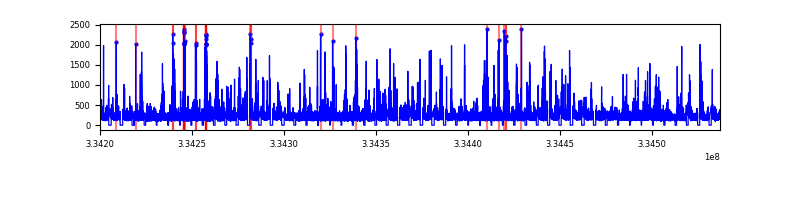 |
| C | 336917 | 290752 | 0 | 0 | 0.00% | 0.00% | 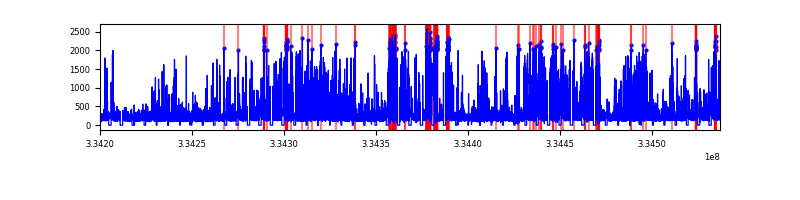 |
| D | 336916 | 290664 | 0 | 0 | 0.00% | 0.00% |  |
Top three noisy pixels from each quadrant. If the there are fewer than three noisy pixels in the level2.evt file, extra rows are filled as -1
| Pixel properties | Quadrant properties | ||||||
|---|---|---|---|---|---|---|---|
| Quadrant | DetID | PixID | Counts | Sigma | Mean | Median | Sigma |
| A | 0 | 29 | 14822 | 9.4 | 4574 | 4290 | 1120.8 |
| A | 7 | 110 | 14416 | 9.03 | 4574 | 4290 | 1120.8 |
| A | 0 | 30 | 13334 | 8.07 | 4574 | 4290 | 1120.8 |
| B | 2 | 9 | 13622 | 10.64 | 4506 | 4305 | 875.6 |
| B | 2 | 8 | 11249 | 7.93 | 4506 | 4305 | 875.6 |
| B | 5 | 128 | 11145 | 7.81 | 4506 | 4305 | 875.6 |
| C | 1 | 80 | 13360 | 7.99 | 4533 | 4237 | 1141.1 |
| C | 1 | 81 | 13243 | 7.89 | 4533 | 4237 | 1141.1 |
| C | 12 | 241 | 11908 | 6.72 | 4533 | 4237 | 1141.1 |
| D | 7 | 3 | 10538 | 5.93 | 4266 | 3890 | 1121.7 |
| D | 6 | 231 | 10447 | 5.85 | 4266 | 3890 | 1121.7 |
| D | 10 | 189 | 10380 | 5.79 | 4266 | 3890 | 1121.7 |
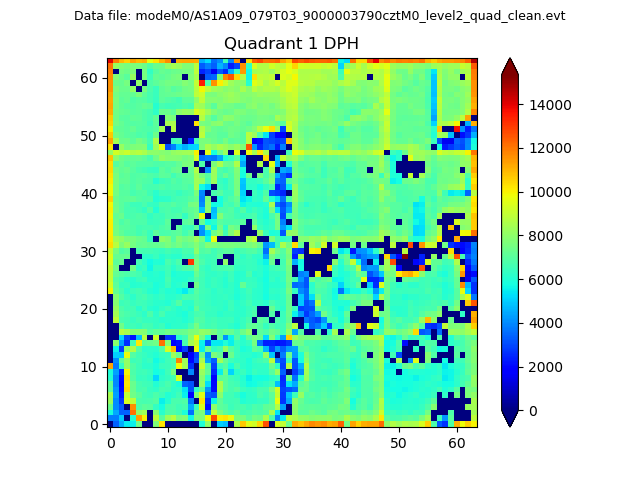
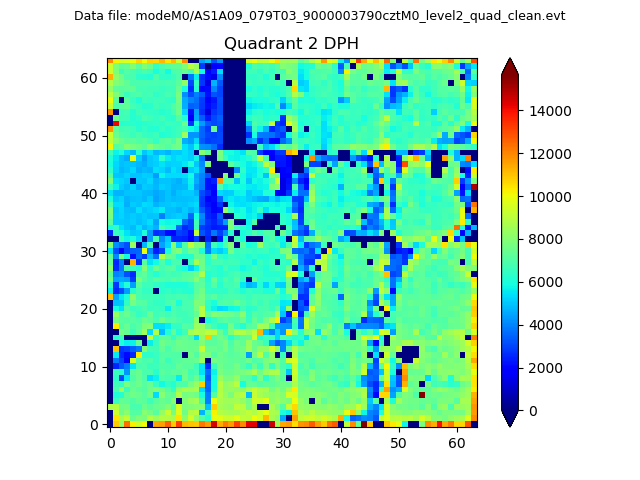
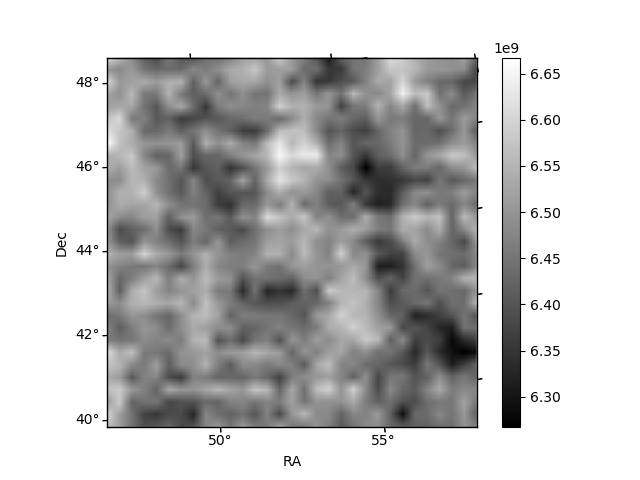
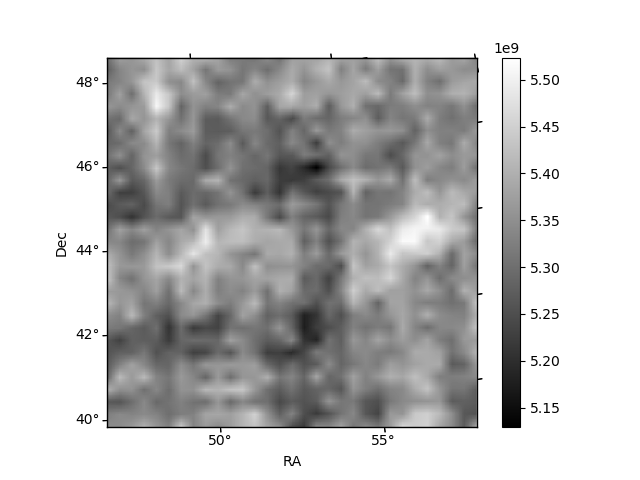
Histogram calculated using DETX and DETY for each event in the final _common_clean file
| Quadrant A | 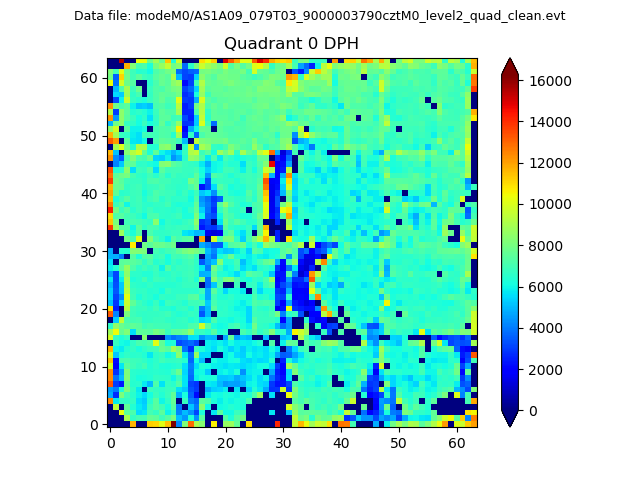 |
 |
Quadrant B |
|---|---|---|---|
| Quadrant D |  |
 |
Quadrant C |
| Plot type | Count rate plots | Images |
|---|---|---|
| Comparison with Poisson distribution Blue bars denote a histogram of data divided into 1 sec bins. Red curve is a Poisson curve with rate = median count rate of data. |
 |
 |
| Quadrant-wise count rates Data is divided into 100 sec bins |
 |
|
| Module-wise count rates for Quadrant A Data is divided into 100 sec bins |
 |
 |
| Module-wise count rates for Quadrant B Data is divided into 100 sec bins |
 |
 |
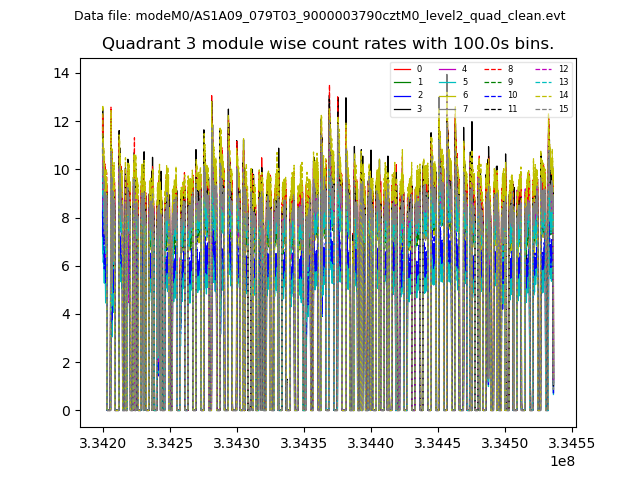
| Module-wise count rates for Quadrant C Data is divided into 100 sec bins |
 |
 |
| Module-wise count rates for Quadrant D Data is divided into 100 sec bins |
 |
 |
| Parameter | Plot |
|---|---|
| CZT HV Monitor |  |
| D_VDD | 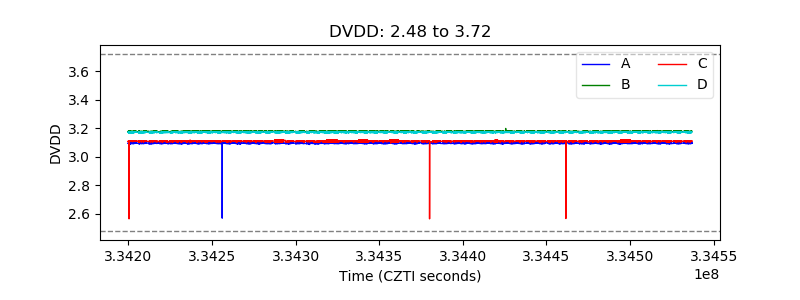 |
| Temperature 1 | 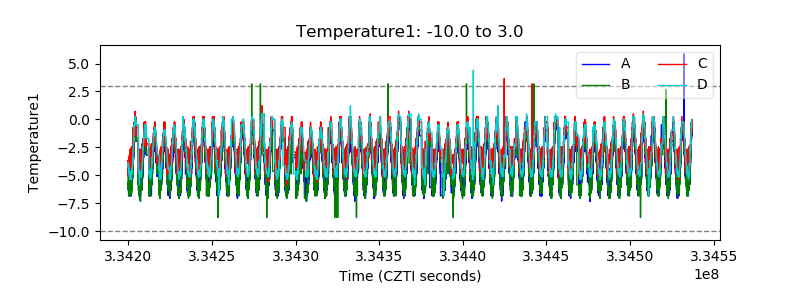 |
| Veto HV Monitor | 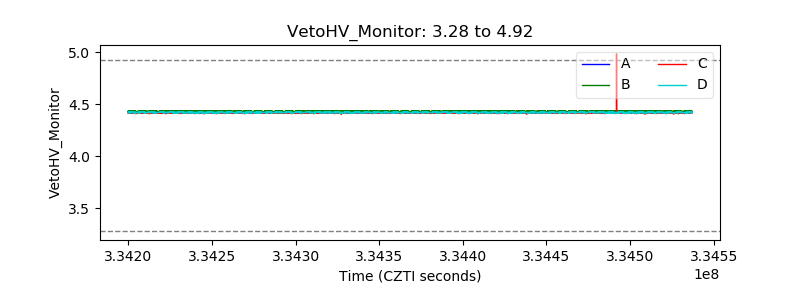 |
| Veto LLD |  |
| Alpha Counter | 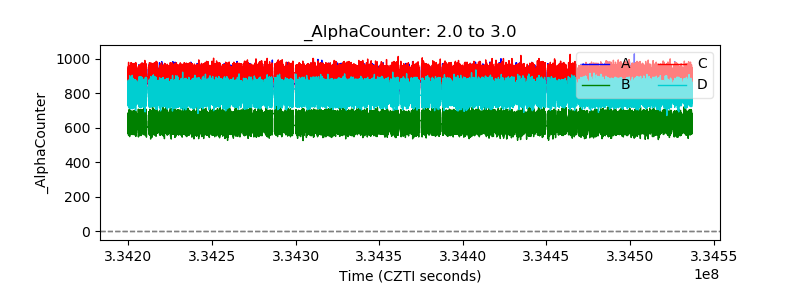 |
| _CPM_Rate | 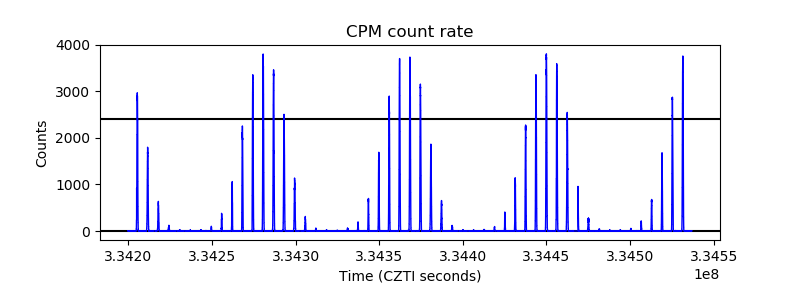 |
| CZT Counter |  |
| +2.5 Volts monitor |  |
| +5 Volts monitor |  |
| _ROLL_ROT | 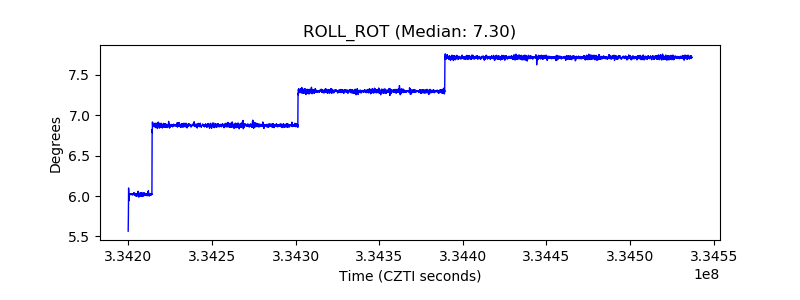 |
| _Roll_DEC | 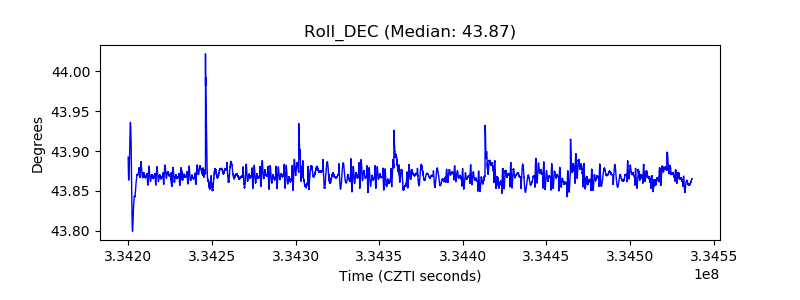 |
| _Roll_RA | 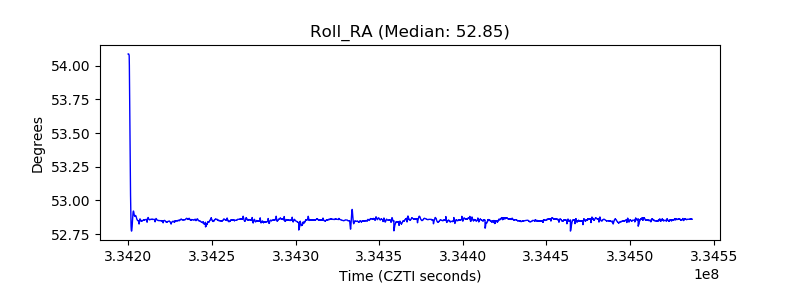 |
| Veto Counter |  |