| Param | Original file | Final file |
|---|---|---|
| Filename | modeM0/AS1A09_079T03_9000003790_26227cztM0_level2.evt | modeM0/AS1A09_079T03_9000003790_26227cztM0_level2_quad_clean.evt |
| Size (bytes) | 84,680,640 | 25,767,360 |
| Size | 80.8 MB | 24.6 MB |
| Events in quadrant A | 580,409 | 176,072 |
| Events in quadrant B | 592,400 | 184,122 |
| Events in quadrant C | 587,339 | 172,769 |
| Events in quadrant D | 728,194 | 164,678 |
| Mode M0 | |||
|---|---|---|---|
| Quadrant | BADHDUFLAG | Total packets | Discarded packets |
| A | 0 | 2343 | 0 |
| B | 0 | 2403 | 0 |
| C | 0 | 2378 | 0 |
| D | 0 | 2898 | 0 |
| Quadrant | Total seconds | Saturated seconds | Saturation percentage |
|---|---|---|---|
| A | 1083 | 0 | 0.000000% |
| B | 1083 | 2 | 0.184672% |
| C | 1083 | 6 | 0.554017% |
| D | 1083 | 14 | 1.292705% |
Noise dominated data is calculated using 1-second bins in cleaned event files. If a bin has >2000 counts, and if more than 50% of those come from <1% of pixels, then it is considered to be noise-dominated and hence unusable.
| Quadrant | # 1 sec bins | Bins with >0 counts | Bins with >2000 counts | High rate bins dominated by noise | Noise dominated (total time) | Noise dominated (detector-on time) | Marked lightcurve |
|---|---|---|---|---|---|---|---|
| A | 1083 | 1083 | 0 | 0 | 0.00% | 0.00% | 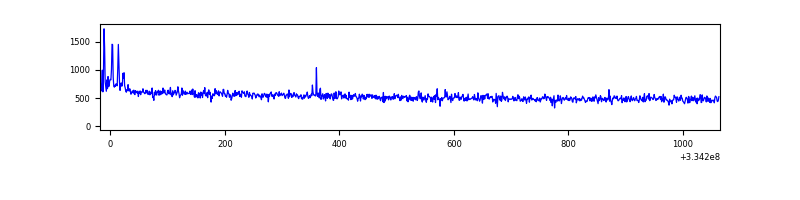 |
| B | 1083 | 1083 | 0 | 0 | 0.00% | 0.00% | 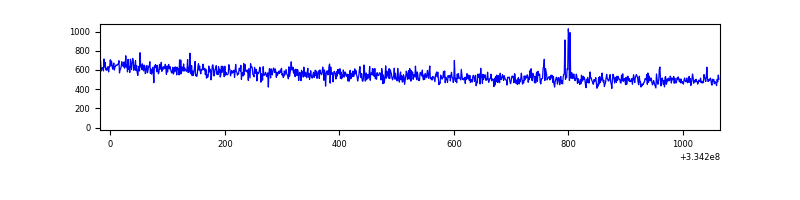 |
| C | 1083 | 1083 | 0 | 0 | 0.00% | 0.00% | 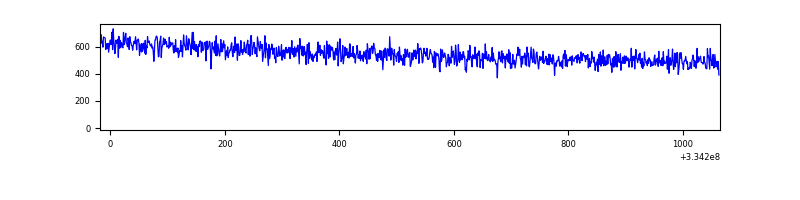 |
| D | 1083 | 1083 | 13 | 13 | 1.20% | 1.20% | 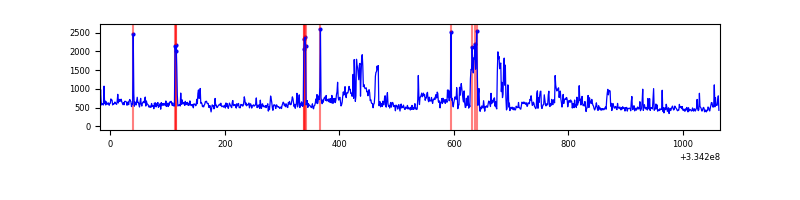 |
Top three noisy pixels from each quadrant. If the there are fewer than three noisy pixels in the level2.evt file, extra rows are filled as -1
| Pixel properties | Quadrant properties | ||||||
|---|---|---|---|---|---|---|---|
| Quadrant | DetID | PixID | Counts | Sigma | Mean | Median | Sigma |
| A | 0 | 13 | 12521 | 399.09 | 147 | 144 | 31.0 |
| A | 13 | 254 | 2018 | 60.41 | 147 | 144 | 31.0 |
| A | 3 | 137 | 1280 | 36.62 | 147 | 144 | 31.0 |
| B | 12 | 111 | 3248 | 103.82 | 151 | 147 | 29.9 |
| B | 11 | 111 | 2808 | 89.09 | 151 | 147 | 29.9 |
| B | 14 | 111 | 2589 | 81.76 | 151 | 147 | 29.9 |
| C | 14 | 238 | 23557 | 662.37 | 144 | 145 | 35.3 |
| C | 13 | 61 | 929 | 22.18 | 144 | 145 | 35.3 |
| C | 3 | 233 | 483 | 9.56 | 144 | 145 | 35.3 |
| D | 1 | 52 | 191226 | 5449.18 | 140 | 136 | 35.1 |
| D | 2 | 120 | 4195 | 115.75 | 140 | 136 | 35.1 |
| D | 2 | 234 | 4166 | 114.92 | 140 | 136 | 35.1 |
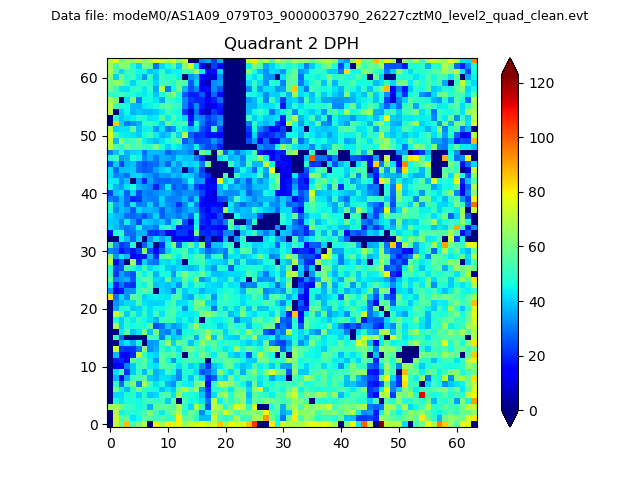
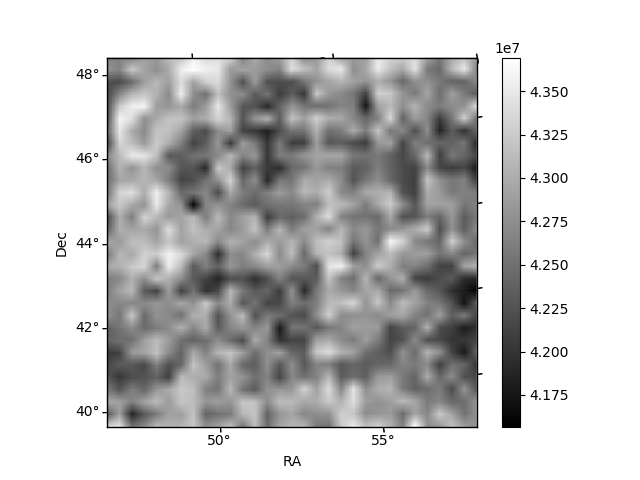
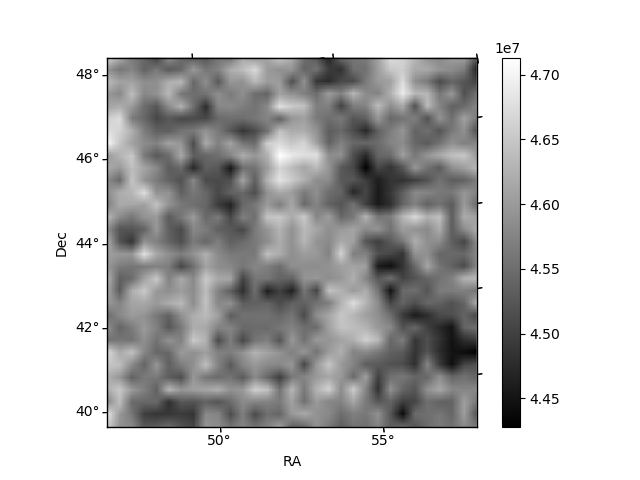
Histogram calculated using DETX and DETY for each event in the final _common_clean file
| Quadrant A |  |
 |
Quadrant B |
|---|---|---|---|
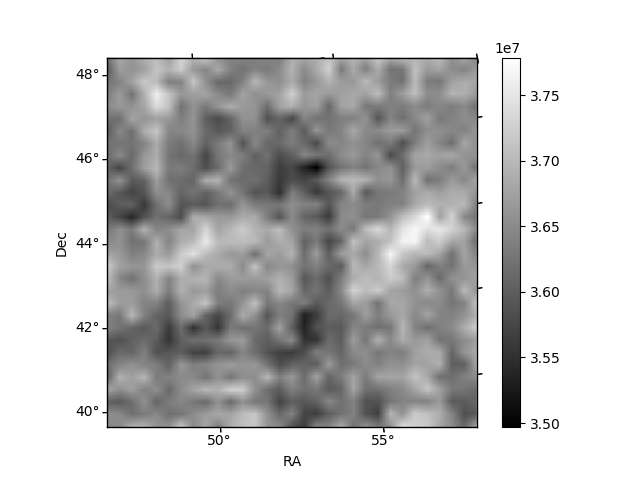
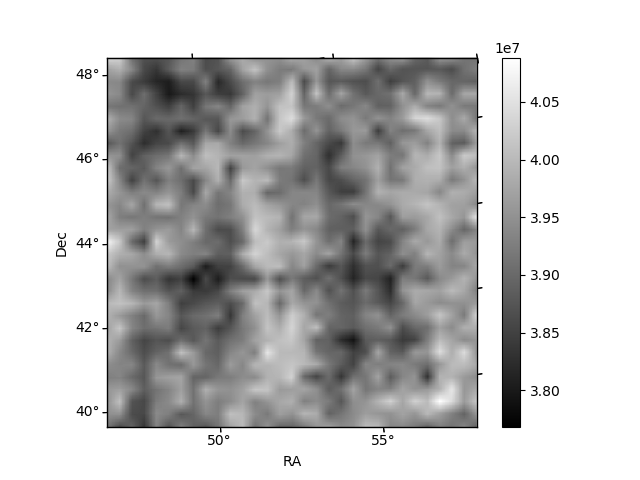
| Quadrant D |  |
 |
Quadrant C |
| Plot type | Count rate plots | Images |
|---|---|---|
| Comparison with Poisson distribution Blue bars denote a histogram of data divided into 1 sec bins. Red curve is a Poisson curve with rate = median count rate of data. |
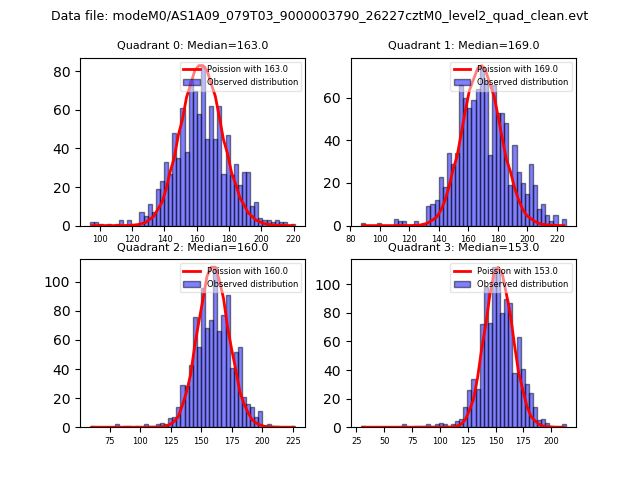 |
 |
| Quadrant-wise count rates Data is divided into 100 sec bins |
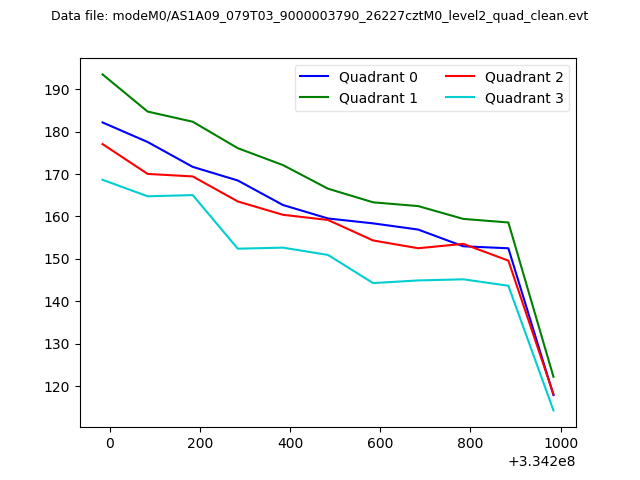 |
|
| Module-wise count rates for Quadrant A Data is divided into 100 sec bins |
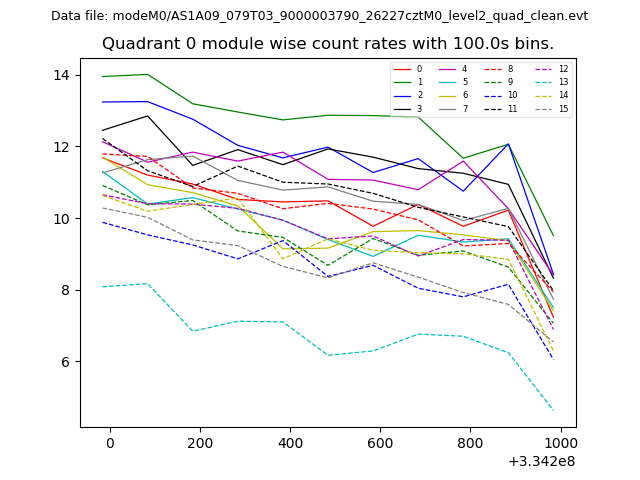 |
 |
| Module-wise count rates for Quadrant B Data is divided into 100 sec bins |
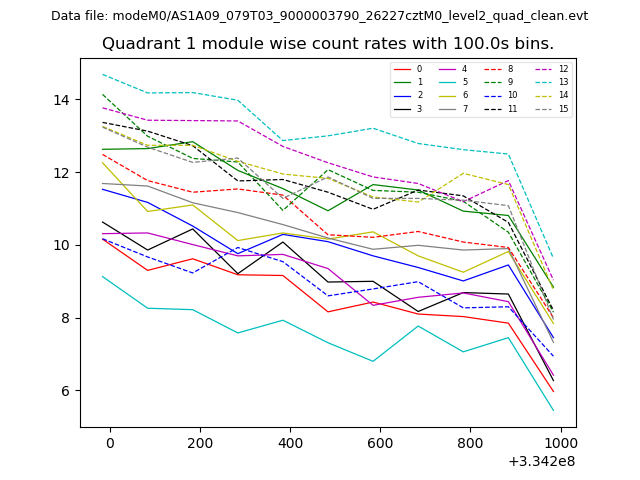 |
 |
| Module-wise count rates for Quadrant C Data is divided into 100 sec bins |
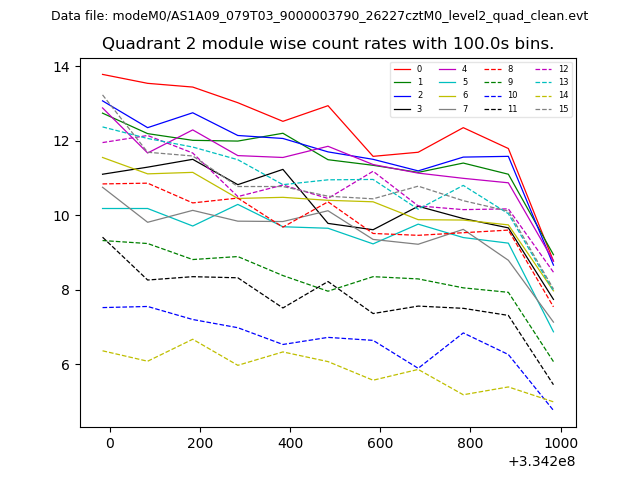 |
 |
| Module-wise count rates for Quadrant D Data is divided into 100 sec bins |
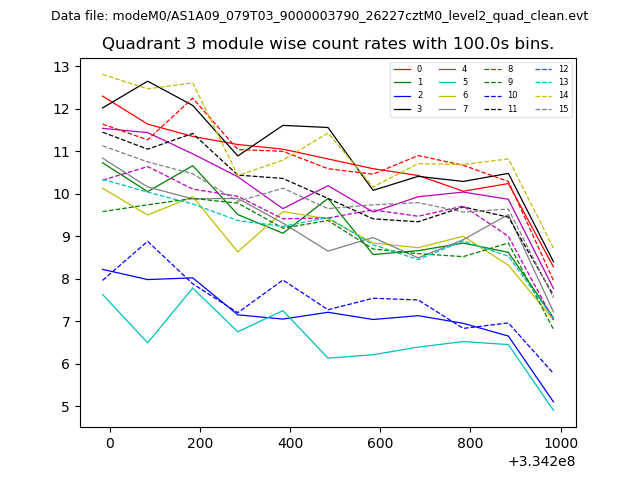 |
 |
| Parameter | Plot |
|---|---|
| CZT HV Monitor | 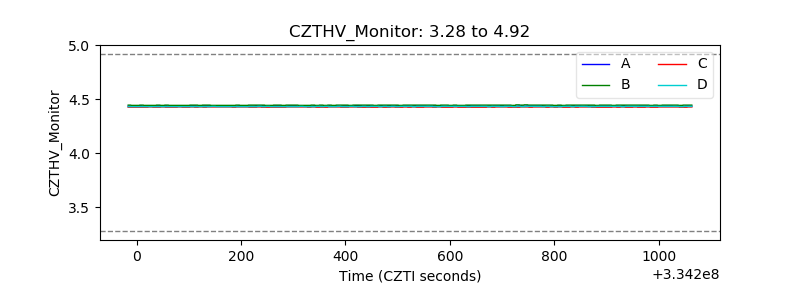 |
| D_VDD | 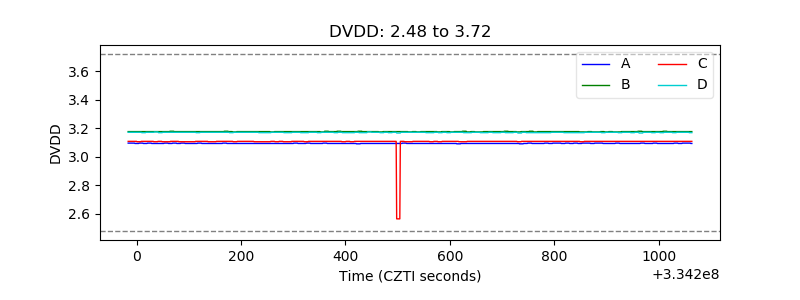 |
| Temperature 1 | 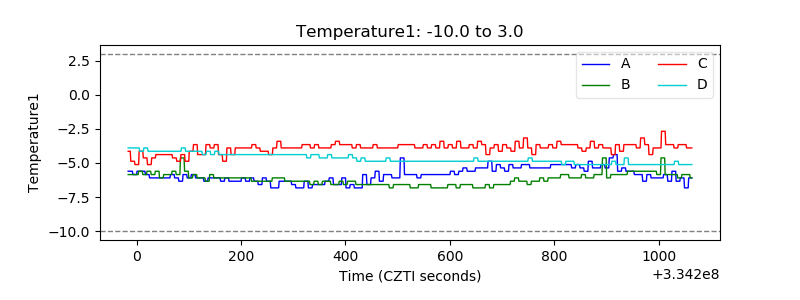 |
| Veto HV Monitor | 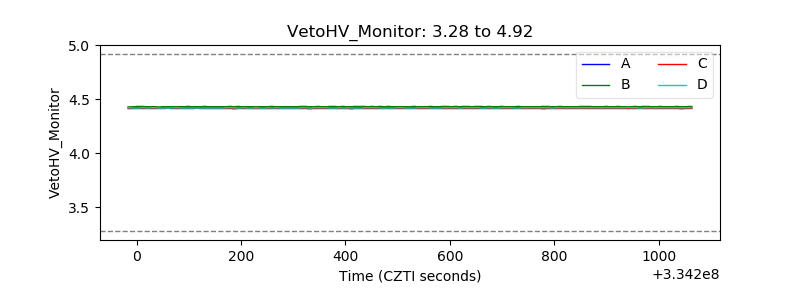 |
| Veto LLD |  |
| Alpha Counter | 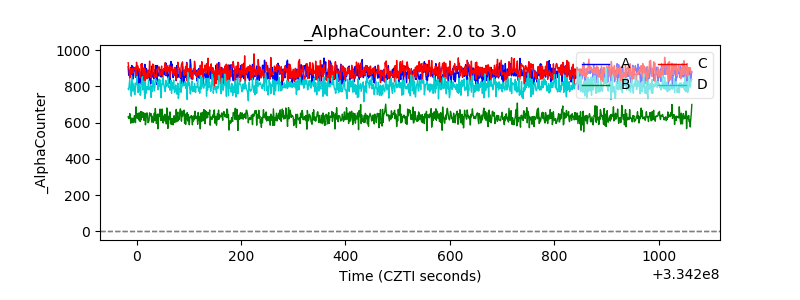 |
| _CPM_Rate | 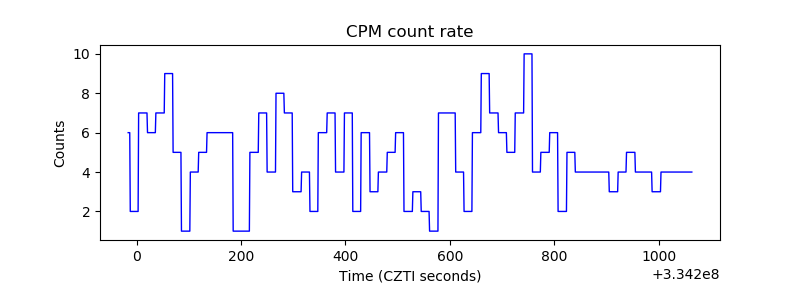 |
| CZT Counter | 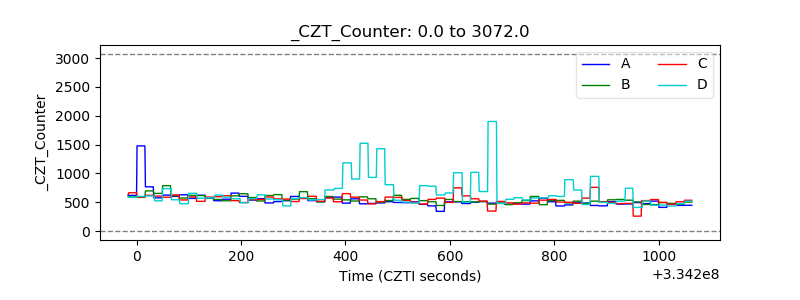 |
| +2.5 Volts monitor |  |
| +5 Volts monitor | 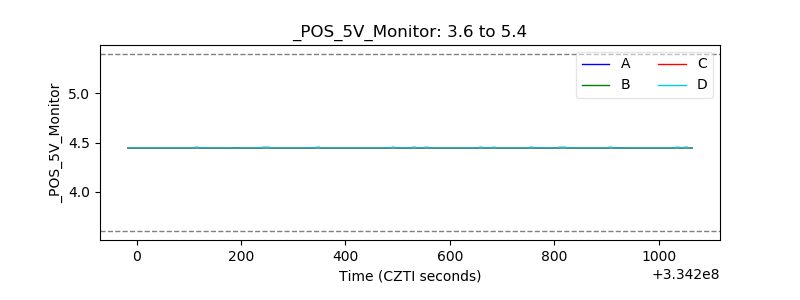 |
| _ROLL_ROT | 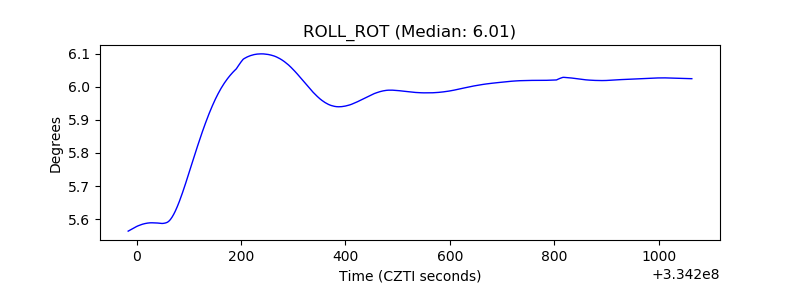 |
| _Roll_DEC | 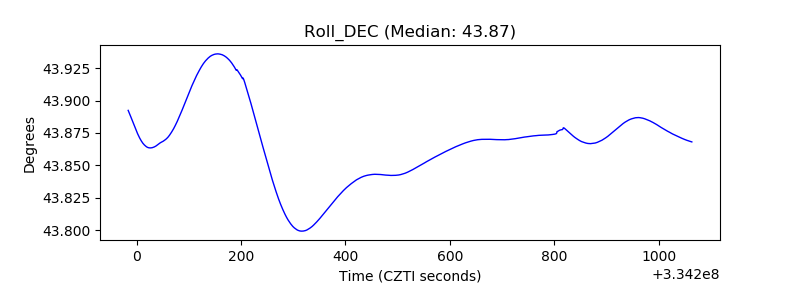 |
| _Roll_RA | 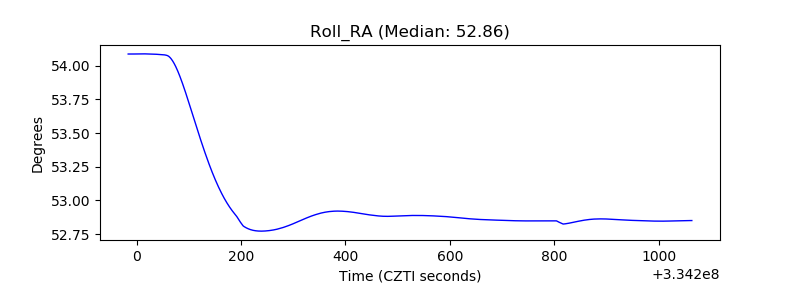 |
| Veto Counter | 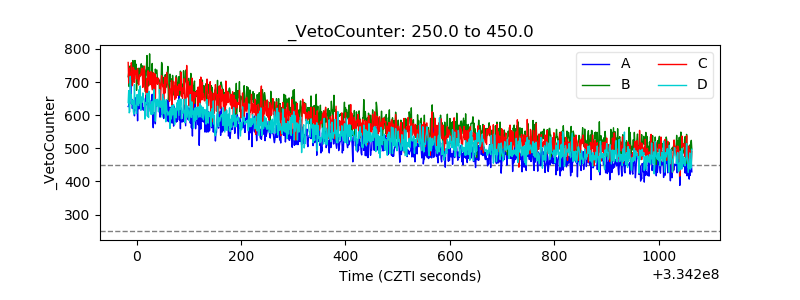 |