| Param | Original file | Final file |
|---|---|---|
| Filename | modeM0/AS1A09_079T03_9000003790_26228cztM0_level2.evt | modeM0/AS1A09_079T03_9000003790_26228cztM0_level2_quad_clean.evt |
| Size (bytes) | 508,815,360 | 109,598,400 |
| Size | 485.2 MB | 104.5 MB |
| Events in quadrant A | 3,245,613 | 734,686 |
| Events in quadrant B | 3,209,789 | 763,531 |
| Events in quadrant C | 3,425,744 | 724,526 |
| Events in quadrant D | 5,100,227 | 656,152 |
| Mode M0 | |||
|---|---|---|---|
| Quadrant | BADHDUFLAG | Total packets | Discarded packets |
| A | 0 | 13573 | 0 |
| B | 0 | 13406 | 0 |
| C | 0 | 14175 | 0 |
| D | 0 | 19337 | 0 |
| Mode M9 | |||
|---|---|---|---|
| Quadrant | BADHDUFLAG | Total packets | Discarded packets |
| A | 0 | 13 | 0 |
| B | 0 | 13 | 0 |
| C | 0 | 13 | 0 |
| D | 0 | 13 | 0 |
| Quadrant | Total seconds | Saturated seconds | Saturation percentage |
|---|---|---|---|
| A | 6309 | 53 | 0.840070% |
| B | 6309 | 47 | 0.744968% |
| C | 6309 | 105 | 1.664289% |
| D | 6309 | 540 | 8.559201% |
Noise dominated data is calculated using 1-second bins in cleaned event files. If a bin has >2000 counts, and if more than 50% of those come from <1% of pixels, then it is considered to be noise-dominated and hence unusable.
| Quadrant | # 1 sec bins | Bins with >0 counts | Bins with >2000 counts | High rate bins dominated by noise | Noise dominated (total time) | Noise dominated (detector-on time) | Marked lightcurve |
|---|---|---|---|---|---|---|---|
| A | 7654 | 6310 | 12 | 12 | 0.16% | 0.19% | 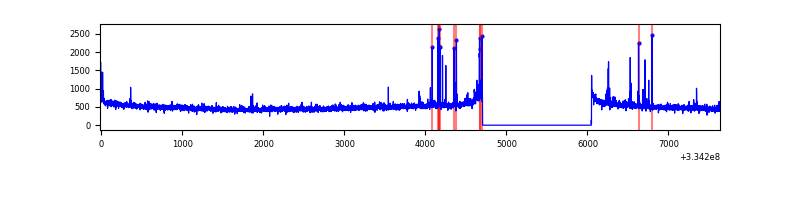 |
| B | 7654 | 6310 | 3 | 3 | 0.04% | 0.05% | 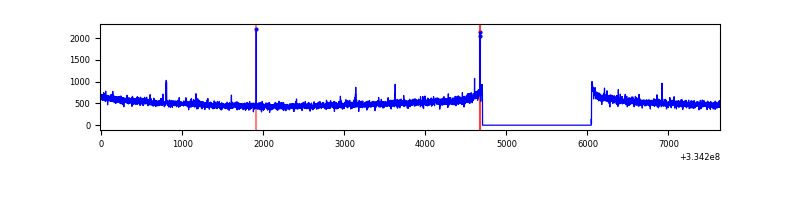 |
| C | 7654 | 6310 | 20 | 20 | 0.26% | 0.32% | 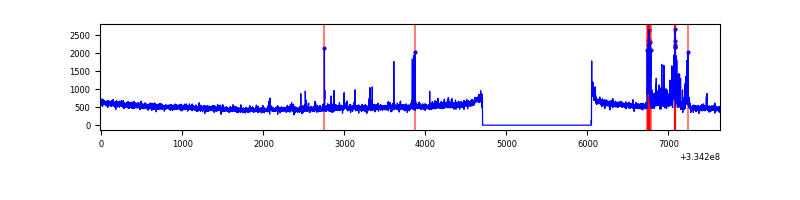 |
| D | 7654 | 6310 | 572 | 572 | 7.47% | 9.06% | 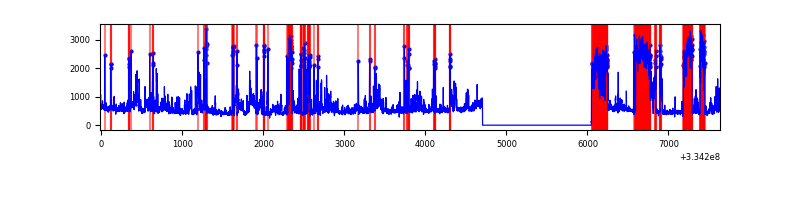 |
Top three noisy pixels from each quadrant. If the there are fewer than three noisy pixels in the level2.evt file, extra rows are filled as -1
| Pixel properties | Quadrant properties | ||||||
|---|---|---|---|---|---|---|---|
| Quadrant | DetID | PixID | Counts | Sigma | Mean | Median | Sigma |
| A | 0 | 13 | 132990 | 829.5 | 807 | 793 | 159.4 |
| A | 13 | 254 | 10807 | 62.84 | 807 | 793 | 159.4 |
| A | 3 | 137 | 7069 | 39.38 | 807 | 793 | 159.4 |
| B | 12 | 111 | 17627 | 110.72 | 816 | 798 | 152.0 |
| B | 11 | 111 | 15480 | 96.59 | 816 | 798 | 152.0 |
| B | 14 | 111 | 13786 | 85.45 | 816 | 798 | 152.0 |
| C | 3 | 233 | 251414 | 1378.15 | 780 | 787 | 181.9 |
| C | 14 | 238 | 126683 | 692.28 | 780 | 787 | 181.9 |
| C | 0 | 10 | 6094 | 29.18 | 780 | 787 | 181.9 |
| D | 1 | 52 | 2217254 | 12467.24 | 747 | 729 | 177.8 |
| D | 2 | 234 | 24449 | 133.42 | 747 | 729 | 177.8 |
| D | 2 | 120 | 19406 | 105.05 | 747 | 729 | 177.8 |
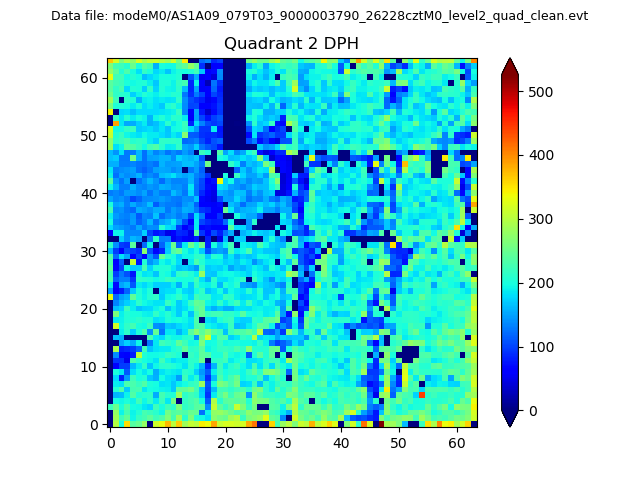
Histogram calculated using DETX and DETY for each event in the final _common_clean file
| Quadrant A |  |
 |
Quadrant B |
|---|---|---|---|
| Quadrant D |  |
 |
Quadrant C |
| Plot type | Count rate plots | Images |
|---|---|---|
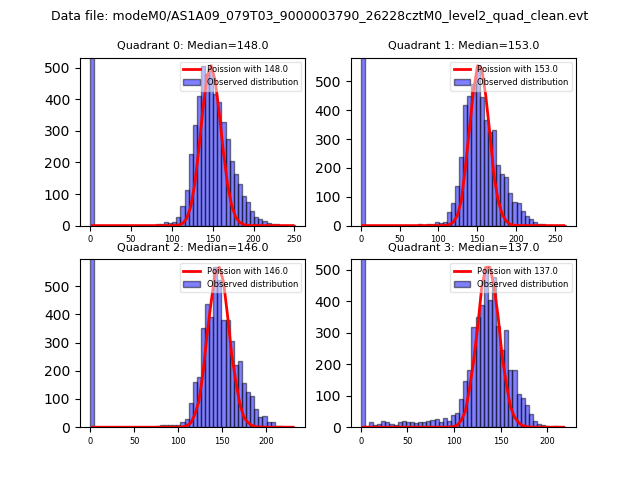
| Comparison with Poisson distribution Blue bars denote a histogram of data divided into 1 sec bins. Red curve is a Poisson curve with rate = median count rate of data. |
 |
 |
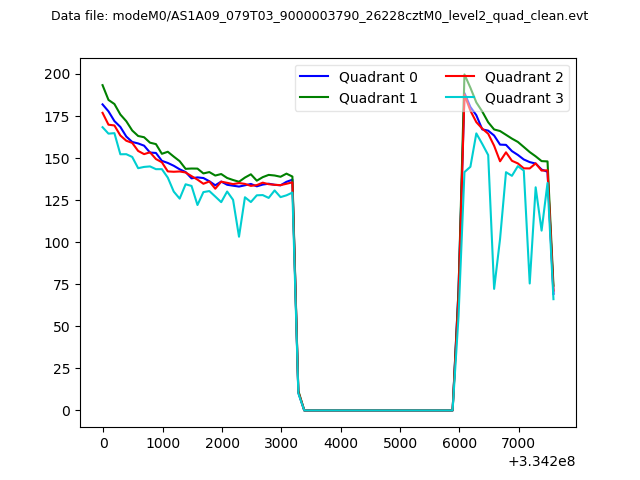
| Quadrant-wise count rates Data is divided into 100 sec bins |
 |
|
| Module-wise count rates for Quadrant A Data is divided into 100 sec bins |
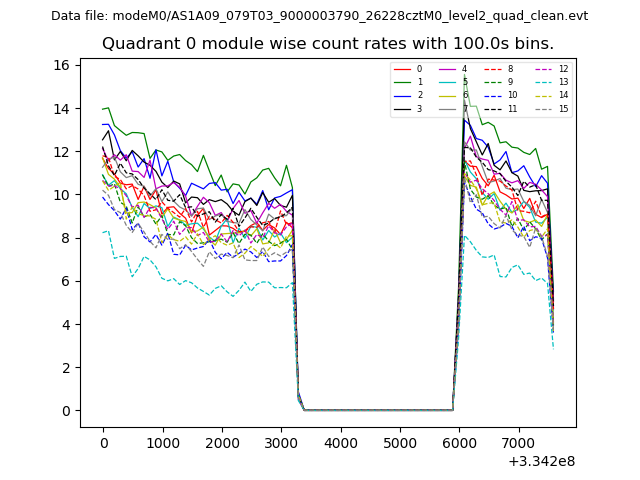 |
 |
| Module-wise count rates for Quadrant B Data is divided into 100 sec bins |
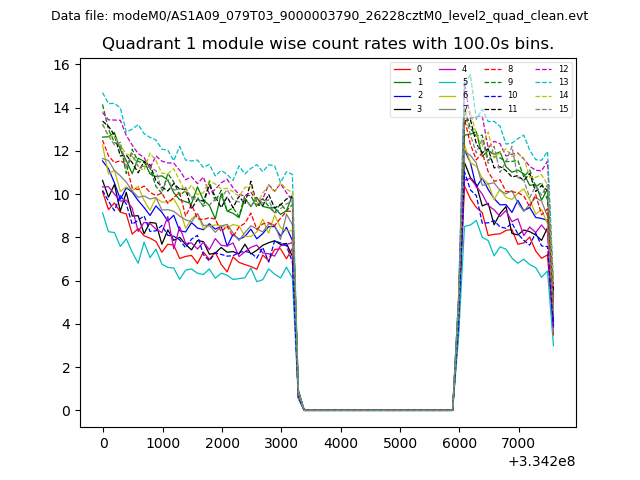 |
 |
| Module-wise count rates for Quadrant C Data is divided into 100 sec bins |
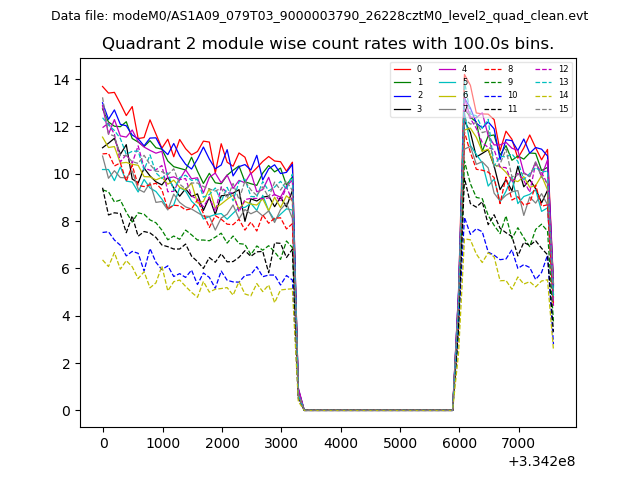 |
 |
| Module-wise count rates for Quadrant D Data is divided into 100 sec bins |
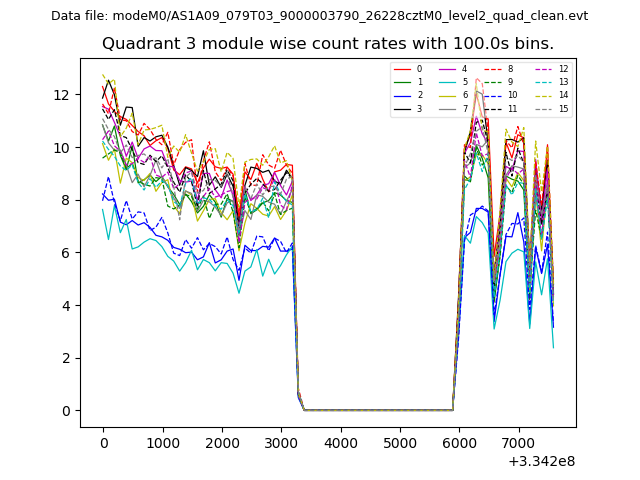 |
 |
| Parameter | Plot |
|---|---|
| CZT HV Monitor | 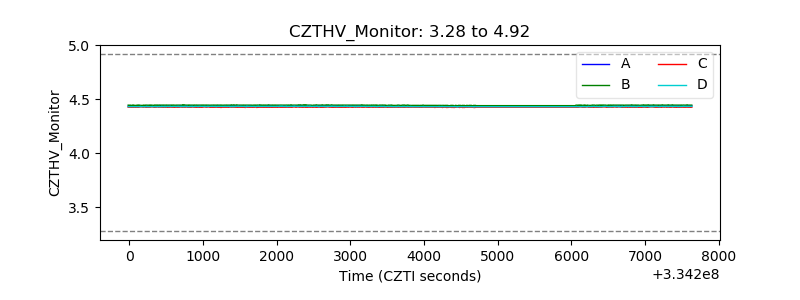 |
| D_VDD | 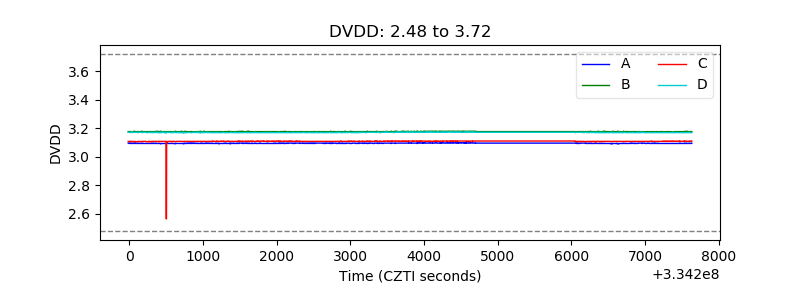 |
| Temperature 1 | 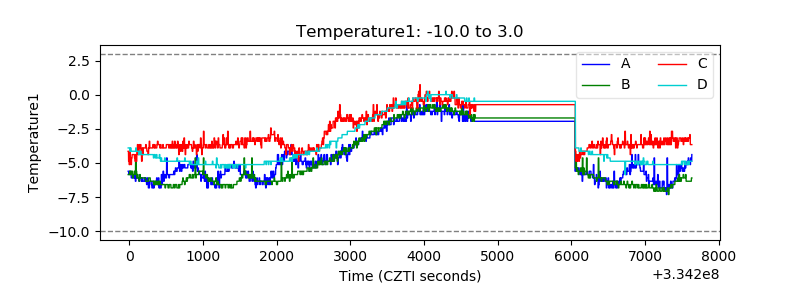 |
| Veto HV Monitor | 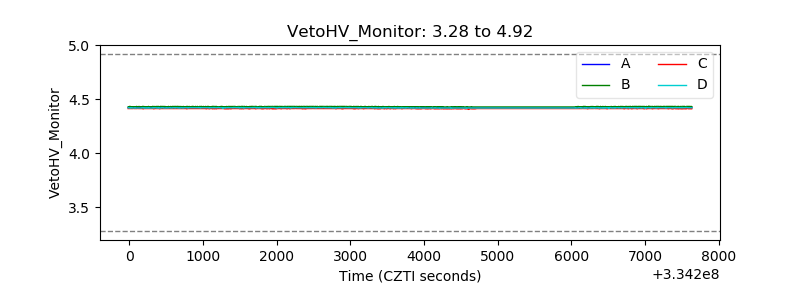 |
| Veto LLD | 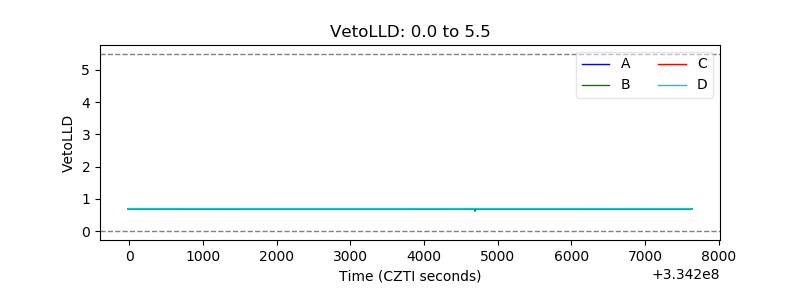 |
| Alpha Counter | 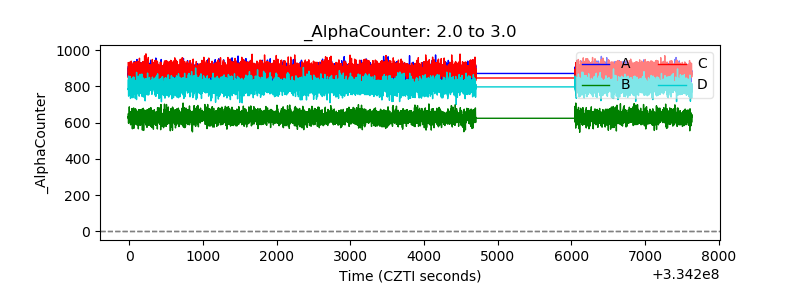 |
| _CPM_Rate | 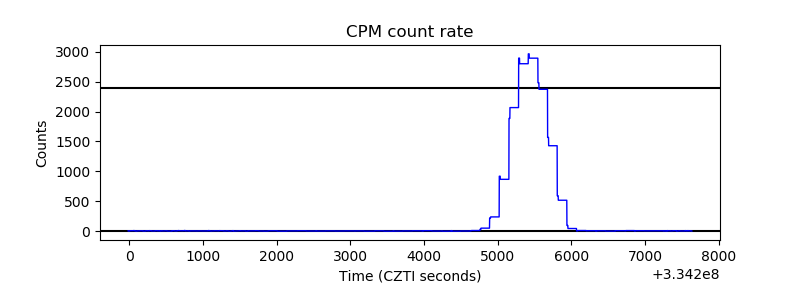 |
| CZT Counter | 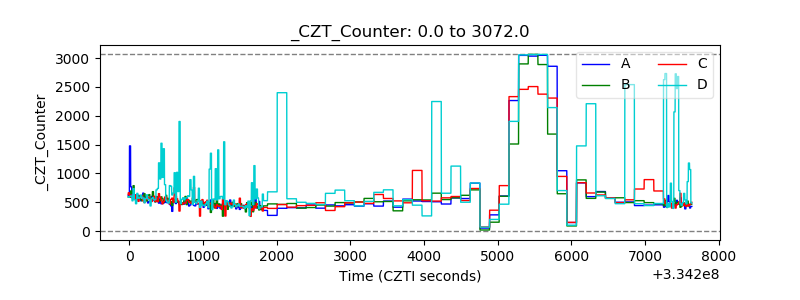 |
| +2.5 Volts monitor |  |
| +5 Volts monitor | 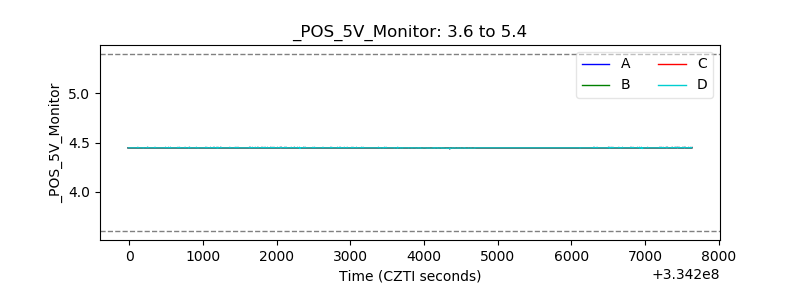 |
| _ROLL_ROT | 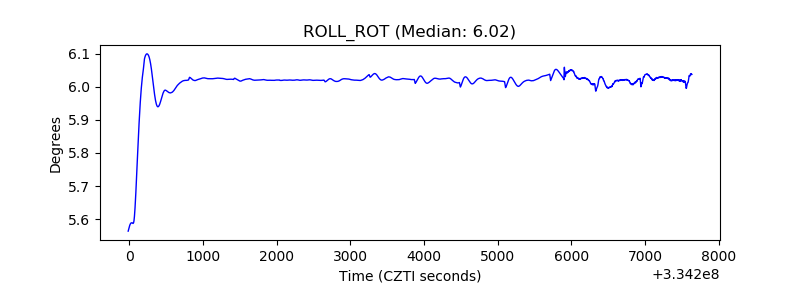 |
| _Roll_DEC | 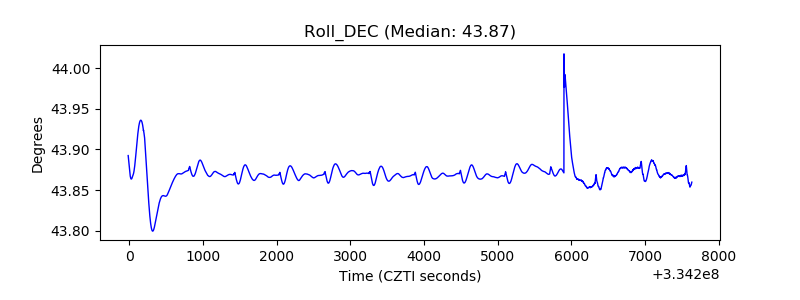 |
| _Roll_RA | 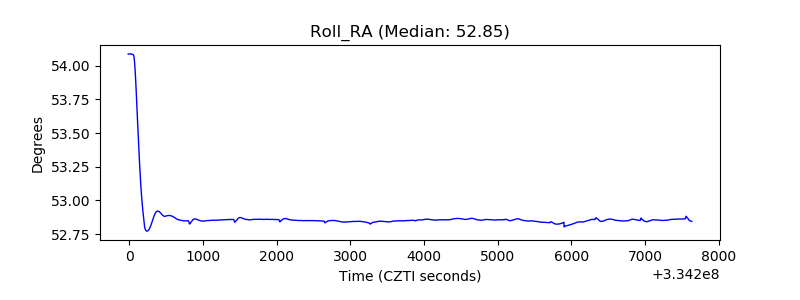 |
| Veto Counter | 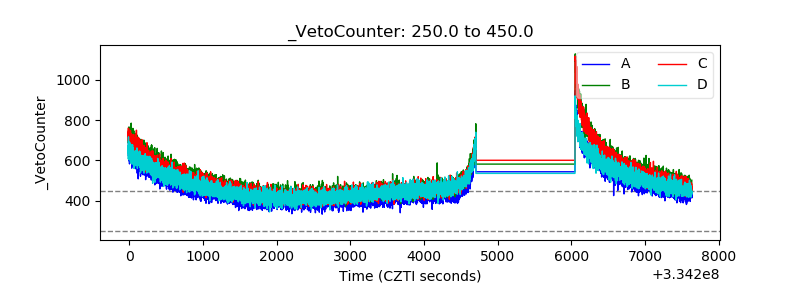 |