| Param | Original file | Final file |
|---|---|---|
| Filename | modeM0/AS1A09_079T03_9000003790_26229cztM0_level2.evt | modeM0/AS1A09_079T03_9000003790_26229cztM0_level2_quad_clean.evt |
| Size (bytes) | 510,307,200 | 98,398,080 |
| Size | 486.7 MB | 93.8 MB |
| Events in quadrant A | 3,138,847 | 645,853 |
| Events in quadrant B | 3,118,133 | 672,319 |
| Events in quadrant C | 3,286,646 | 641,810 |
| Events in quadrant D | 5,486,154 | 582,885 |
| Mode M0 | |||
|---|---|---|---|
| Quadrant | BADHDUFLAG | Total packets | Discarded packets |
| A | 0 | 13243 | 0 |
| B | 0 | 13026 | 0 |
| C | 0 | 13675 | 0 |
| D | 0 | 20581 | 0 |
| Mode M9 | |||
|---|---|---|---|
| Quadrant | BADHDUFLAG | Total packets | Discarded packets |
| A | 0 | 14 | 0 |
| B | 0 | 14 | 0 |
| C | 0 | 14 | 0 |
| D | 0 | 14 | 0 |
| Quadrant | Total seconds | Saturated seconds | Saturation percentage |
|---|---|---|---|
| A | 6257 | 23 | 0.367588% |
| B | 6257 | 17 | 0.271696% |
| C | 6258 | 80 | 1.278364% |
| D | 6258 | 800 | 12.783637% |
Noise dominated data is calculated using 1-second bins in cleaned event files. If a bin has >2000 counts, and if more than 50% of those come from <1% of pixels, then it is considered to be noise-dominated and hence unusable.
| Quadrant | # 1 sec bins | Bins with >0 counts | Bins with >2000 counts | High rate bins dominated by noise | Noise dominated (total time) | Noise dominated (detector-on time) | Marked lightcurve |
|---|---|---|---|---|---|---|---|
| A | 7652 | 6258 | 8 | 8 | 0.10% | 0.13% | 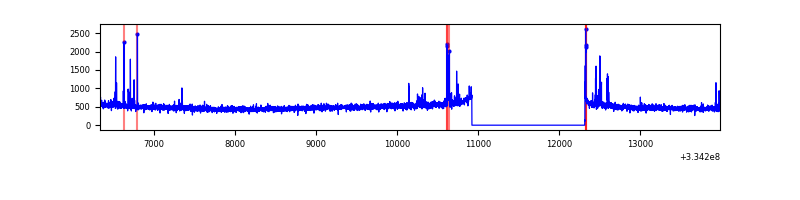 |
| B | 7652 | 6258 | 1 | 1 | 0.01% | 0.02% | 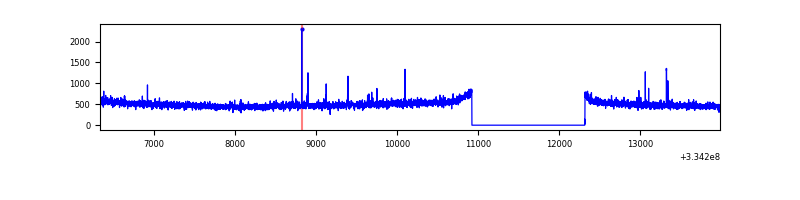 |
| C | 7653 | 6259 | 18 | 18 | 0.24% | 0.29% | 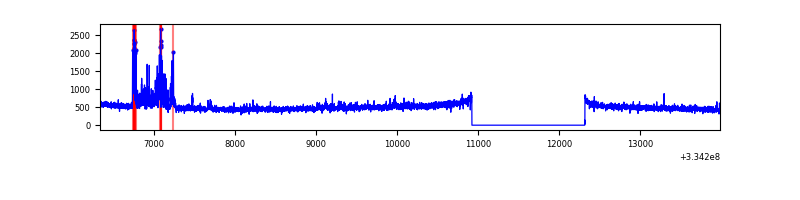 |
| D | 7653 | 6259 | 737 | 737 | 9.63% | 11.78% | 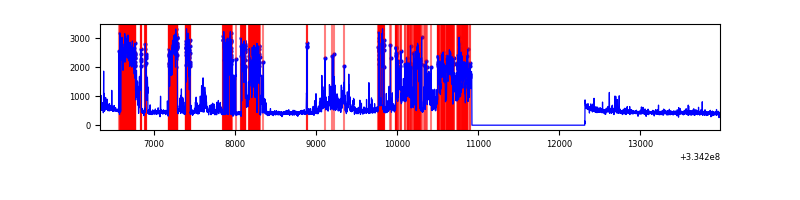 |
Top three noisy pixels from each quadrant. If the there are fewer than three noisy pixels in the level2.evt file, extra rows are filled as -1
| Pixel properties | Quadrant properties | ||||||
|---|---|---|---|---|---|---|---|
| Quadrant | DetID | PixID | Counts | Sigma | Mean | Median | Sigma |
| A | 0 | 13 | 119176 | 761.0 | 783 | 770 | 155.6 |
| A | 13 | 254 | 9441 | 55.73 | 783 | 770 | 155.6 |
| A | 3 | 137 | 6807 | 38.8 | 783 | 770 | 155.6 |
| B | 0 | 230 | 21320 | 138.88 | 787 | 767 | 148.0 |
| B | 12 | 111 | 17260 | 111.45 | 787 | 767 | 148.0 |
| B | 11 | 111 | 15098 | 96.84 | 787 | 767 | 148.0 |
| C | 3 | 233 | 224571 | 1276.3 | 753 | 759 | 175.4 |
| C | 14 | 238 | 123509 | 699.99 | 753 | 759 | 175.4 |
| C | 13 | 61 | 5274 | 25.75 | 753 | 759 | 175.4 |
| D | 1 | 52 | 2633606 | 15605.63 | 712 | 696 | 168.7 |
| D | 12 | 233 | 127835 | 753.57 | 712 | 696 | 168.7 |
| D | 2 | 234 | 23911 | 137.6 | 712 | 696 | 168.7 |
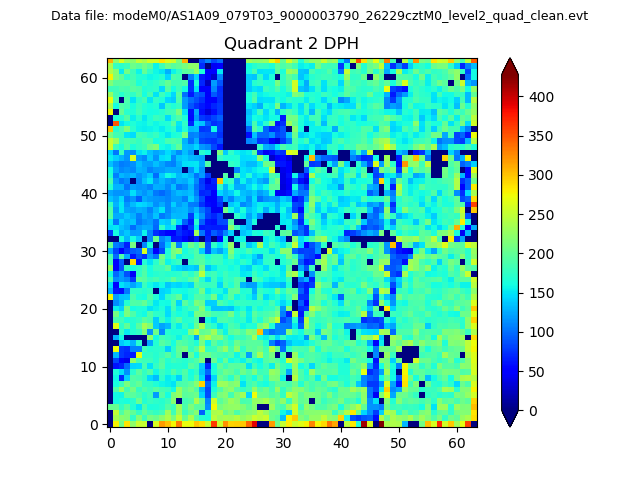
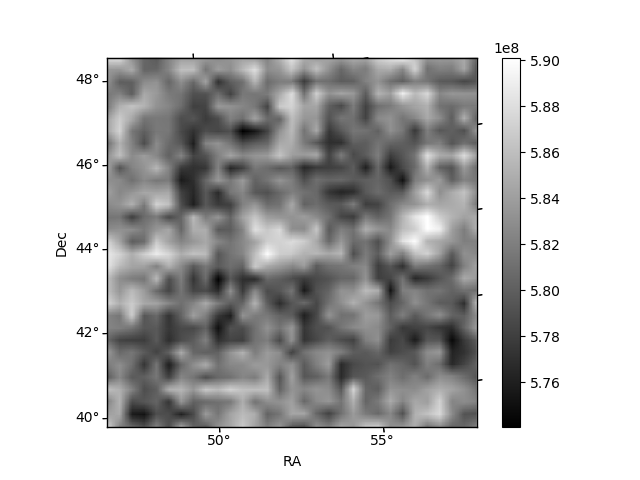
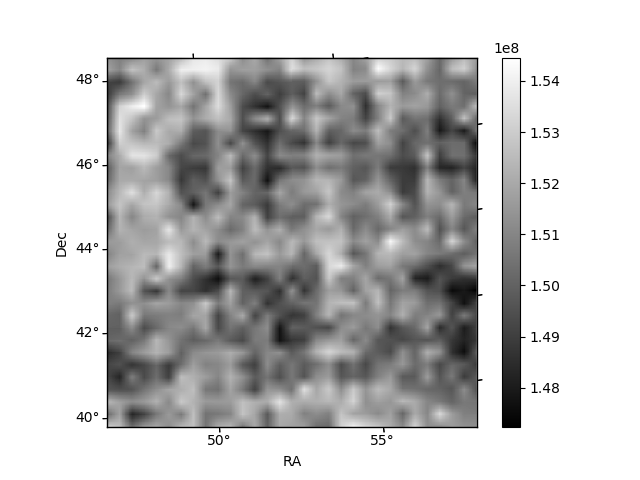
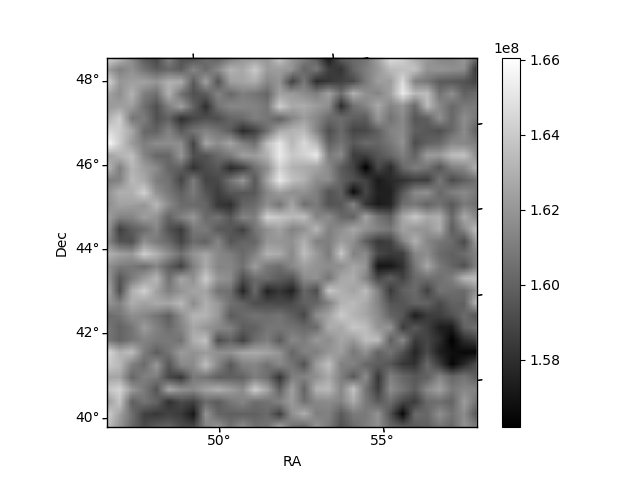
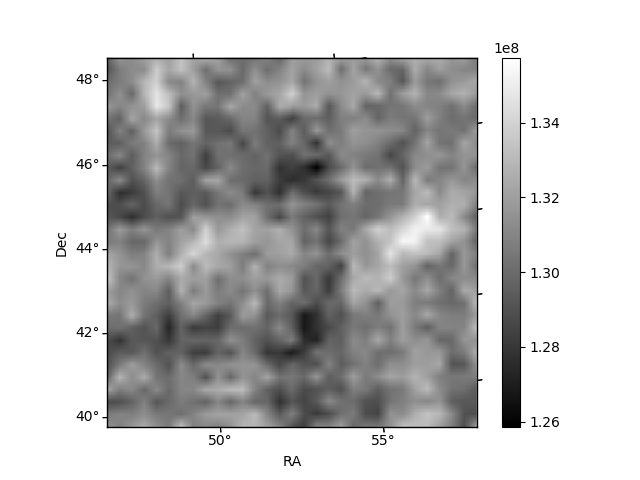
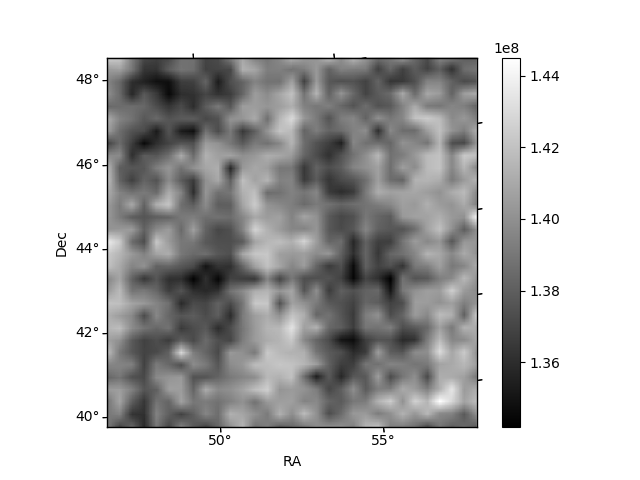
Histogram calculated using DETX and DETY for each event in the final _common_clean file
| Quadrant A | 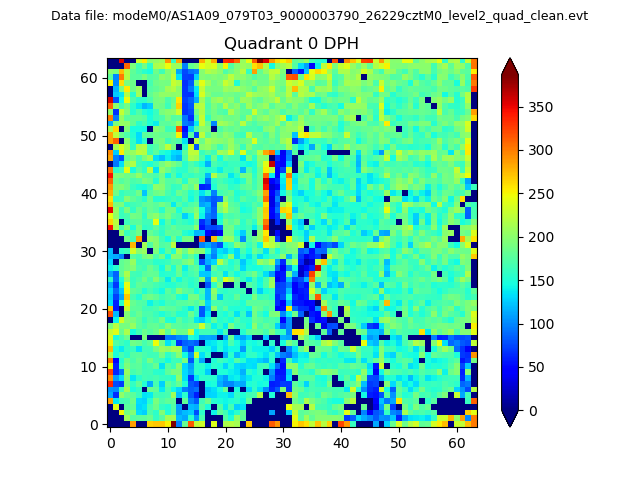 |
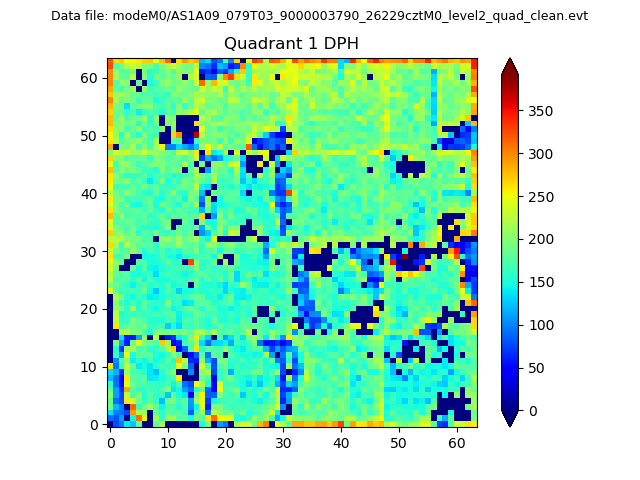 |
Quadrant B |
|---|---|---|---|
| Quadrant D | 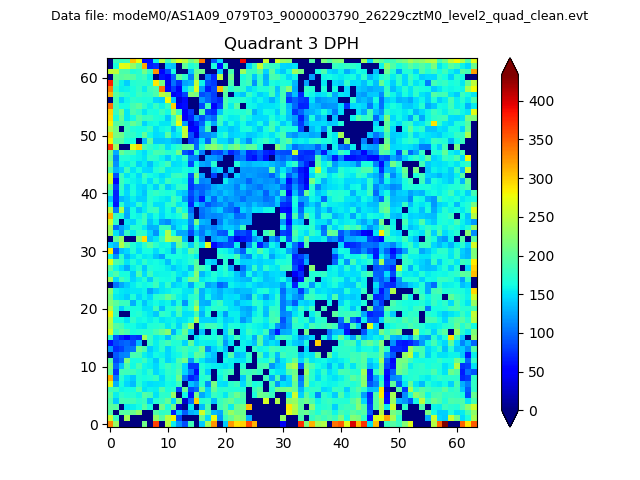 |
 |
Quadrant C |
| Plot type | Count rate plots | Images |
|---|---|---|
| Comparison with Poisson distribution Blue bars denote a histogram of data divided into 1 sec bins. Red curve is a Poisson curve with rate = median count rate of data. |
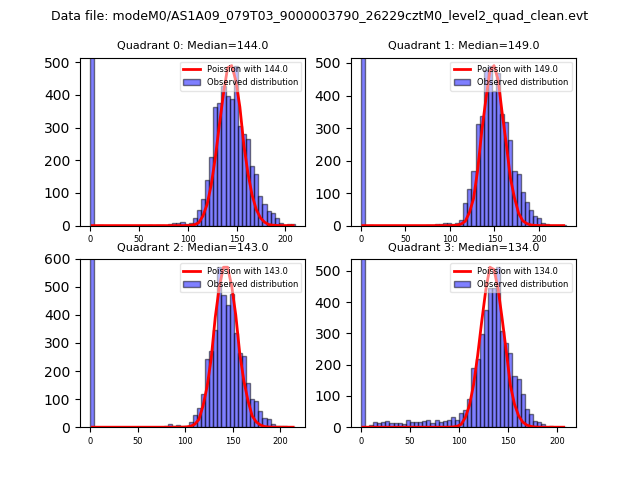 |
 |
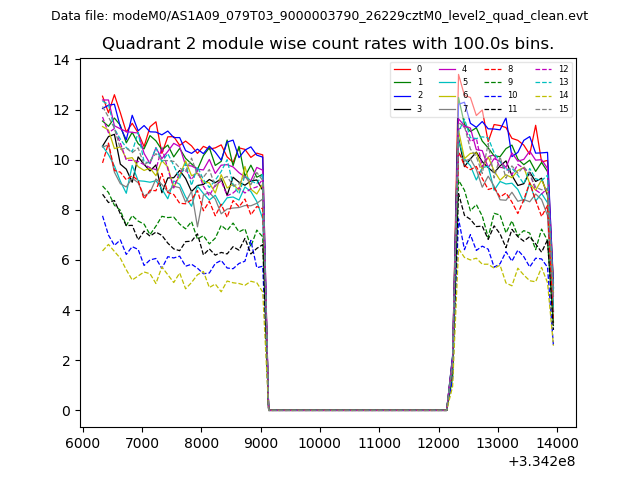
| Quadrant-wise count rates Data is divided into 100 sec bins |
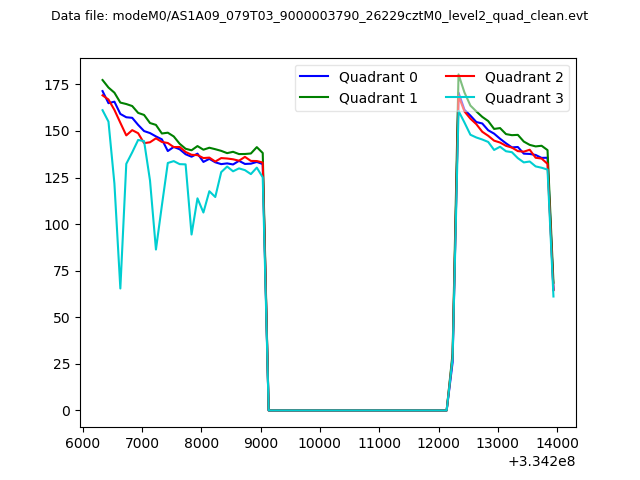 |
|
| Module-wise count rates for Quadrant A Data is divided into 100 sec bins |
 |
 |
| Module-wise count rates for Quadrant B Data is divided into 100 sec bins |
 |
 |
| Module-wise count rates for Quadrant C Data is divided into 100 sec bins |
 |
 |
| Module-wise count rates for Quadrant D Data is divided into 100 sec bins |
 |
 |
| Parameter | Plot |
|---|---|
| CZT HV Monitor | 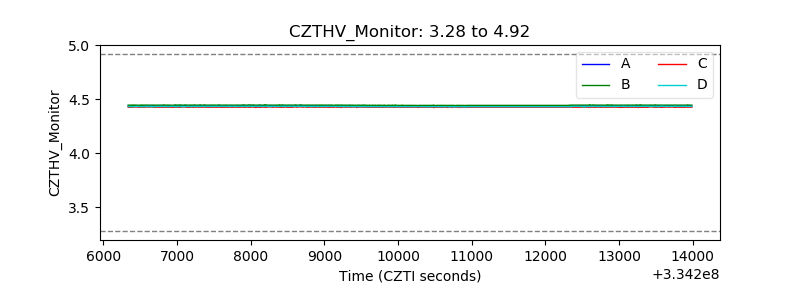 |
| D_VDD |  |
| Temperature 1 |  |
| Veto HV Monitor | 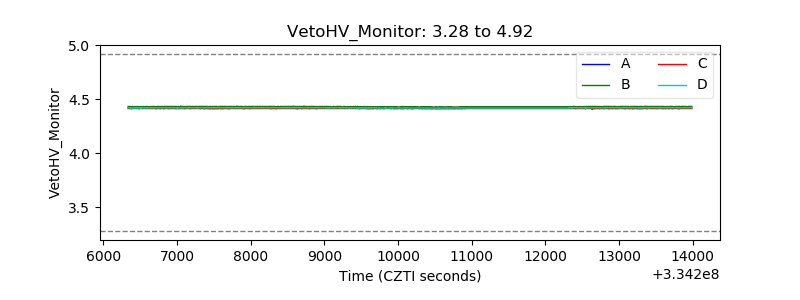 |
| Veto LLD |  |
| Alpha Counter | 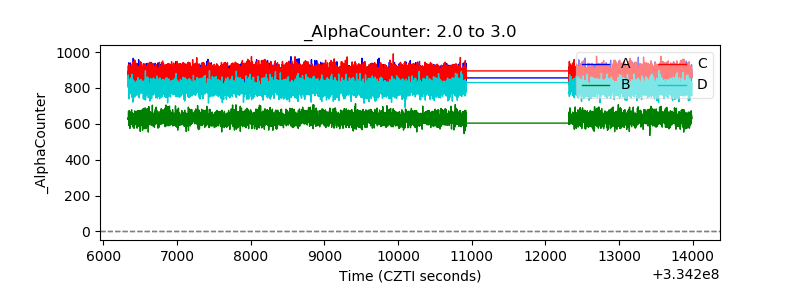 |
| _CPM_Rate | 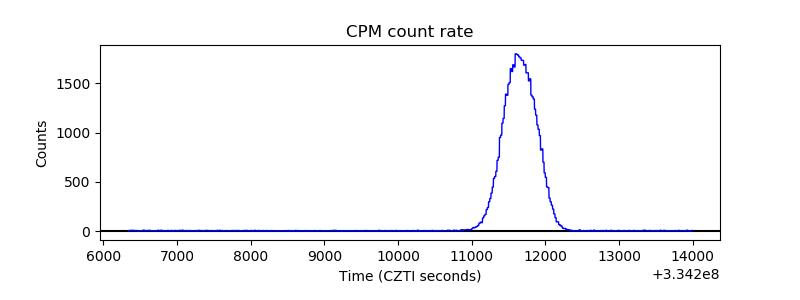 |
| CZT Counter | 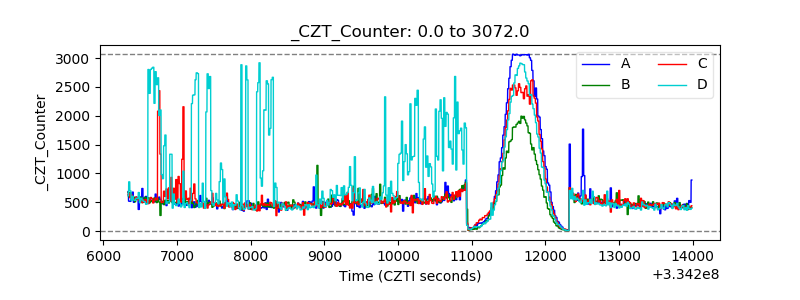 |
| +2.5 Volts monitor | 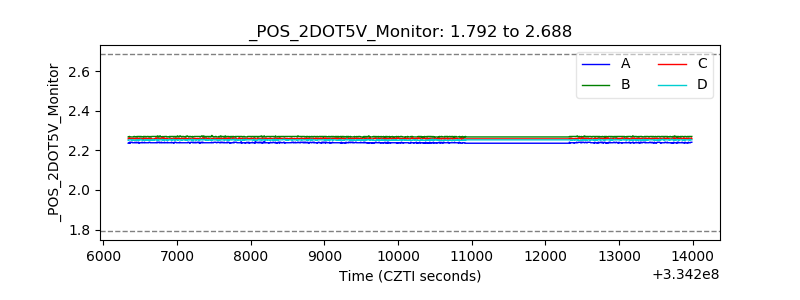 |
| +5 Volts monitor |  |
| _ROLL_ROT |  |
| _Roll_DEC |  |
| _Roll_RA | 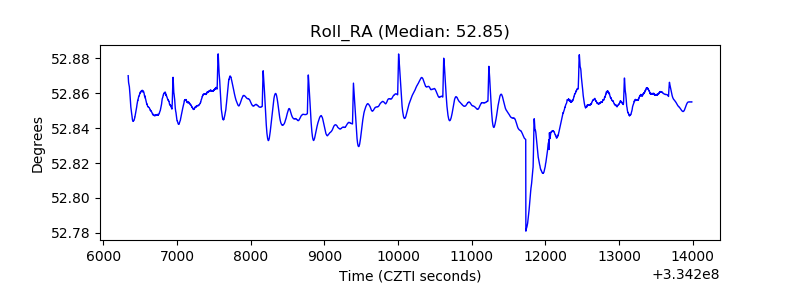 |
| Veto Counter |  |