| Param | Original file | Final file |
|---|---|---|
| Filename | modeM0/AS1A09_079T03_9000003790_26230cztM0_level2.evt | modeM0/AS1A09_079T03_9000003790_26230cztM0_level2_quad_clean.evt |
| Size (bytes) | 443,266,560 | 92,779,200 |
| Size | 422.7 MB | 88.5 MB |
| Events in quadrant A | 3,240,063 | 592,384 |
| Events in quadrant B | 3,132,902 | 614,249 |
| Events in quadrant C | 3,080,897 | 590,738 |
| Events in quadrant D | 3,537,162 | 567,476 |
| Mode M0 | |||
|---|---|---|---|
| Quadrant | BADHDUFLAG | Total packets | Discarded packets |
| A | 0 | 13699 | 0 |
| B | 0 | 13275 | 0 |
| C | 0 | 13159 | 0 |
| D | 0 | 14956 | 0 |
| Mode M9 | |||
|---|---|---|---|
| Quadrant | BADHDUFLAG | Total packets | Discarded packets |
| A | 0 | 12 | 0 |
| B | 0 | 12 | 0 |
| C | 0 | 12 | 0 |
| D | 0 | 12 | 0 |
| Quadrant | Total seconds | Saturated seconds | Saturation percentage |
|---|---|---|---|
| A | 6376 | 59 | 0.925345% |
| B | 6373 | 38 | 0.596265% |
| C | 6379 | 72 | 1.128704% |
| D | 6372 | 147 | 2.306968% |
Noise dominated data is calculated using 1-second bins in cleaned event files. If a bin has >2000 counts, and if more than 50% of those come from <1% of pixels, then it is considered to be noise-dominated and hence unusable.
| Quadrant | # 1 sec bins | Bins with >0 counts | Bins with >2000 counts | High rate bins dominated by noise | Noise dominated (total time) | Noise dominated (detector-on time) | Marked lightcurve |
|---|---|---|---|---|---|---|---|
| A | 7590 | 6383 | 16 | 16 | 0.21% | 0.25% |  |
| B | 7591 | 6381 | 2 | 2 | 0.03% | 0.03% | 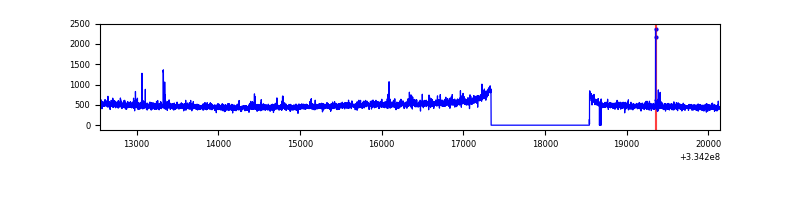 |
| C | 7591 | 6386 | 0 | 0 | 0.00% | 0.00% | 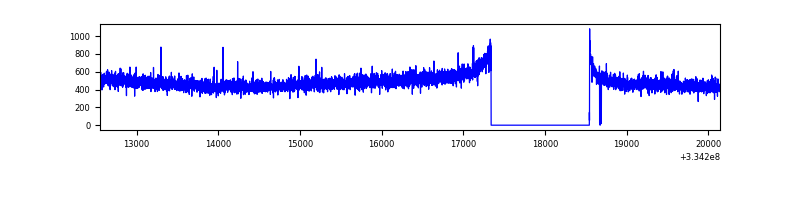 |
| D | 7591 | 6382 | 116 | 116 | 1.53% | 1.82% | 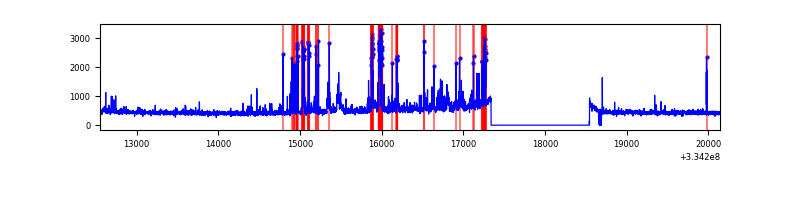 |
Top three noisy pixels from each quadrant. If the there are fewer than three noisy pixels in the level2.evt file, extra rows are filled as -1
| Pixel properties | Quadrant properties | ||||||
|---|---|---|---|---|---|---|---|
| Quadrant | DetID | PixID | Counts | Sigma | Mean | Median | Sigma |
| A | 0 | 13 | 194994 | 1233.44 | 787 | 772 | 157.5 |
| A | 13 | 254 | 10354 | 60.85 | 787 | 772 | 157.5 |
| A | 3 | 137 | 7145 | 40.47 | 787 | 772 | 157.5 |
| B | 0 | 230 | 25275 | 165.16 | 789 | 770 | 148.4 |
| B | 12 | 111 | 17735 | 114.34 | 789 | 770 | 148.4 |
| B | 11 | 111 | 15744 | 100.92 | 789 | 770 | 148.4 |
| C | 14 | 238 | 123983 | 699.86 | 755 | 762 | 176.1 |
| C | 3 | 233 | 10855 | 57.33 | 755 | 762 | 176.1 |
| C | 13 | 61 | 5322 | 25.9 | 755 | 762 | 176.1 |
| D | 1 | 52 | 630233 | 3548.77 | 747 | 728 | 177.4 |
| D | 12 | 233 | 56815 | 316.18 | 747 | 728 | 177.4 |
| D | 2 | 234 | 25205 | 137.99 | 747 | 728 | 177.4 |
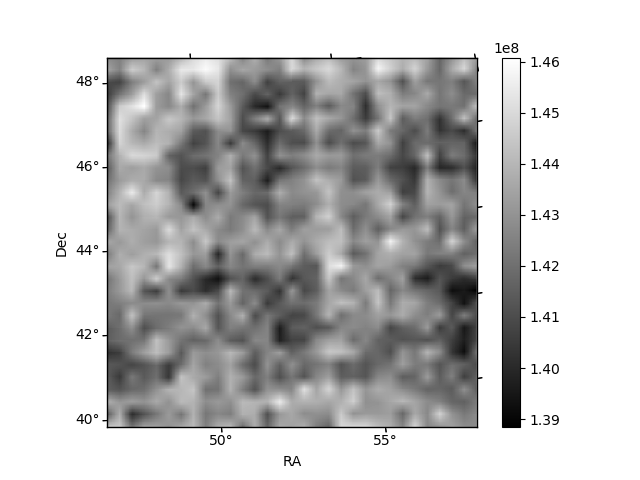
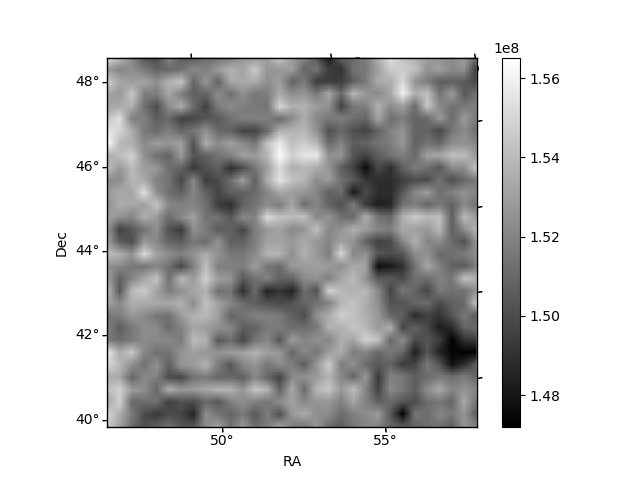
Histogram calculated using DETX and DETY for each event in the final _common_clean file
| Quadrant A | 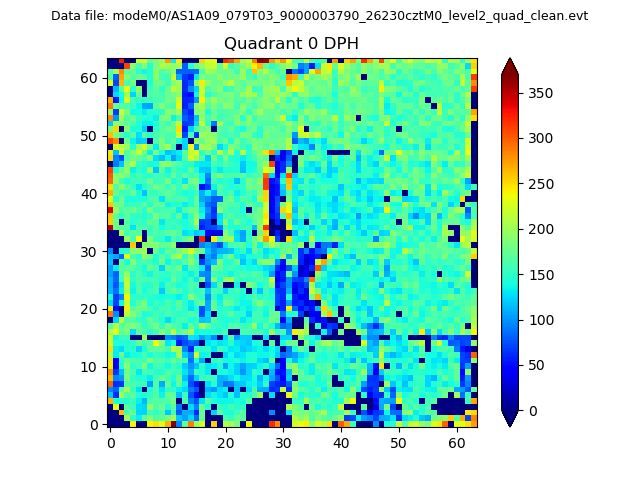 |
 |
Quadrant B |
|---|---|---|---|
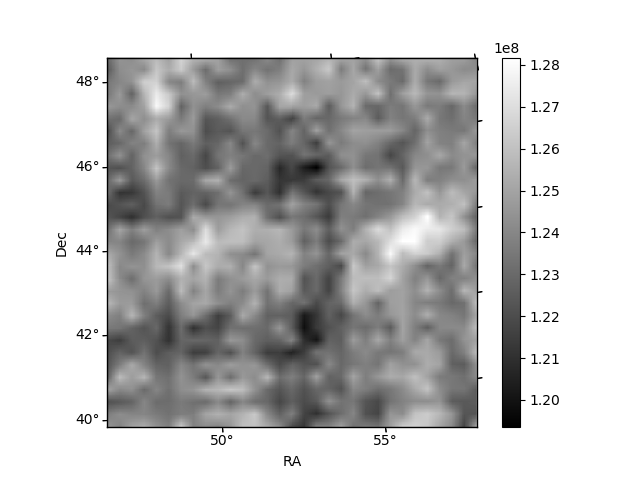
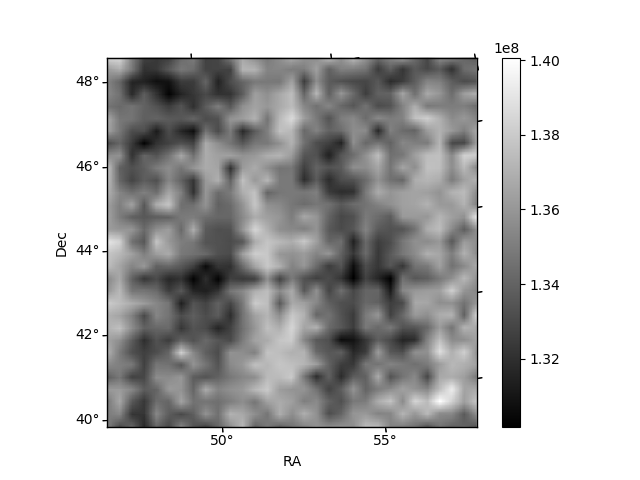
| Quadrant D |  |
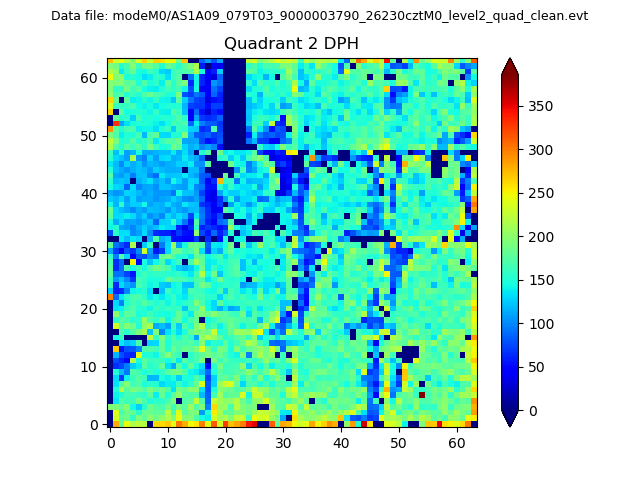 |
Quadrant C |
| Plot type | Count rate plots | Images |
|---|---|---|
| Comparison with Poisson distribution Blue bars denote a histogram of data divided into 1 sec bins. Red curve is a Poisson curve with rate = median count rate of data. |
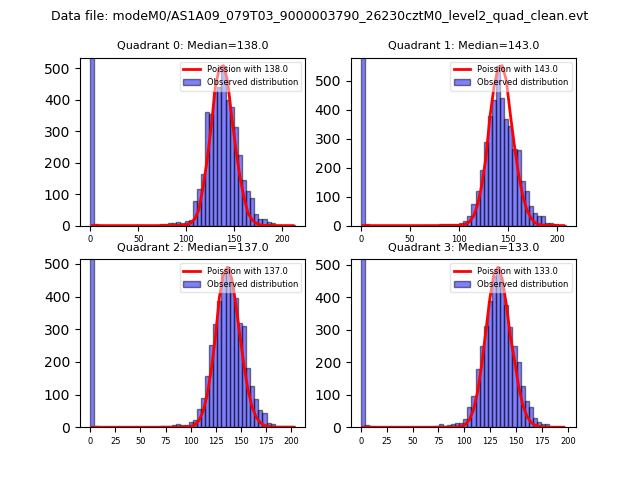 |
 |
| Quadrant-wise count rates Data is divided into 100 sec bins |
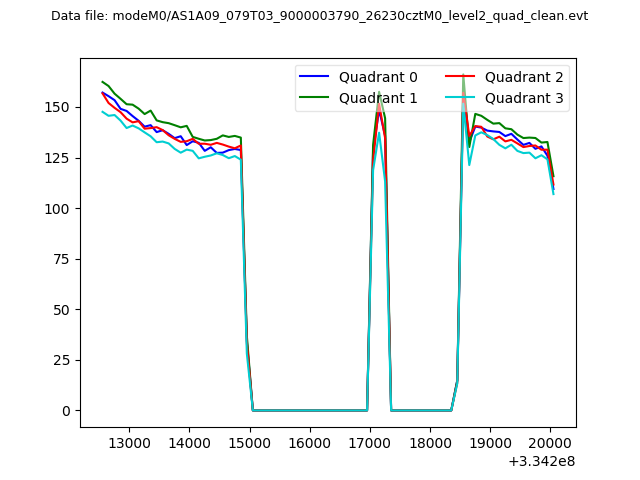 |
|
| Module-wise count rates for Quadrant A Data is divided into 100 sec bins |
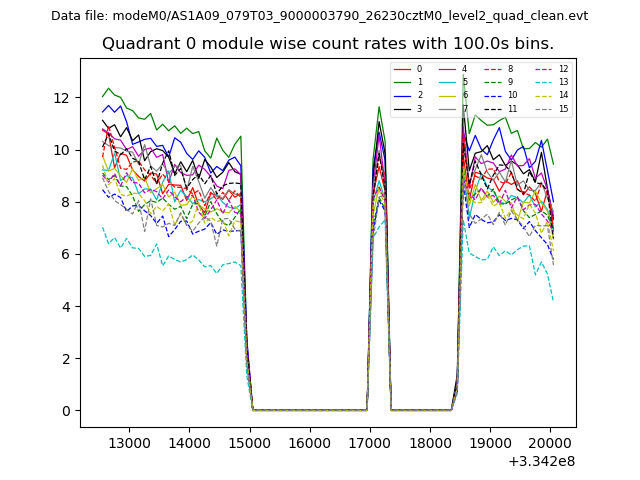 |
 |
| Module-wise count rates for Quadrant B Data is divided into 100 sec bins |
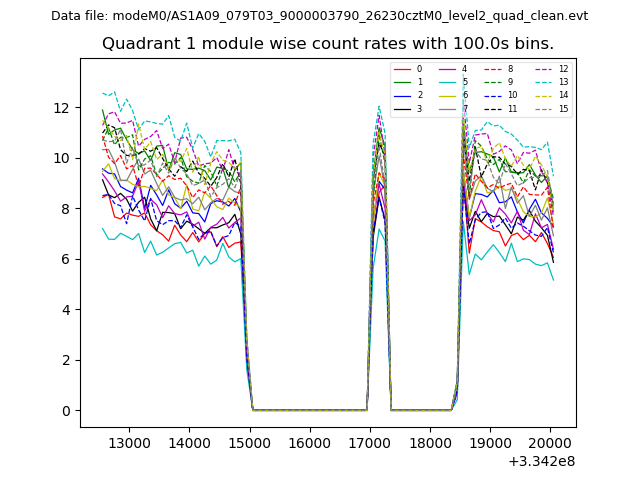 |
 |
| Module-wise count rates for Quadrant C Data is divided into 100 sec bins |
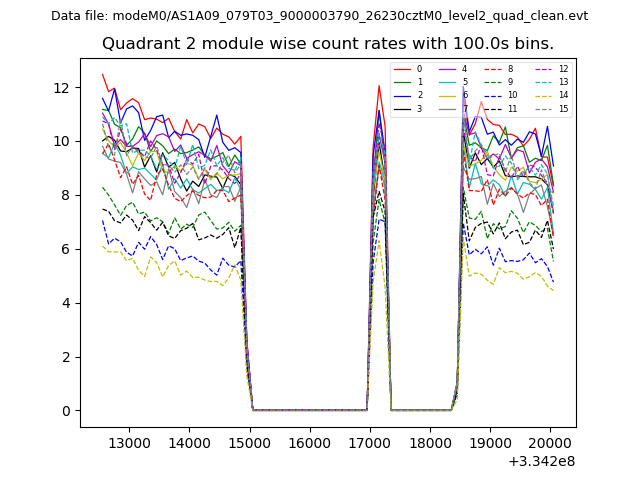 |
 |
| Module-wise count rates for Quadrant D Data is divided into 100 sec bins |
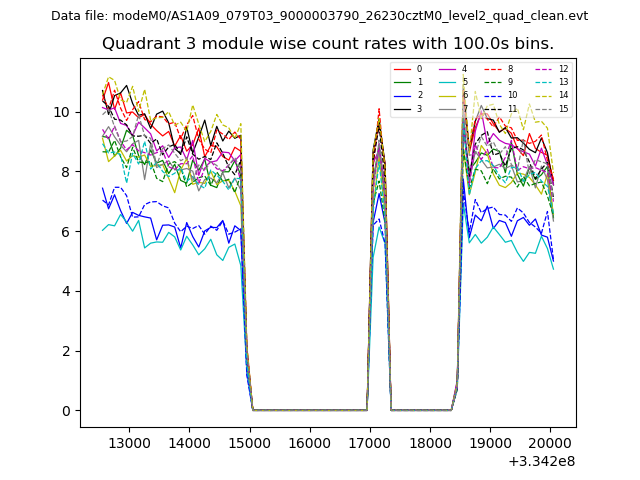 |
 |
| Parameter | Plot |
|---|---|
| CZT HV Monitor |  |
| D_VDD | 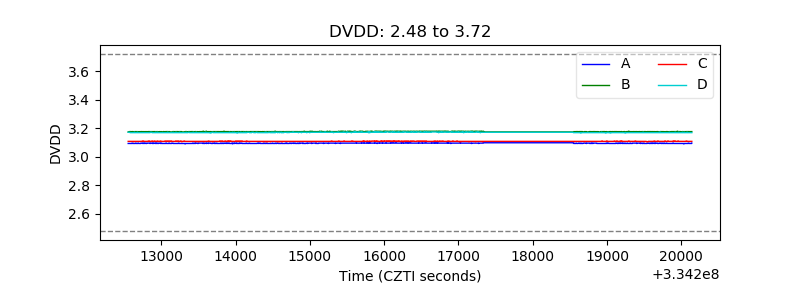 |
| Temperature 1 | 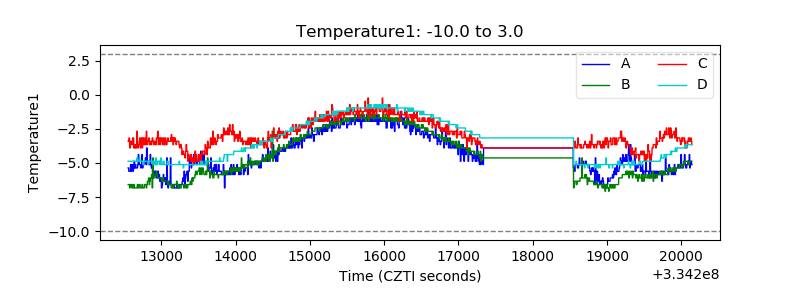 |
| Veto HV Monitor | 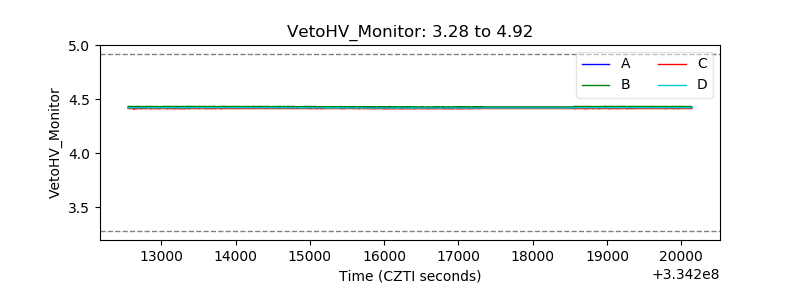 |
| Veto LLD | 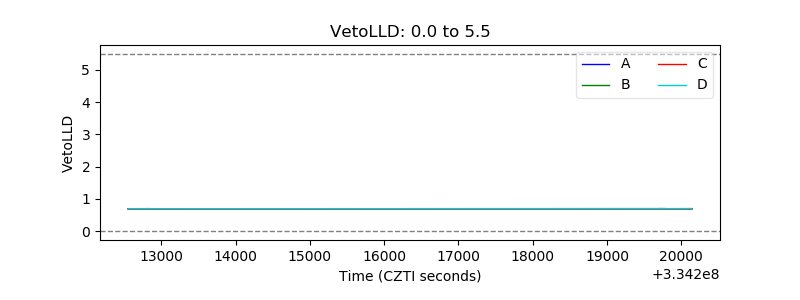 |
| Alpha Counter | 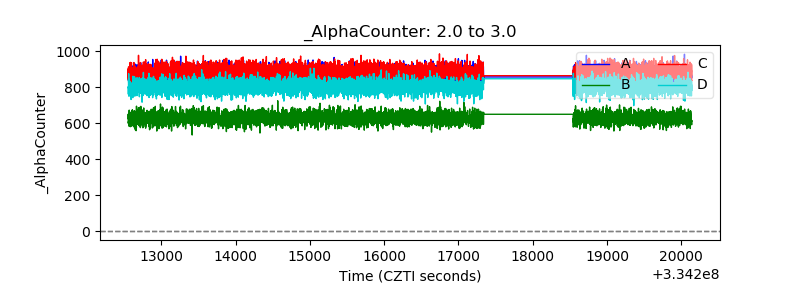 |
| _CPM_Rate | 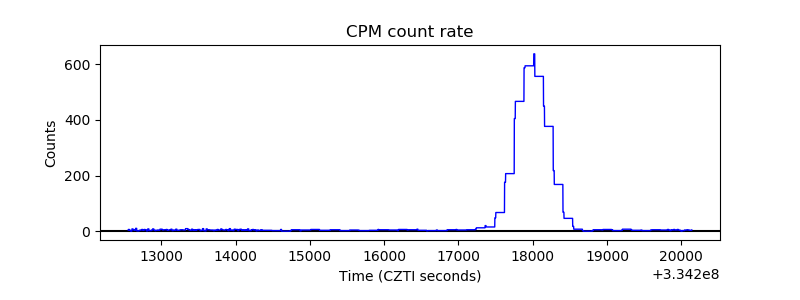 |
| CZT Counter | 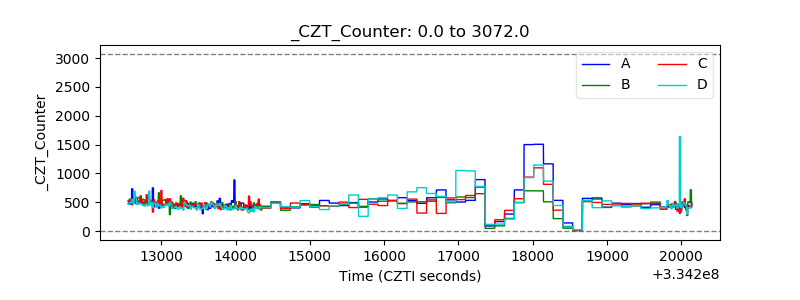 |
| +2.5 Volts monitor |  |
| +5 Volts monitor | 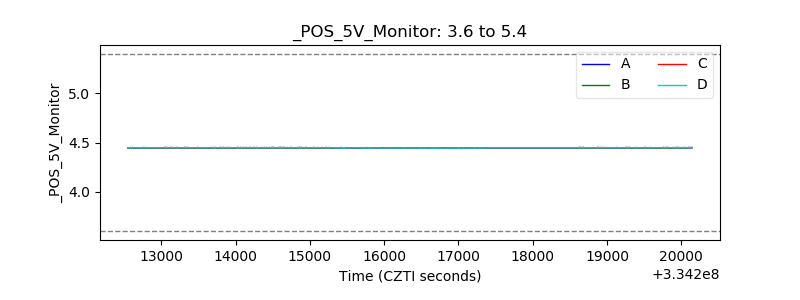 |
| _ROLL_ROT | 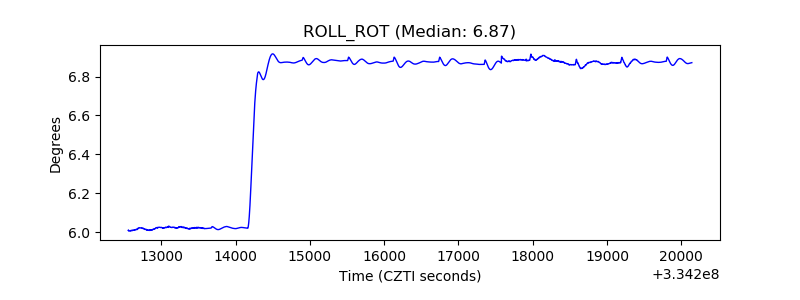 |
| _Roll_DEC | 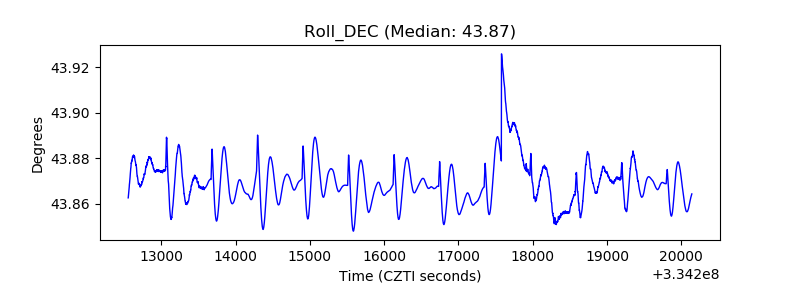 |
| _Roll_RA | 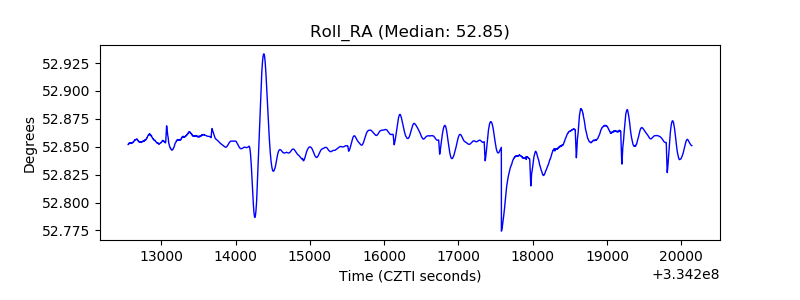 |
| Veto Counter | 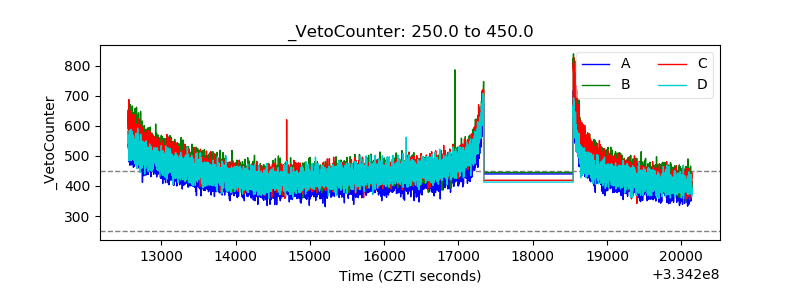 |