| Param | Original file | Final file |
|---|---|---|
| Filename | modeM0/AS1A09_079T03_9000003790_26231cztM0_level2.evt | modeM0/AS1A09_079T03_9000003790_26231cztM0_level2_quad_clean.evt |
| Size (bytes) | 436,291,200 | 91,797,120 |
| Size | 416.1 MB | 87.5 MB |
| Events in quadrant A | 3,266,805 | 581,726 |
| Events in quadrant B | 3,286,619 | 599,222 |
| Events in quadrant C | 3,094,516 | 579,463 |
| Events in quadrant D | 3,121,498 | 564,526 |
| Mode M0 | |||
|---|---|---|---|
| Quadrant | BADHDUFLAG | Total packets | Discarded packets |
| A | 0 | 13917 | 0 |
| B | 0 | 13931 | 0 |
| C | 0 | 13389 | 0 |
| D | 0 | 13728 | 0 |
| Mode M9 | |||
|---|---|---|---|
| Quadrant | BADHDUFLAG | Total packets | Discarded packets |
| A | 0 | 9 | 0 |
| B | 0 | 9 | 0 |
| C | 0 | 9 | 0 |
| D | 0 | 9 | 0 |
| Quadrant | Total seconds | Saturated seconds | Saturation percentage |
|---|---|---|---|
| A | 6526 | 114 | 1.746859% |
| B | 6527 | 93 | 1.424851% |
| C | 6526 | 95 | 1.455716% |
| D | 6526 | 68 | 1.041986% |
Noise dominated data is calculated using 1-second bins in cleaned event files. If a bin has >2000 counts, and if more than 50% of those come from <1% of pixels, then it is considered to be noise-dominated and hence unusable.
| Quadrant | # 1 sec bins | Bins with >0 counts | Bins with >2000 counts | High rate bins dominated by noise | Noise dominated (total time) | Noise dominated (detector-on time) | Marked lightcurve |
|---|---|---|---|---|---|---|---|
| A | 7371 | 6527 | 27 | 27 | 0.37% | 0.41% | 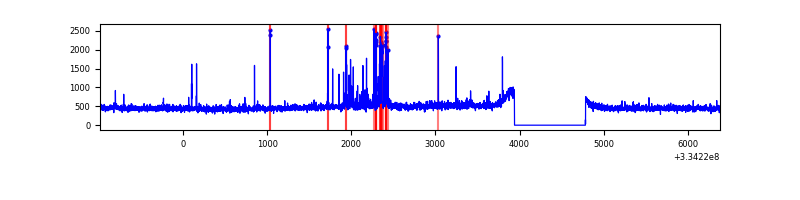 |
| B | 7372 | 6528 | 10 | 10 | 0.14% | 0.15% | 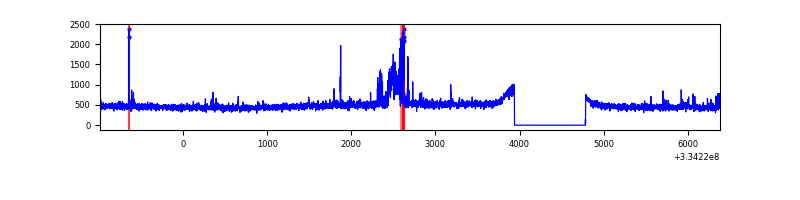 |
| C | 7371 | 6527 | 0 | 0 | 0.00% | 0.00% | 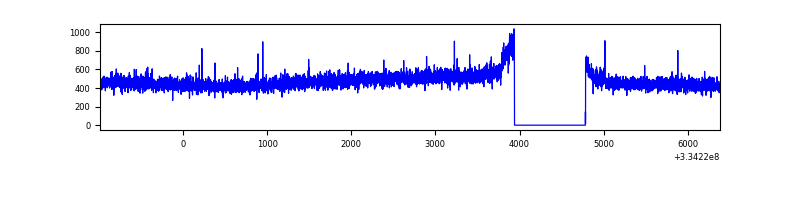 |
| D | 7371 | 6527 | 7 | 7 | 0.09% | 0.11% | 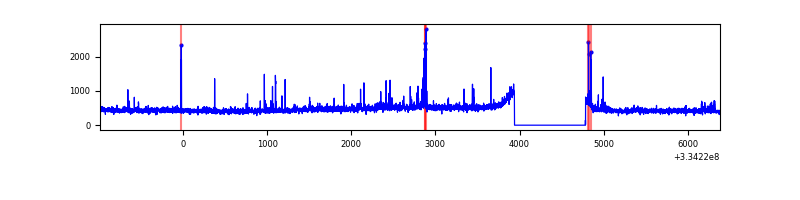 |
Top three noisy pixels from each quadrant. If the there are fewer than three noisy pixels in the level2.evt file, extra rows are filled as -1
| Pixel properties | Quadrant properties | ||||||
|---|---|---|---|---|---|---|---|
| Quadrant | DetID | PixID | Counts | Sigma | Mean | Median | Sigma |
| A | 0 | 13 | 194331 | 1215.41 | 791 | 775 | 159.3 |
| A | 6 | 16 | 19702 | 118.85 | 791 | 775 | 159.3 |
| A | 13 | 254 | 10443 | 60.71 | 791 | 775 | 159.3 |
| B | 7 | 219 | 123469 | 817.75 | 788 | 767 | 150.0 |
| B | 7 | 235 | 40333 | 263.69 | 788 | 767 | 150.0 |
| B | 0 | 230 | 28759 | 186.55 | 788 | 767 | 150.0 |
| C | 14 | 238 | 121506 | 681.54 | 757 | 759 | 177.2 |
| C | 3 | 233 | 22943 | 125.22 | 757 | 759 | 177.2 |
| C | 13 | 61 | 5295 | 25.6 | 757 | 759 | 177.2 |
| D | 1 | 52 | 144450 | 785.73 | 764 | 745 | 182.9 |
| D | 12 | 233 | 41310 | 221.8 | 764 | 745 | 182.9 |
| D | 2 | 234 | 25922 | 137.66 | 764 | 745 | 182.9 |
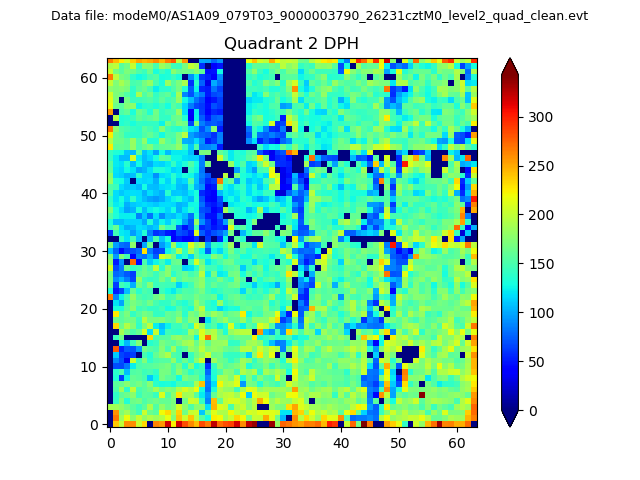
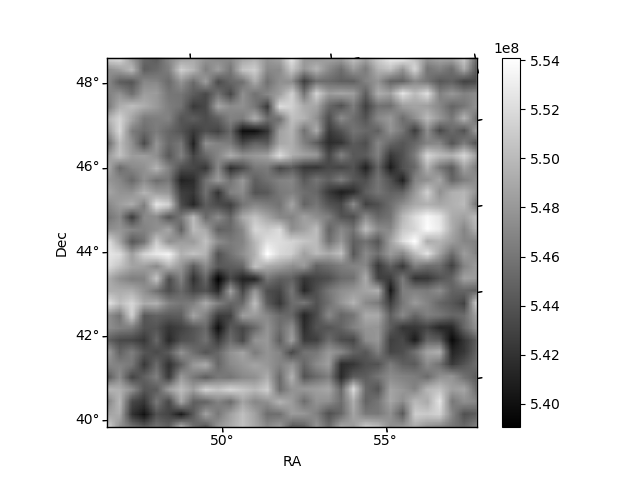
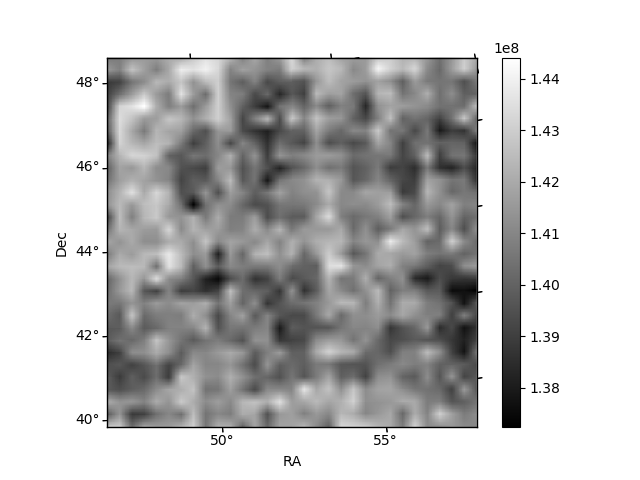
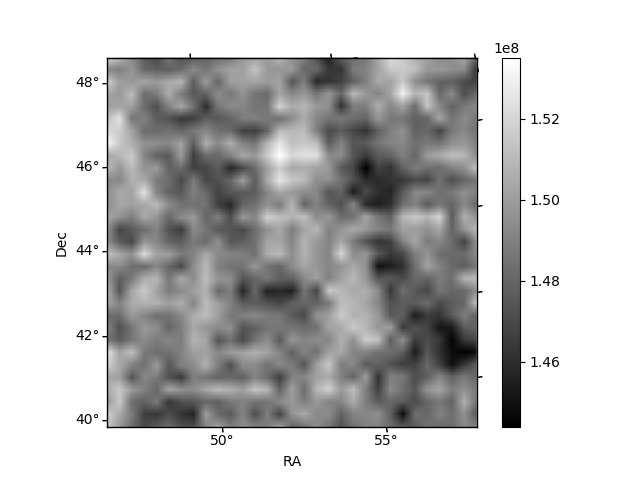
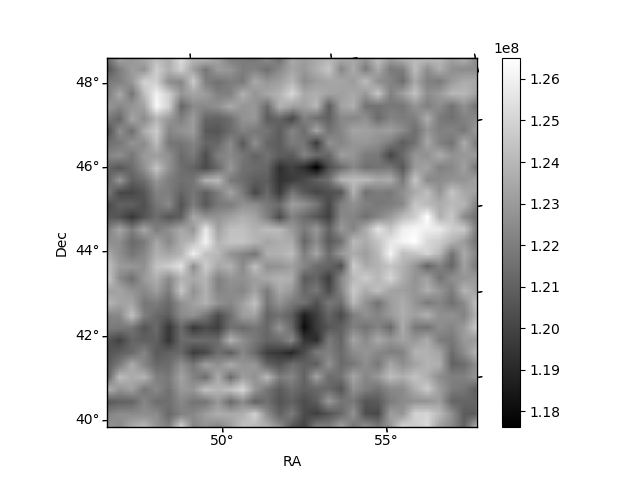
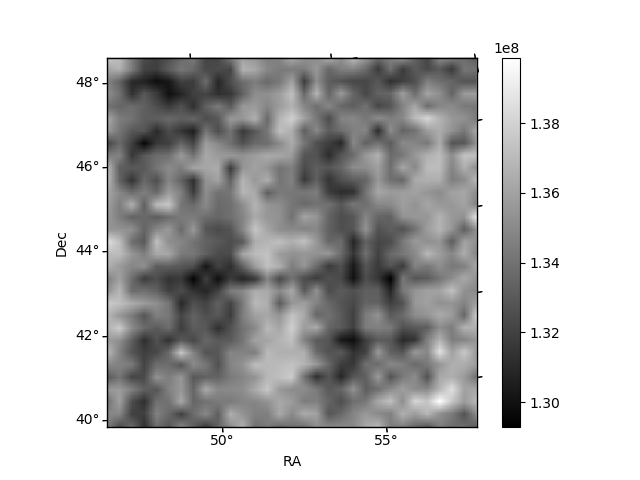
Histogram calculated using DETX and DETY for each event in the final _common_clean file
| Quadrant A | 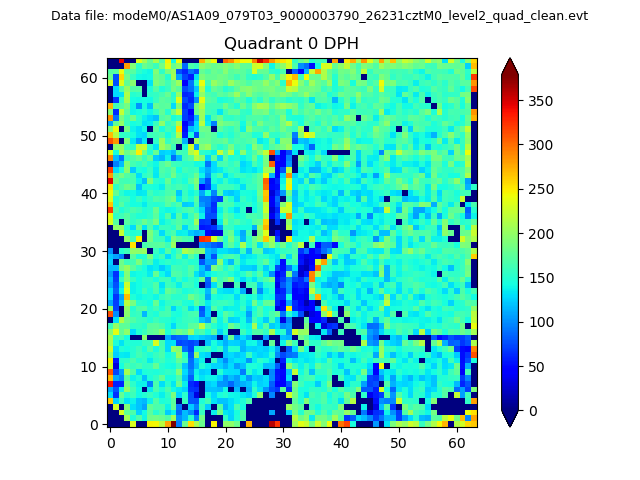 |
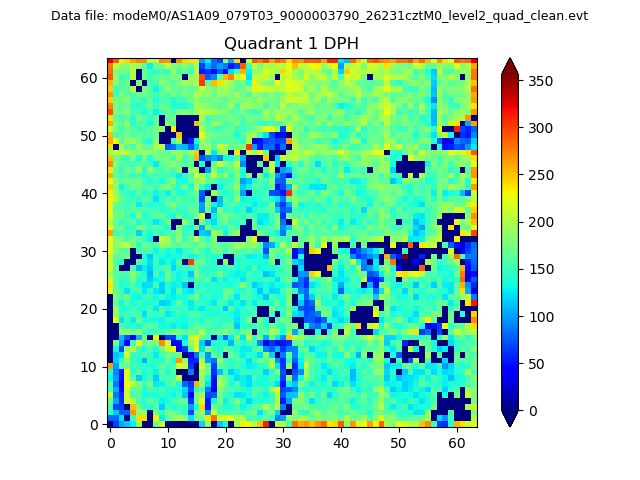 |
Quadrant B |
|---|---|---|---|
| Quadrant D | 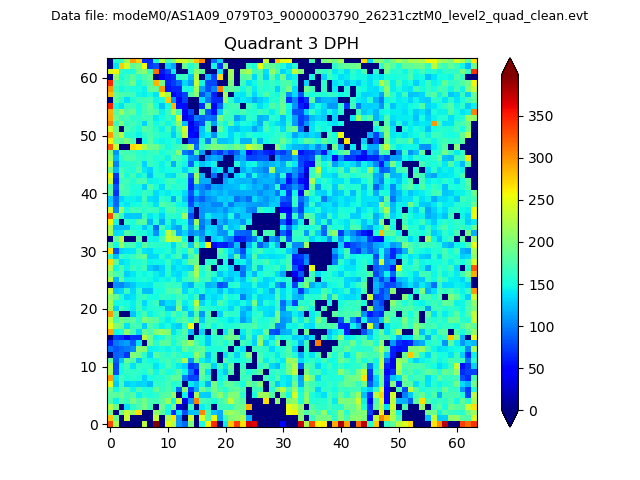 |
 |
Quadrant C |
| Plot type | Count rate plots | Images |
|---|---|---|
| Comparison with Poisson distribution Blue bars denote a histogram of data divided into 1 sec bins. Red curve is a Poisson curve with rate = median count rate of data. |
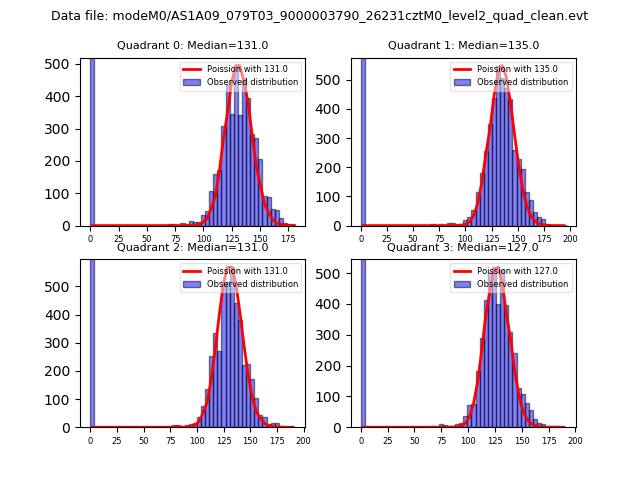 |
 |
| Quadrant-wise count rates Data is divided into 100 sec bins |
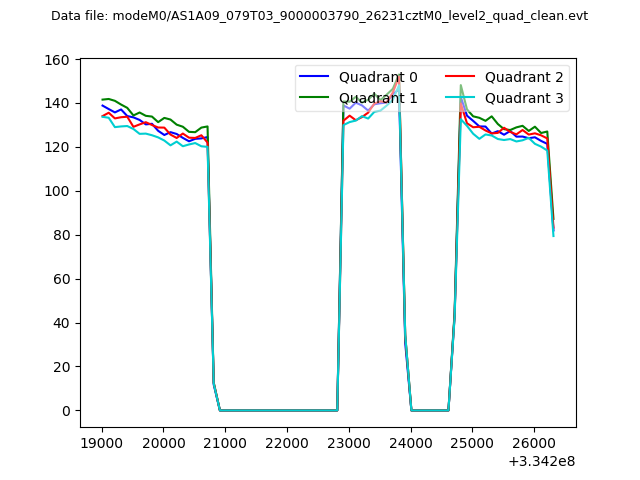 |
|
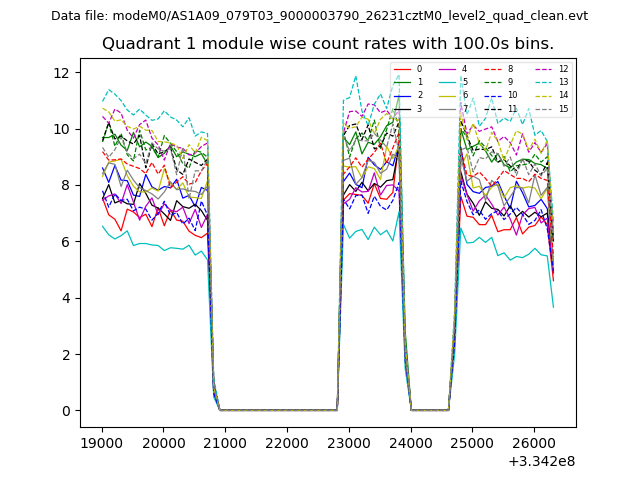
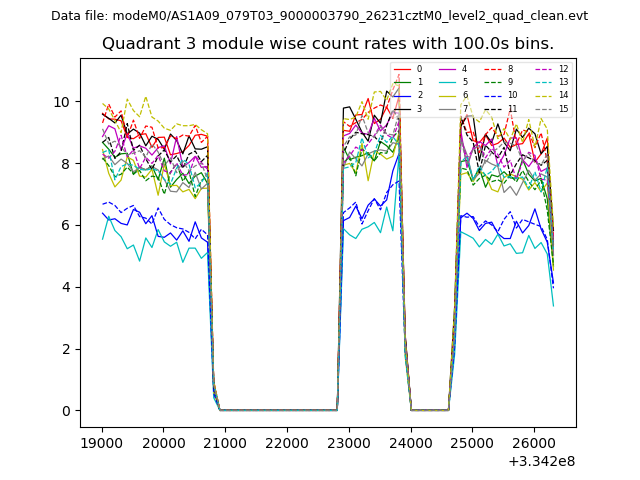
| Module-wise count rates for Quadrant A Data is divided into 100 sec bins |
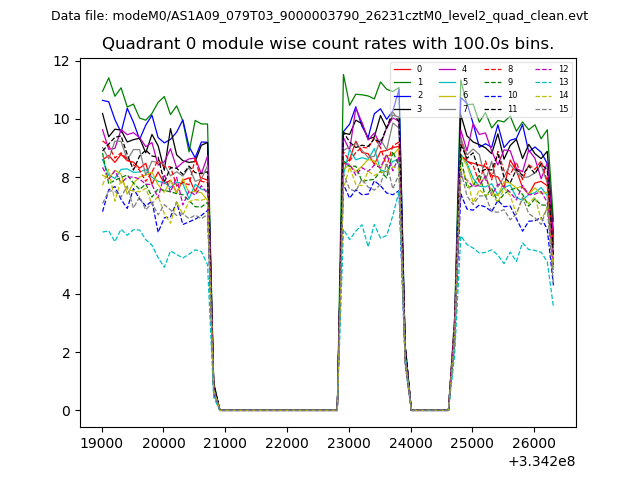 |
 |
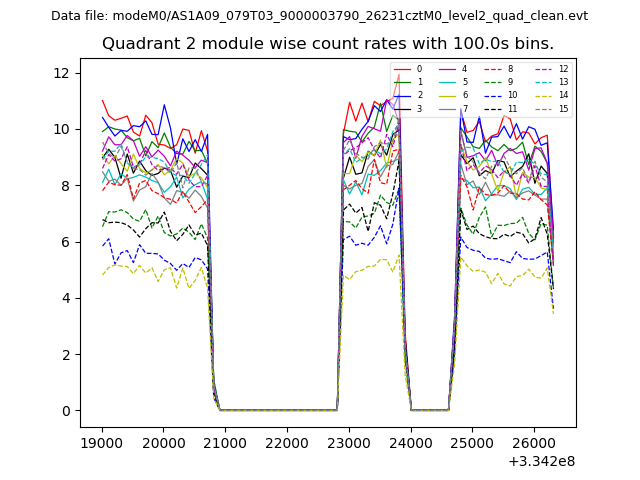
| Module-wise count rates for Quadrant B Data is divided into 100 sec bins |
 |
 |
| Module-wise count rates for Quadrant C Data is divided into 100 sec bins |
 |
 |
| Module-wise count rates for Quadrant D Data is divided into 100 sec bins |
 |
 |
| Parameter | Plot |
|---|---|
| CZT HV Monitor | 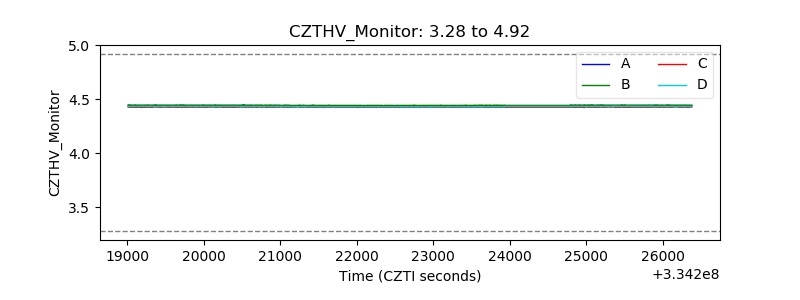 |
| D_VDD | 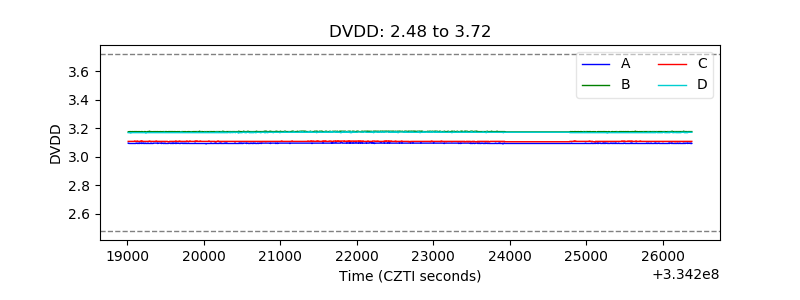 |
| Temperature 1 | 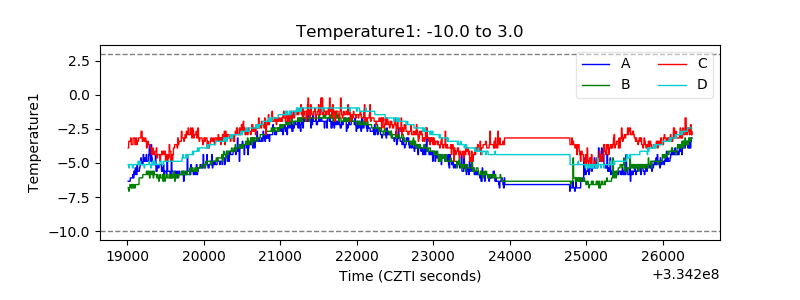 |
| Veto HV Monitor | 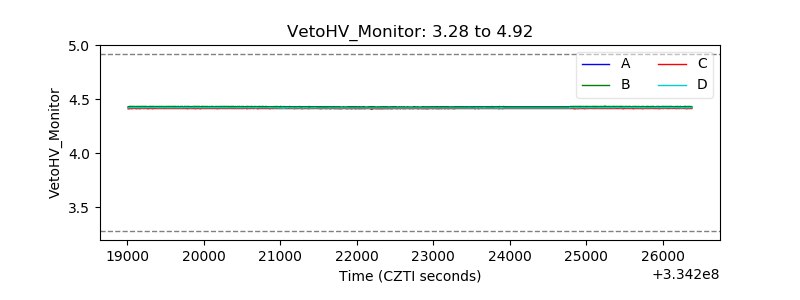 |
| Veto LLD | 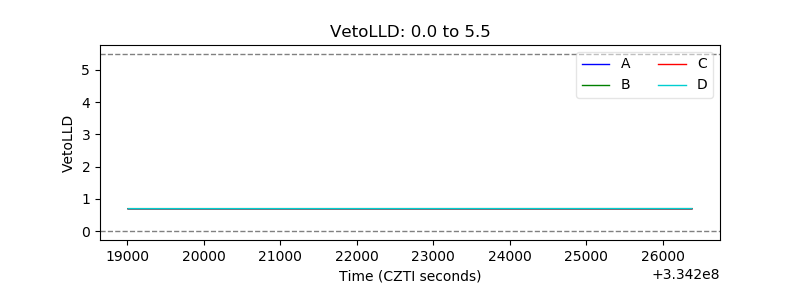 |
| Alpha Counter | 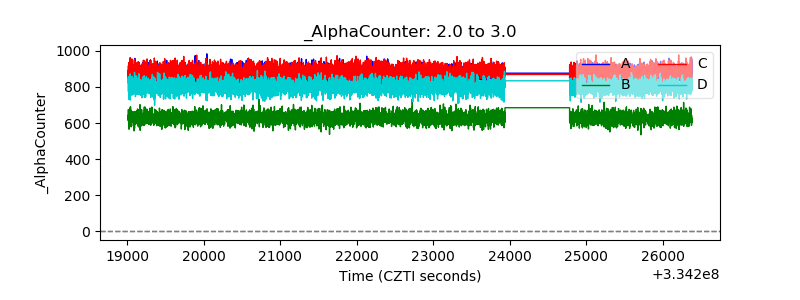 |
| _CPM_Rate | 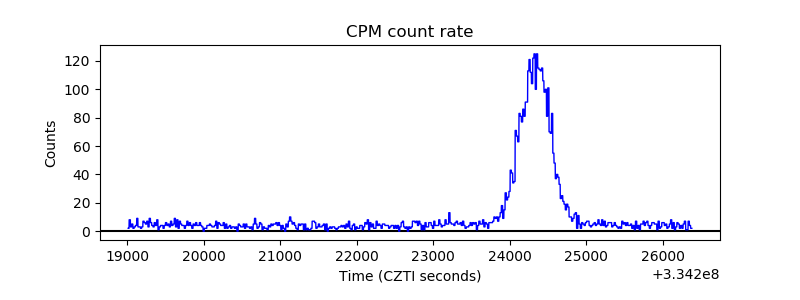 |
| CZT Counter | 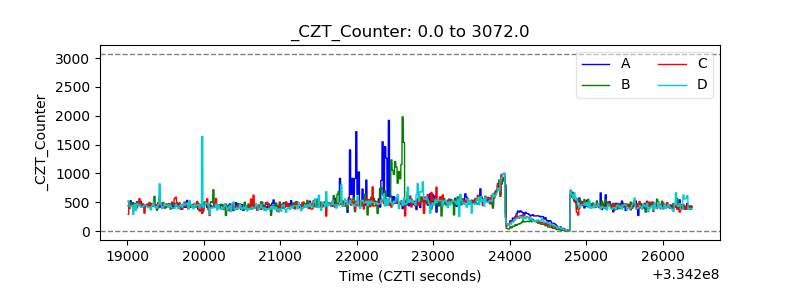 |
| +2.5 Volts monitor |  |
| +5 Volts monitor | 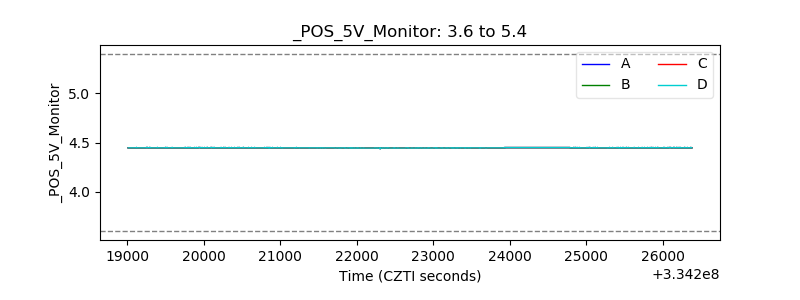 |
| _ROLL_ROT | 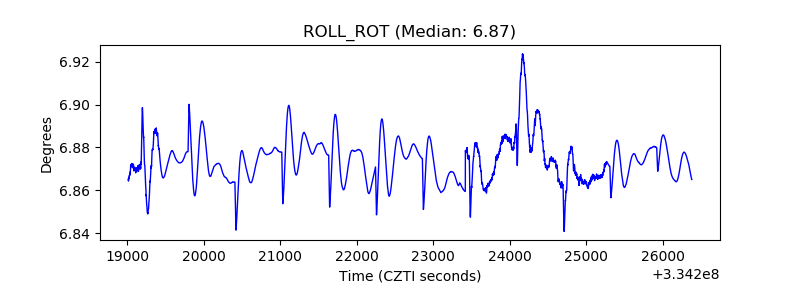 |
| _Roll_DEC | 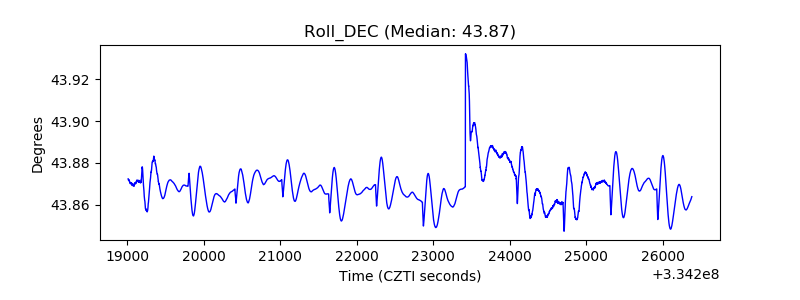 |
| _Roll_RA | 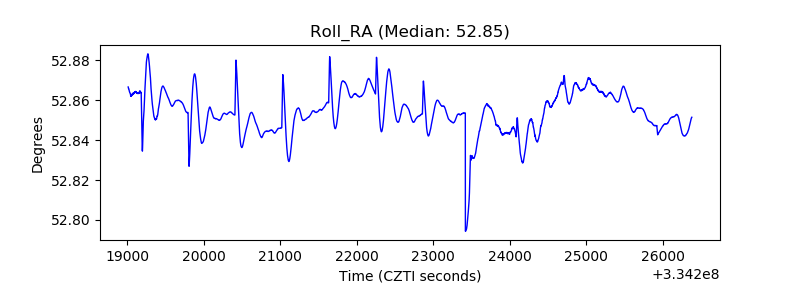 |
| Veto Counter | 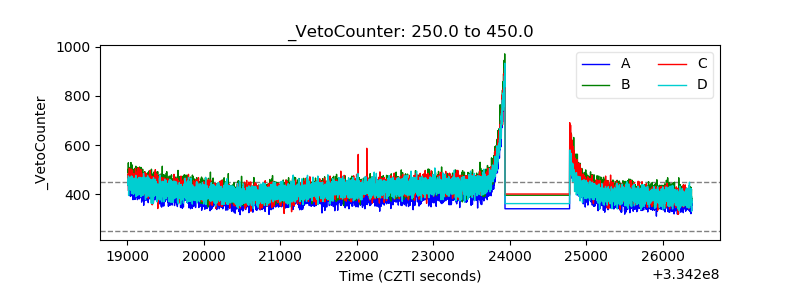 |