| Param | Original file | Final file |
|---|---|---|
| Filename | modeM0/AS1A09_079T03_9000003790_26233cztM0_level2.evt | modeM0/AS1A09_079T03_9000003790_26233cztM0_level2_quad_clean.evt |
| Size (bytes) | 539,498,880 | 91,033,920 |
| Size | 514.5 MB | 86.8 MB |
| Events in quadrant A | 3,406,037 | 570,483 |
| Events in quadrant B | 3,589,885 | 588,832 |
| Events in quadrant C | 3,491,220 | 570,030 |
| Events in quadrant D | 5,376,593 | 539,647 |
| Mode M0 | |||
|---|---|---|---|
| Quadrant | BADHDUFLAG | Total packets | Discarded packets |
| A | 0 | 14706 | 0 |
| B | 0 | 15249 | 0 |
| C | 0 | 14873 | 0 |
| D | 0 | 20672 | 0 |
| Mode M9 | |||
|---|---|---|---|
| Quadrant | BADHDUFLAG | Total packets | Discarded packets |
| A | 0 | 2 | 0 |
| B | 0 | 2 | 0 |
| C | 0 | 2 | 0 |
| D | 0 | 2 | 0 |
| Quadrant | Total seconds | Saturated seconds | Saturation percentage |
|---|---|---|---|
| A | 7002 | 231 | 3.299057% |
| B | 7003 | 235 | 3.355705% |
| C | 7003 | 249 | 3.555619% |
| D | 7003 | 676 | 9.653006% |
Noise dominated data is calculated using 1-second bins in cleaned event files. If a bin has >2000 counts, and if more than 50% of those come from <1% of pixels, then it is considered to be noise-dominated and hence unusable.
| Quadrant | # 1 sec bins | Bins with >0 counts | Bins with >2000 counts | High rate bins dominated by noise | Noise dominated (total time) | Noise dominated (detector-on time) | Marked lightcurve |
|---|---|---|---|---|---|---|---|
| A | 7157 | 7004 | 14 | 14 | 0.20% | 0.20% |  |
| B | 7158 | 7005 | 6 | 6 | 0.08% | 0.09% |  |
| C | 7158 | 7005 | 6 | 6 | 0.08% | 0.09% |  |
| D | 7158 | 7005 | 458 | 458 | 6.40% | 6.54% |  |
Top three noisy pixels from each quadrant. If the there are fewer than three noisy pixels in the level2.evt file, extra rows are filled as -1
| Pixel properties | Quadrant properties | ||||||
|---|---|---|---|---|---|---|---|
| Quadrant | DetID | PixID | Counts | Sigma | Mean | Median | Sigma |
| A | 0 | 13 | 130527 | 750.15 | 847 | 826 | 172.9 |
| A | 6 | 16 | 10505 | 55.98 | 847 | 826 | 172.9 |
| A | 13 | 254 | 10009 | 53.11 | 847 | 826 | 172.9 |
| B | 7 | 219 | 150255 | 916.55 | 842 | 819 | 163.0 |
| B | 7 | 235 | 83141 | 504.91 | 842 | 819 | 163.0 |
| B | 7 | 187 | 24969 | 148.12 | 842 | 819 | 163.0 |
| C | 3 | 233 | 200831 | 1052.27 | 810 | 814 | 190.1 |
| C | 14 | 238 | 127294 | 665.4 | 810 | 814 | 190.1 |
| C | 13 | 61 | 5596 | 25.16 | 810 | 814 | 190.1 |
| D | 1 | 52 | 1786844 | 9328.42 | 794 | 774 | 191.5 |
| D | 12 | 233 | 536031 | 2795.58 | 794 | 774 | 191.5 |
| D | 2 | 234 | 28022 | 142.31 | 794 | 774 | 191.5 |
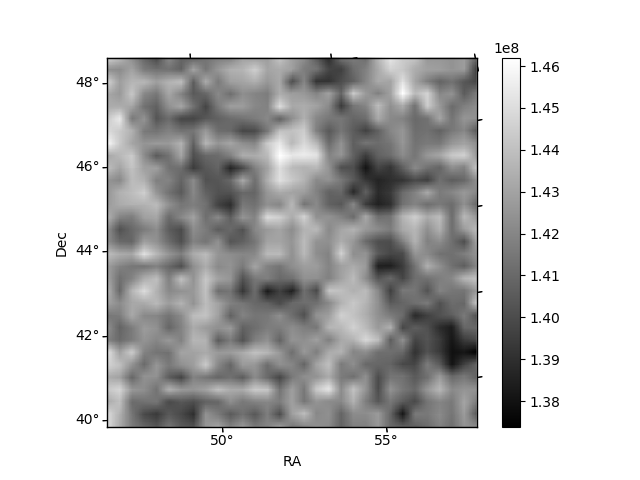
Histogram calculated using DETX and DETY for each event in the final _common_clean file
| Quadrant A | 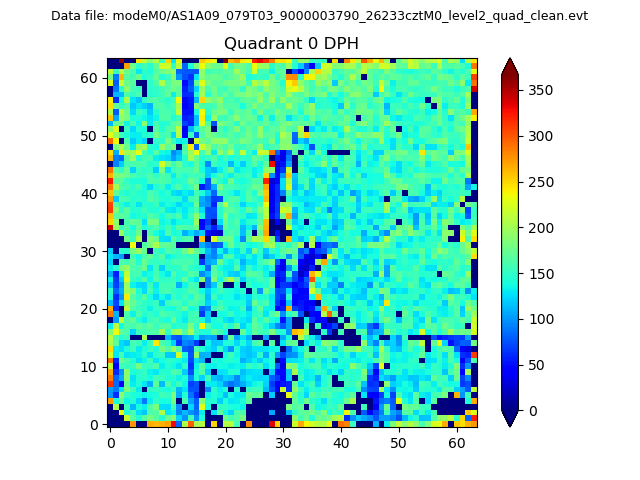 |
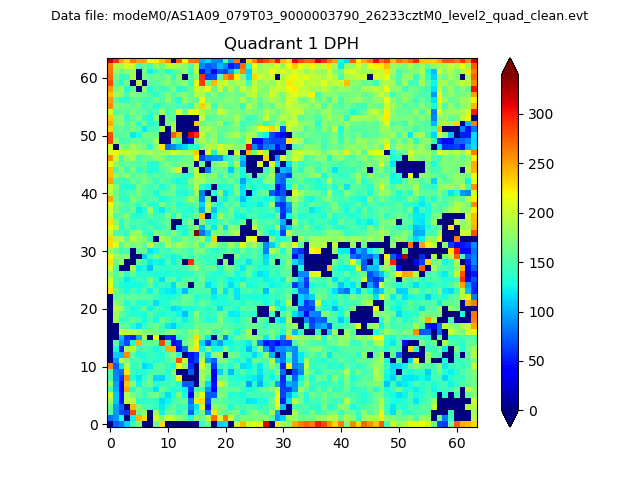 |
Quadrant B |
|---|---|---|---|
| Quadrant D | 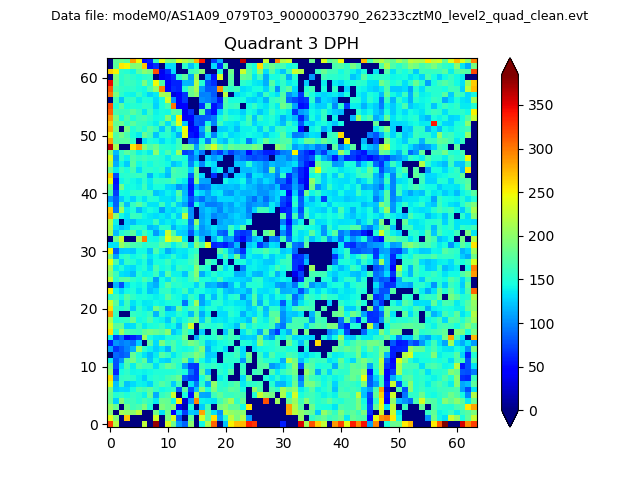 |
 |
Quadrant C |
| Plot type | Count rate plots | Images |
|---|---|---|
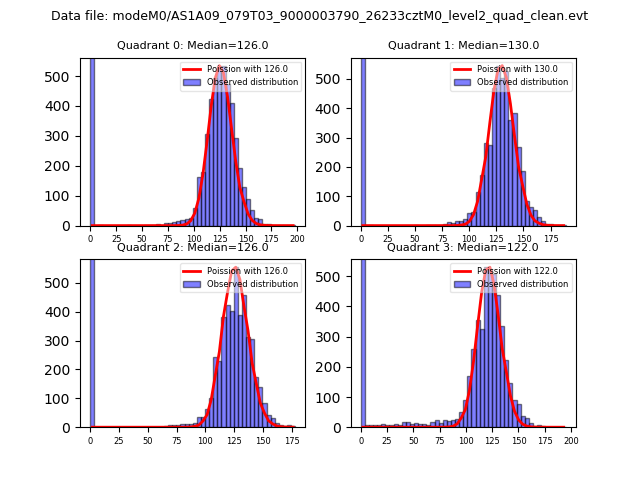
| Comparison with Poisson distribution Blue bars denote a histogram of data divided into 1 sec bins. Red curve is a Poisson curve with rate = median count rate of data. |
 |
 |
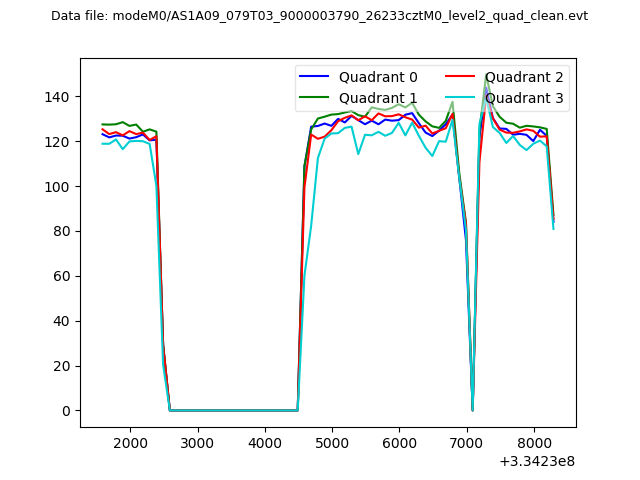
| Quadrant-wise count rates Data is divided into 100 sec bins |
 |
|
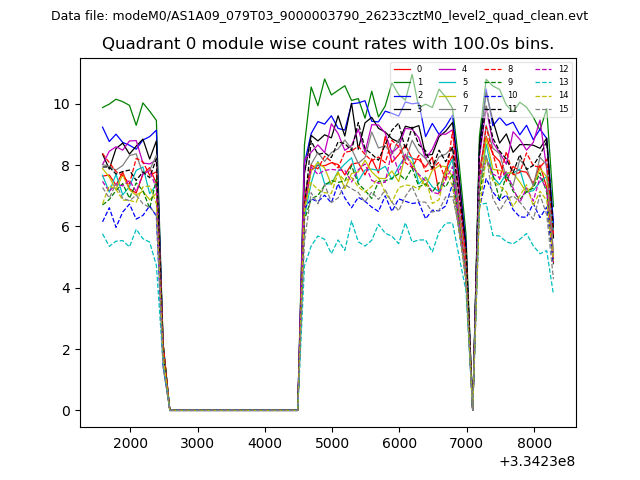
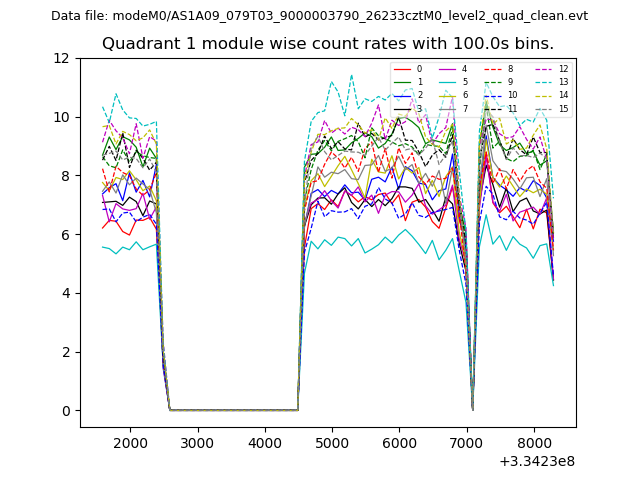
| Module-wise count rates for Quadrant A Data is divided into 100 sec bins |
 |
 |
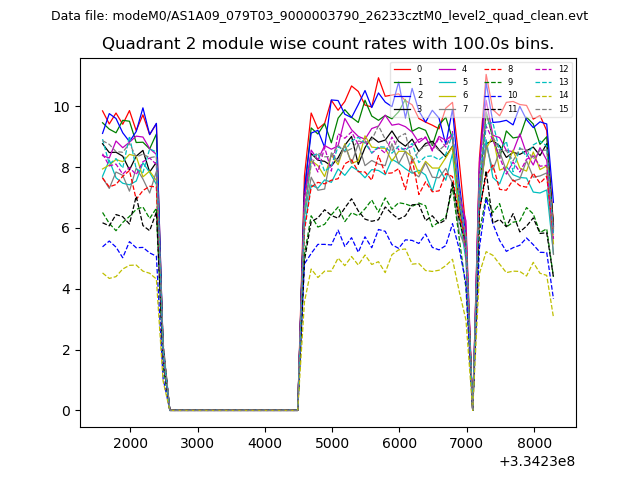
| Module-wise count rates for Quadrant B Data is divided into 100 sec bins |
 |
 |
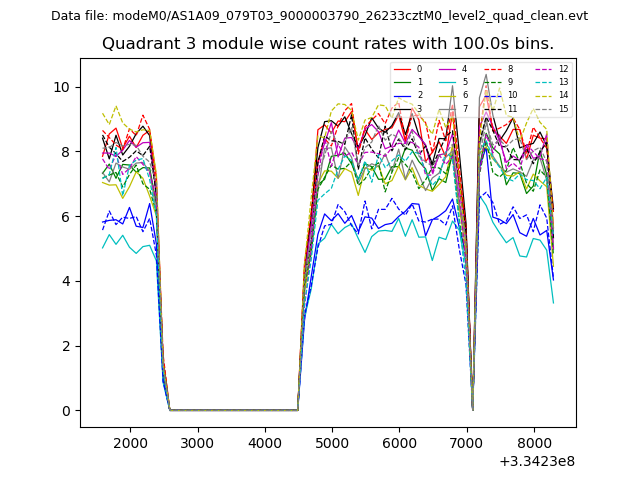
| Module-wise count rates for Quadrant C Data is divided into 100 sec bins |
 |
 |
| Module-wise count rates for Quadrant D Data is divided into 100 sec bins |
 |
 |
| Parameter | Plot |
|---|---|
| CZT HV Monitor | 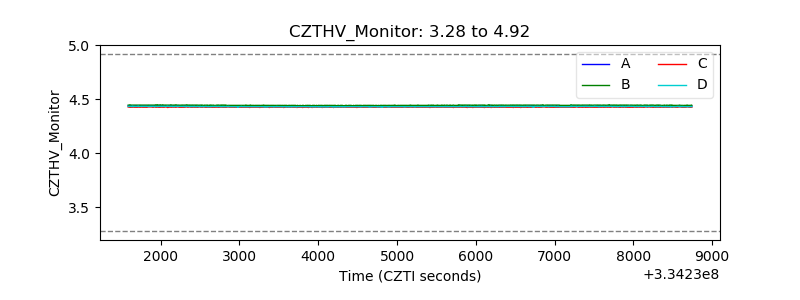 |
| D_VDD | 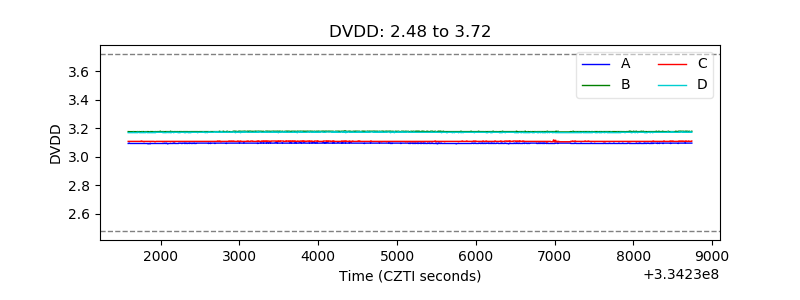 |
| Temperature 1 | 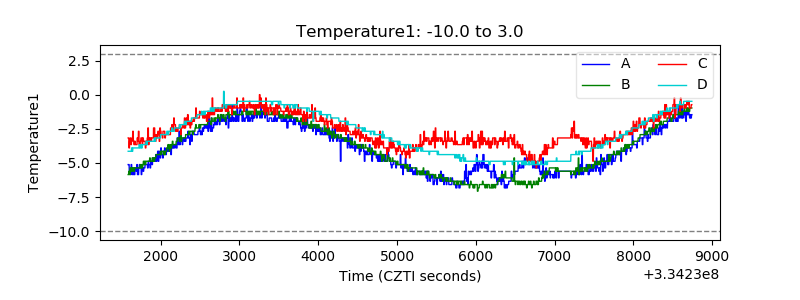 |
| Veto HV Monitor | 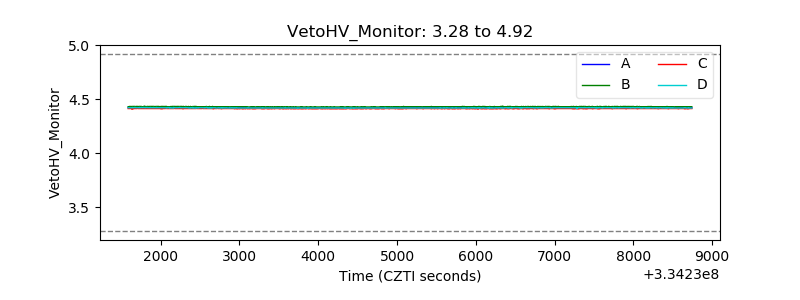 |
| Veto LLD | 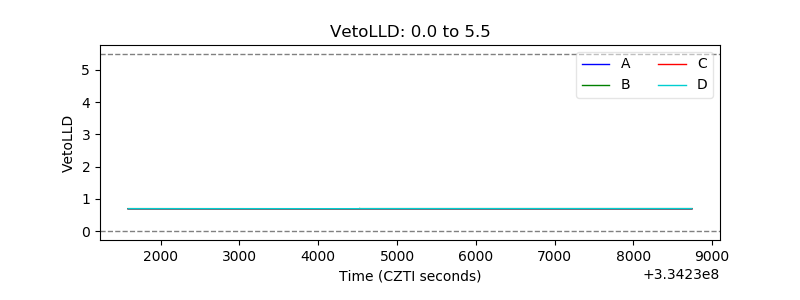 |
| Alpha Counter | 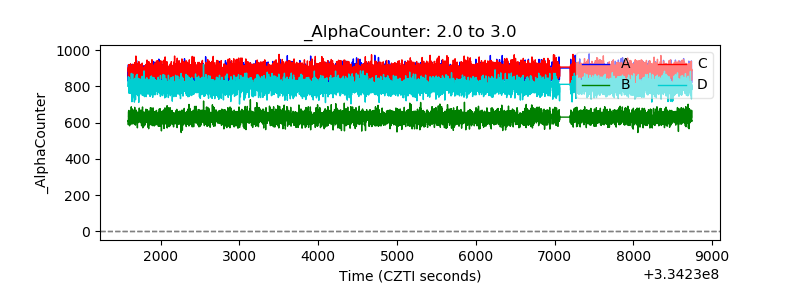 |
| _CPM_Rate | 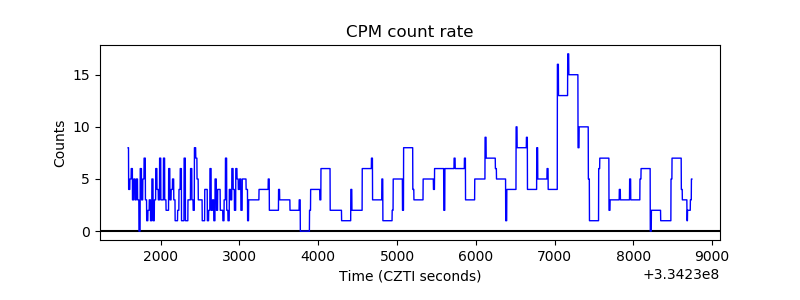 |
| CZT Counter | 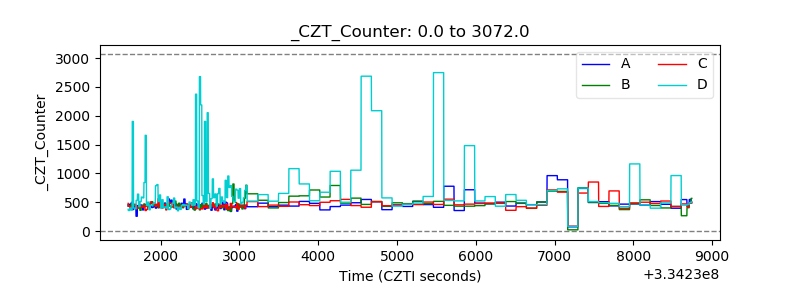 |
| +2.5 Volts monitor |  |
| +5 Volts monitor |  |
| _ROLL_ROT | 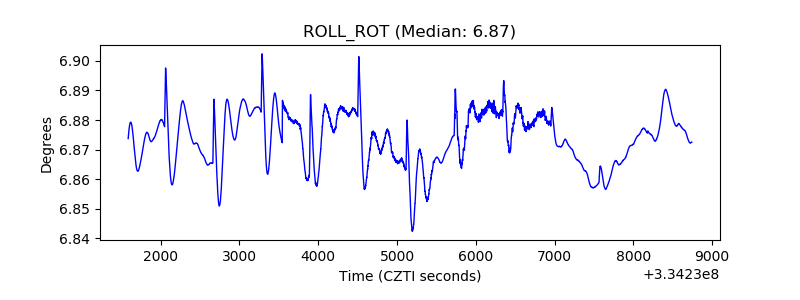 |
| _Roll_DEC | 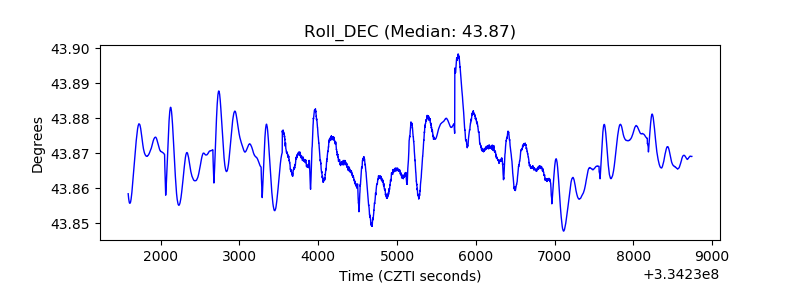 |
| _Roll_RA | 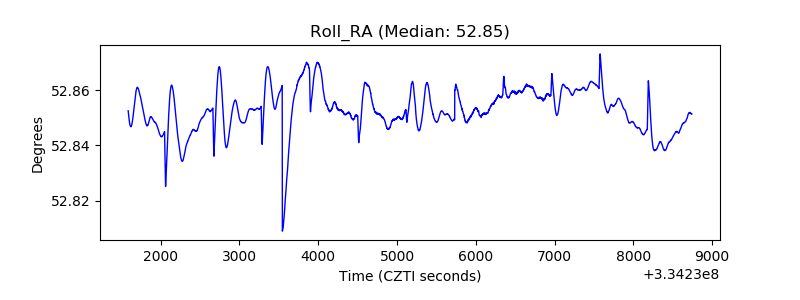 |
| Veto Counter | 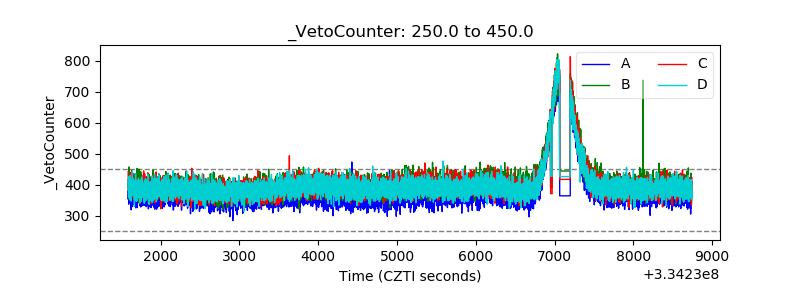 |