| Param | Original file | Final file |
|---|---|---|
| Filename | modeM0/AS1A09_079T03_9000003790_26234cztM0_level2.evt | modeM0/AS1A09_079T03_9000003790_26234cztM0_level2_quad_clean.evt |
| Size (bytes) | 622,517,760 | 92,318,400 |
| Size | 593.7 MB | 88.0 MB |
| Events in quadrant A | 4,046,298 | 574,097 |
| Events in quadrant B | 3,817,091 | 591,856 |
| Events in quadrant C | 3,901,487 | 573,477 |
| Events in quadrant D | 6,568,624 | 522,778 |
| Mode M0 | |||
|---|---|---|---|
| Quadrant | BADHDUFLAG | Total packets | Discarded packets |
| A | 0 | 16912 | 0 |
| B | 0 | 16224 | 0 |
| C | 0 | 16442 | 0 |
| D | 0 | 24577 | 0 |
| Mode M9 | |||
|---|---|---|---|
| Quadrant | BADHDUFLAG | Total packets | Discarded packets |
| A | 0 | 4 | 0 |
| B | 0 | 4 | 0 |
| C | 0 | 4 | 0 |
| D | 0 | 4 | 0 |
| Quadrant | Total seconds | Saturated seconds | Saturation percentage |
|---|---|---|---|
| A | 7664 | 249 | 3.248956% |
| B | 7665 | 192 | 2.504892% |
| C | 7665 | 217 | 2.831050% |
| D | 7665 | 1071 | 13.972603% |
Noise dominated data is calculated using 1-second bins in cleaned event files. If a bin has >2000 counts, and if more than 50% of those come from <1% of pixels, then it is considered to be noise-dominated and hence unusable.
| Quadrant | # 1 sec bins | Bins with >0 counts | Bins with >2000 counts | High rate bins dominated by noise | Noise dominated (total time) | Noise dominated (detector-on time) | Marked lightcurve |
|---|---|---|---|---|---|---|---|
| A | 8024 | 7665 | 56 | 56 | 0.70% | 0.73% | 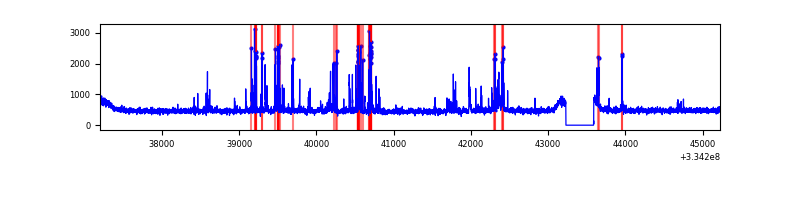 |
| B | 8025 | 7666 | 20 | 20 | 0.25% | 0.26% | 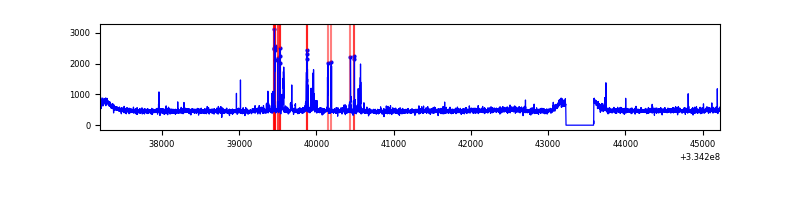 |
| C | 8025 | 7666 | 4 | 4 | 0.05% | 0.05% | 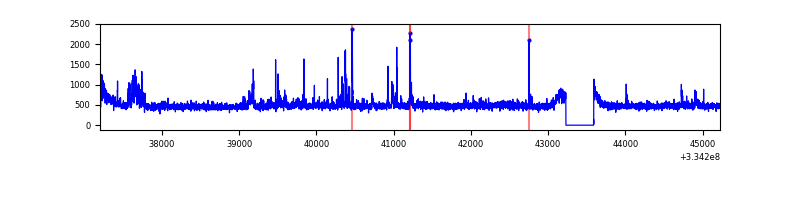 |
| D | 8025 | 7666 | 839 | 839 | 10.45% | 10.94% | 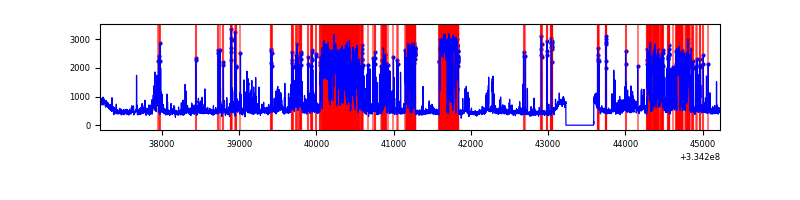 |
Top three noisy pixels from each quadrant. If the there are fewer than three noisy pixels in the level2.evt file, extra rows are filled as -1
| Pixel properties | Quadrant properties | ||||||
|---|---|---|---|---|---|---|---|
| Quadrant | DetID | PixID | Counts | Sigma | Mean | Median | Sigma |
| A | 0 | 13 | 432977 | 2273.35 | 934 | 913 | 190.1 |
| A | 6 | 16 | 12683 | 61.93 | 934 | 913 | 190.1 |
| A | 13 | 254 | 11053 | 53.35 | 934 | 913 | 190.1 |
| B | 5 | 172 | 149030 | 829.94 | 928 | 904 | 178.5 |
| B | 12 | 111 | 21886 | 117.56 | 928 | 904 | 178.5 |
| B | 11 | 111 | 19409 | 103.68 | 928 | 904 | 178.5 |
| C | 3 | 233 | 268209 | 1275.65 | 892 | 897 | 209.5 |
| C | 14 | 238 | 140869 | 667.97 | 892 | 897 | 209.5 |
| C | 2 | 16 | 18403 | 83.54 | 892 | 897 | 209.5 |
| D | 1 | 52 | 1866470 | 9144.71 | 851 | 830 | 204.0 |
| D | 12 | 233 | 1438541 | 7047.16 | 851 | 830 | 204.0 |
| D | 2 | 234 | 31069 | 148.22 | 851 | 830 | 204.0 |
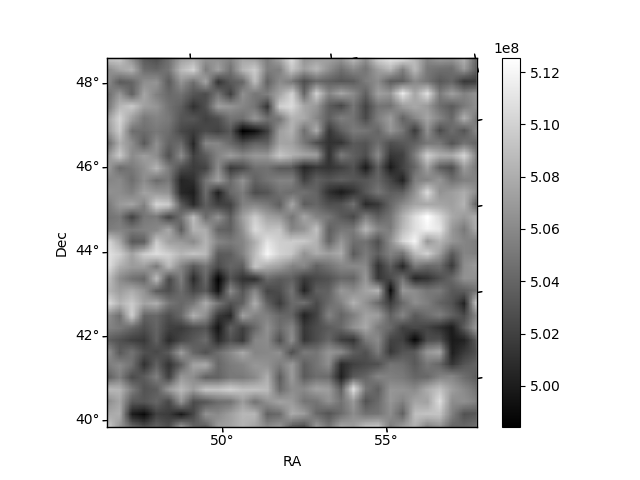
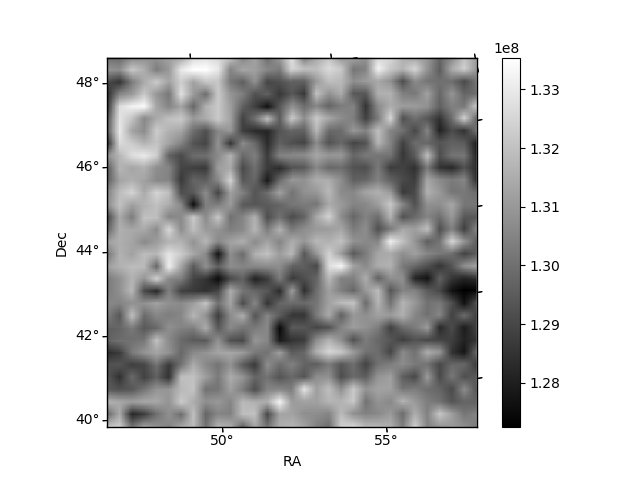
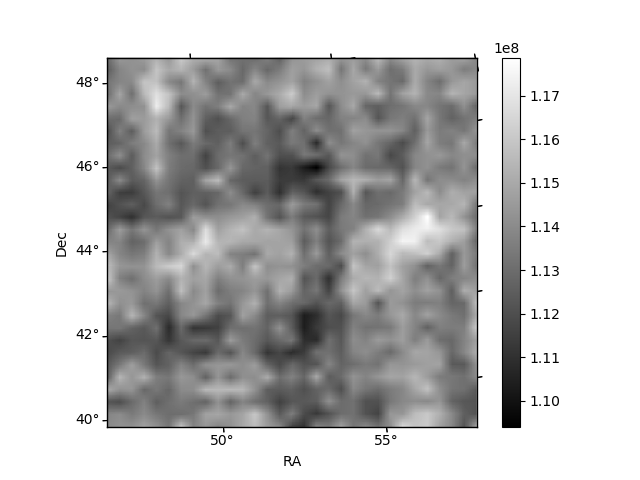
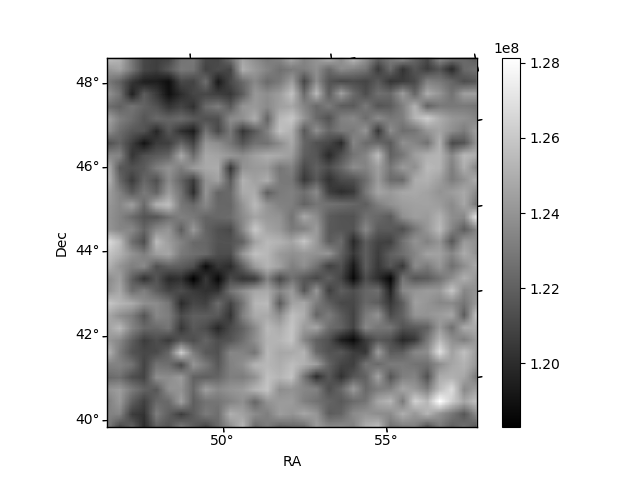
Histogram calculated using DETX and DETY for each event in the final _common_clean file
| Quadrant A | 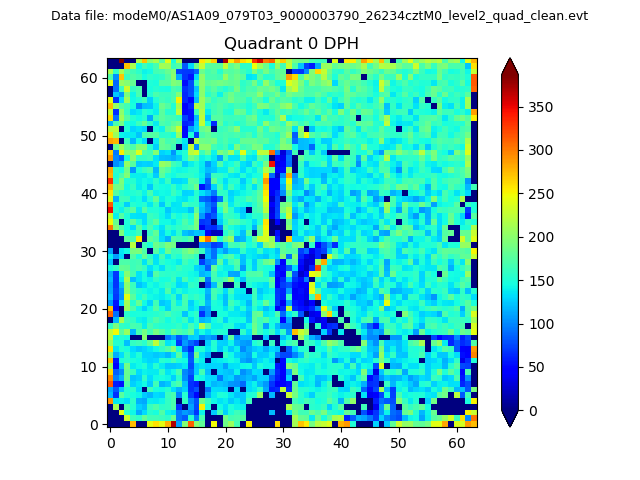 |
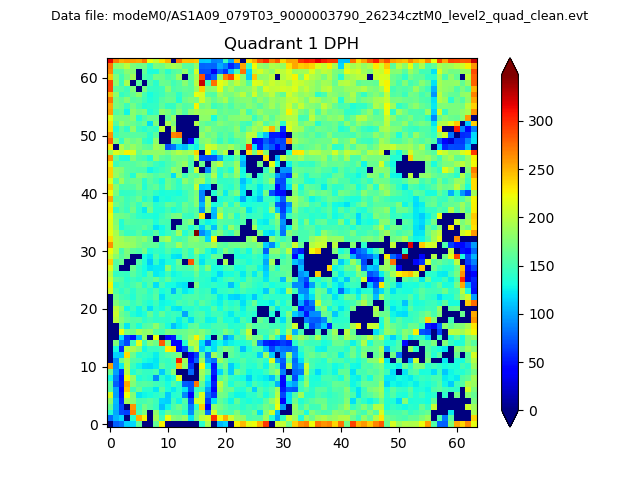 |
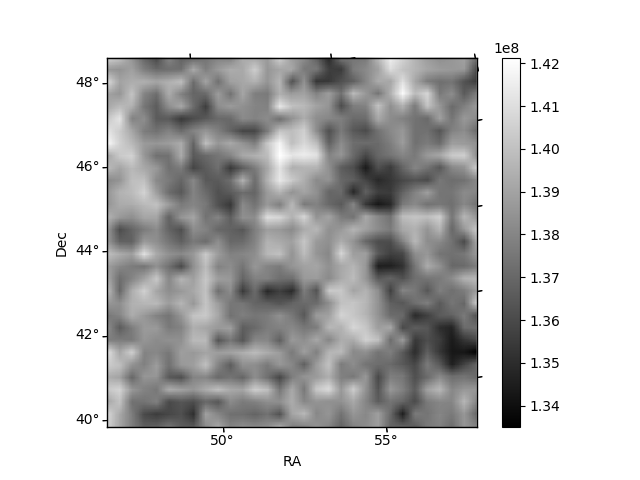
Quadrant B |
|---|---|---|---|
| Quadrant D | 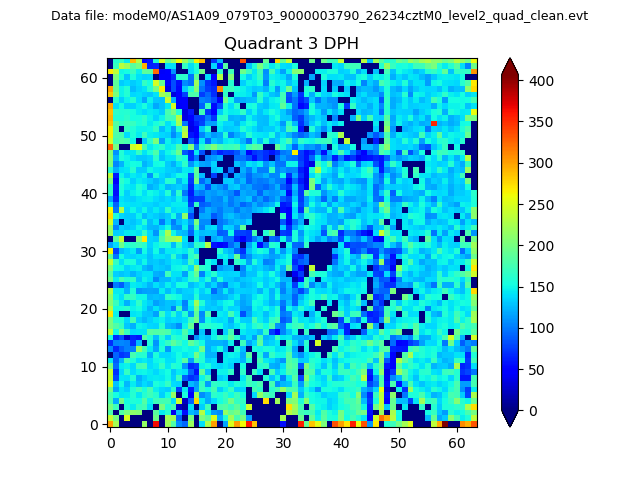 |
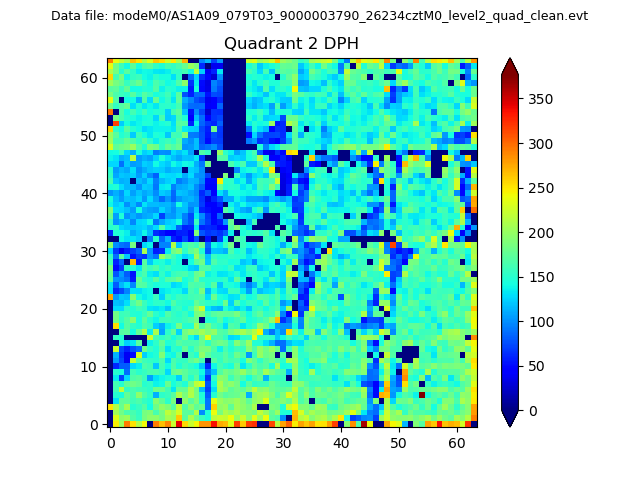 |
Quadrant C |
| Plot type | Count rate plots | Images |
|---|---|---|
| Comparison with Poisson distribution Blue bars denote a histogram of data divided into 1 sec bins. Red curve is a Poisson curve with rate = median count rate of data. |
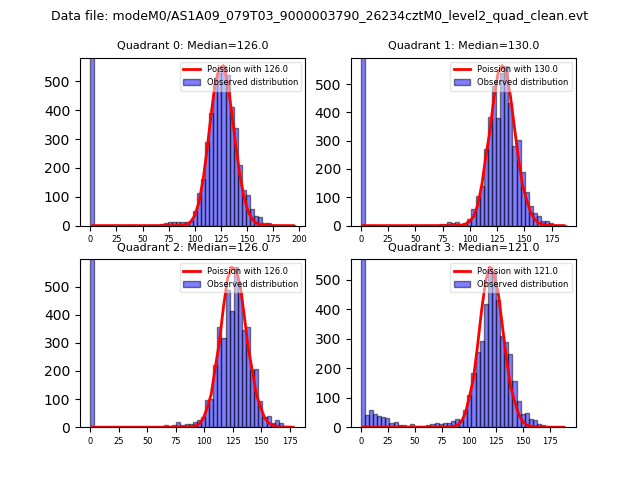 |
 |
| Quadrant-wise count rates Data is divided into 100 sec bins |
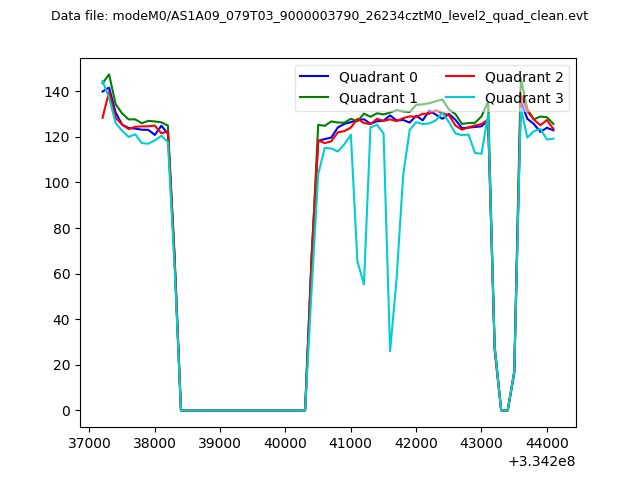 |
|
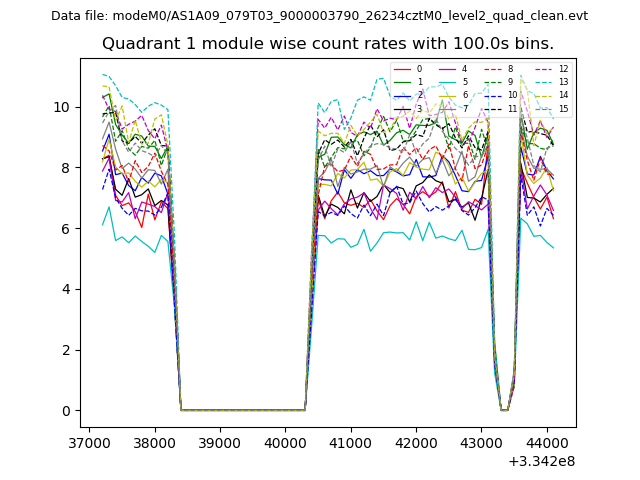
| Module-wise count rates for Quadrant A Data is divided into 100 sec bins |
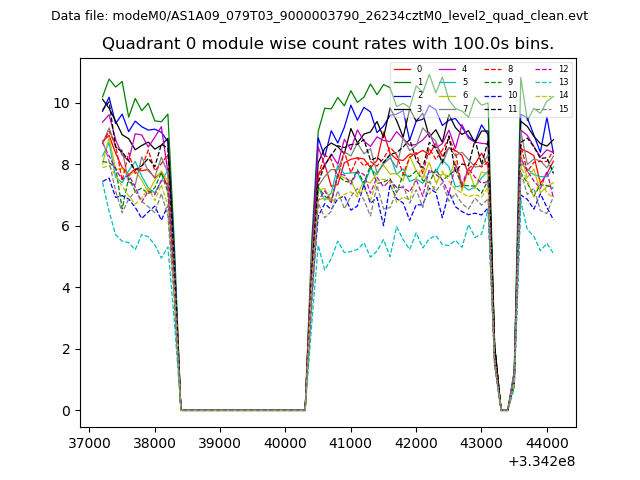 |
 |
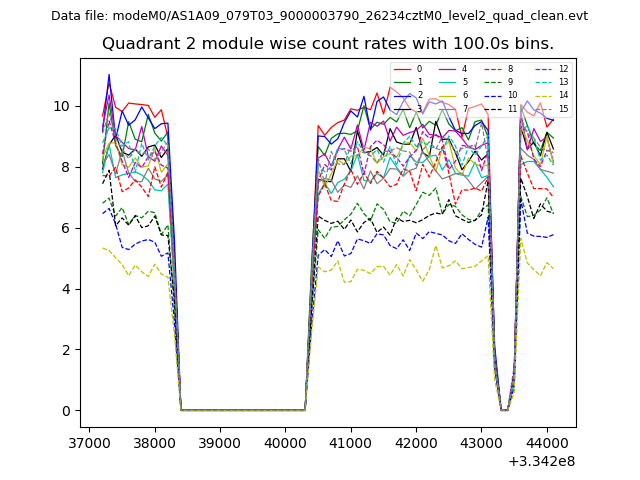
| Module-wise count rates for Quadrant B Data is divided into 100 sec bins |
 |
 |
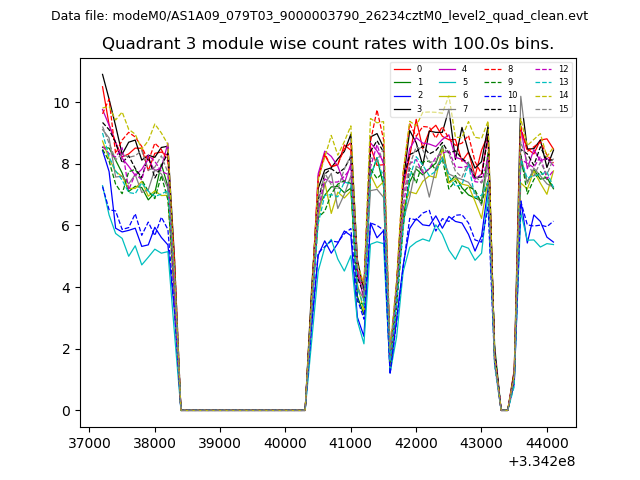
| Module-wise count rates for Quadrant C Data is divided into 100 sec bins |
 |
 |
| Module-wise count rates for Quadrant D Data is divided into 100 sec bins |
 |
 |
| Parameter | Plot |
|---|---|
| CZT HV Monitor | 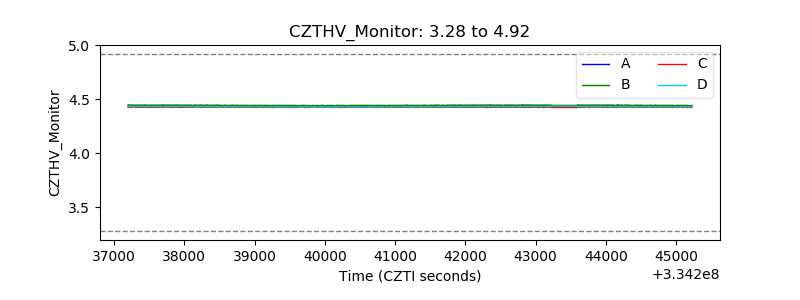 |
| D_VDD | 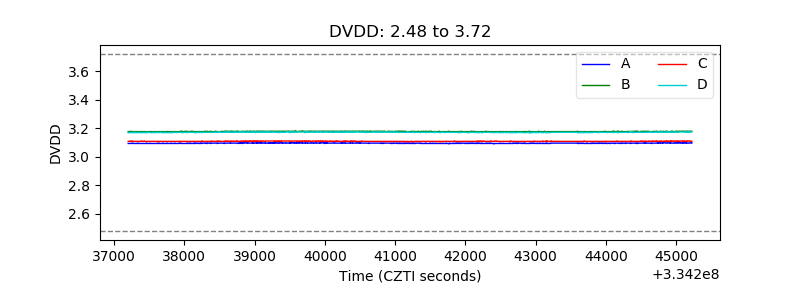 |
| Temperature 1 | 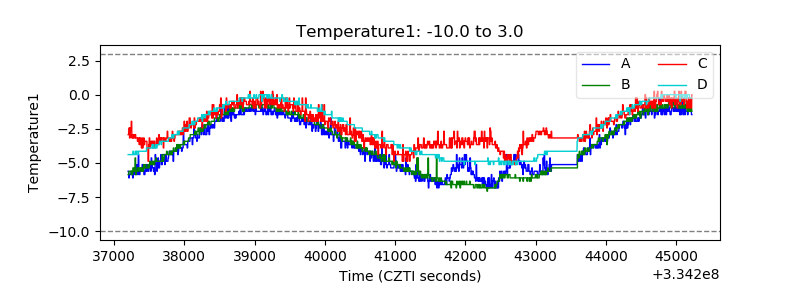 |
| Veto HV Monitor | 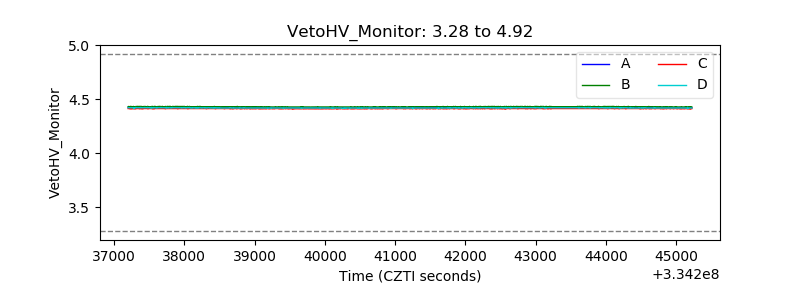 |
| Veto LLD | 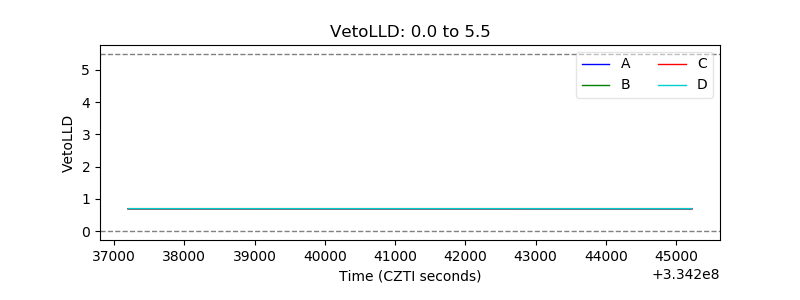 |
| Alpha Counter | 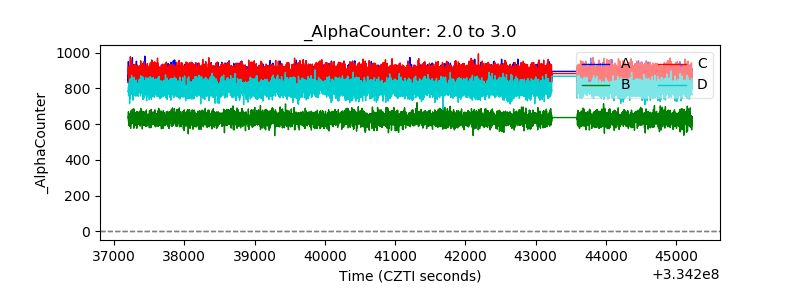 |
| _CPM_Rate | 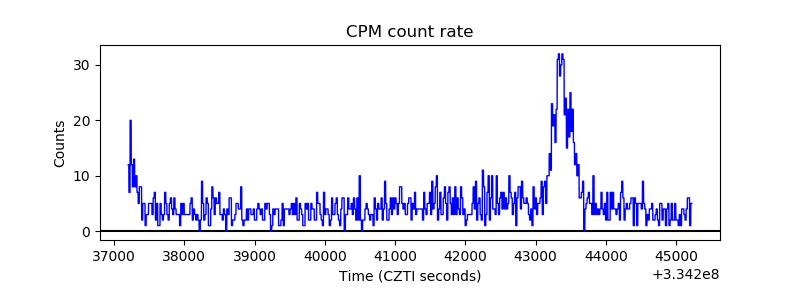 |
| CZT Counter | 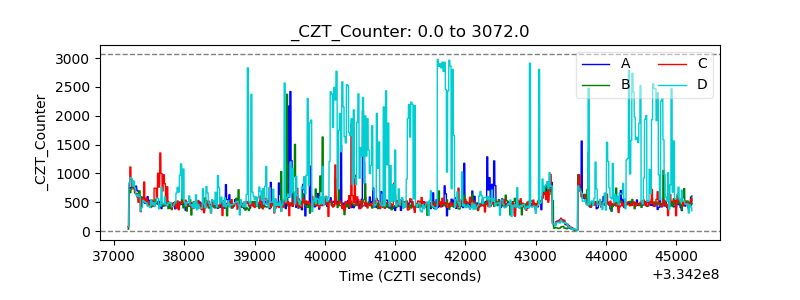 |
| +2.5 Volts monitor | 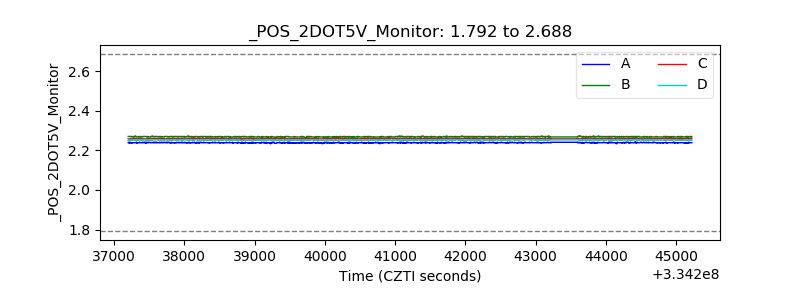 |
| +5 Volts monitor |  |
| _ROLL_ROT | 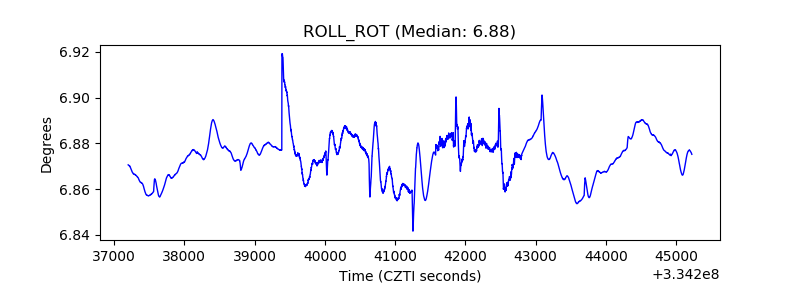 |
| _Roll_DEC | 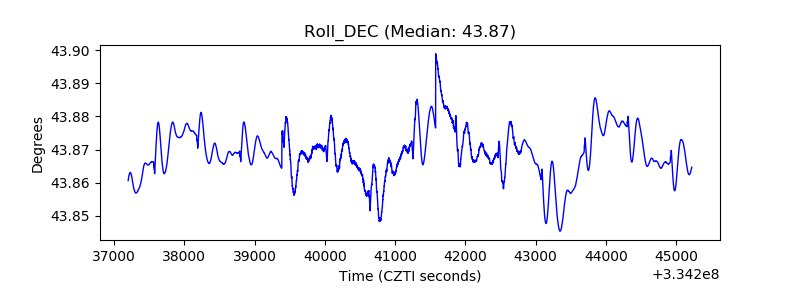 |
| _Roll_RA | 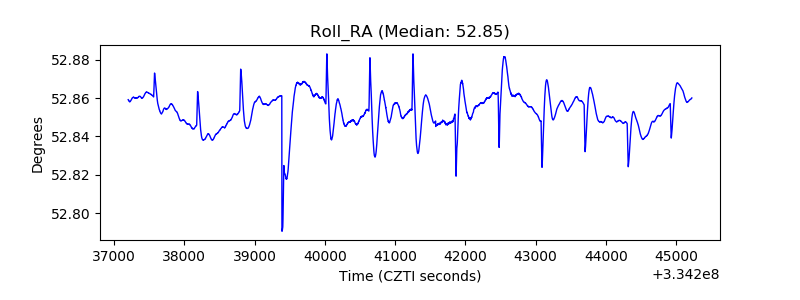 |
| Veto Counter | 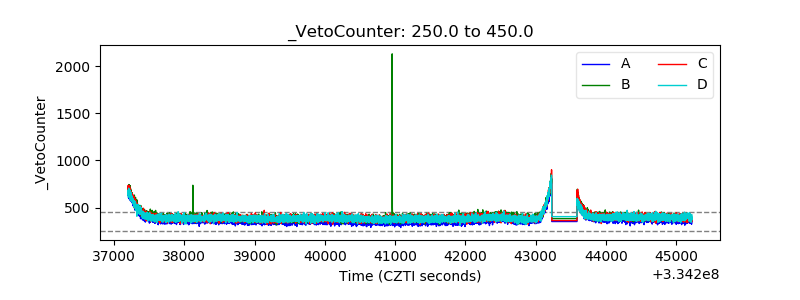 |