| Param | Original file | Final file |
|---|---|---|
| Filename | modeM0/AS1A09_079T03_9000003790_26236cztM0_level2.evt | modeM0/AS1A09_079T03_9000003790_26236cztM0_level2_quad_clean.evt |
| Size (bytes) | 741,948,480 | 117,639,360 |
| Size | 707.6 MB | 112.2 MB |
| Events in quadrant A | 5,010,663 | 717,641 |
| Events in quadrant B | 5,147,923 | 737,176 |
| Events in quadrant C | 4,766,374 | 718,387 |
| Events in quadrant D | 6,869,431 | 698,163 |
| Mode M0 | |||
|---|---|---|---|
| Quadrant | BADHDUFLAG | Total packets | Discarded packets |
| A | 0 | 21392 | 0 |
| B | 0 | 21744 | 0 |
| C | 0 | 20482 | 0 |
| D | 0 | 27150 | 0 |
| Mode M9 | |||
|---|---|---|---|
| Quadrant | BADHDUFLAG | Total packets | Discarded packets |
| A | 0 | 5 | 0 |
| B | 0 | 5 | 0 |
| C | 0 | 5 | 0 |
| D | 0 | 5 | 0 |
| Quadrant | Total seconds | Saturated seconds | Saturation percentage |
|---|---|---|---|
| A | 9971 | 164 | 1.644770% |
| B | 9972 | 237 | 2.376655% |
| C | 9972 | 147 | 1.474128% |
| D | 9972 | 589 | 5.906538% |
Noise dominated data is calculated using 1-second bins in cleaned event files. If a bin has >2000 counts, and if more than 50% of those come from <1% of pixels, then it is considered to be noise-dominated and hence unusable.
| Quadrant | # 1 sec bins | Bins with >0 counts | Bins with >2000 counts | High rate bins dominated by noise | Noise dominated (total time) | Noise dominated (detector-on time) | Marked lightcurve |
|---|---|---|---|---|---|---|---|
| A | 10481 | 9971 | 70 | 70 | 0.67% | 0.70% | 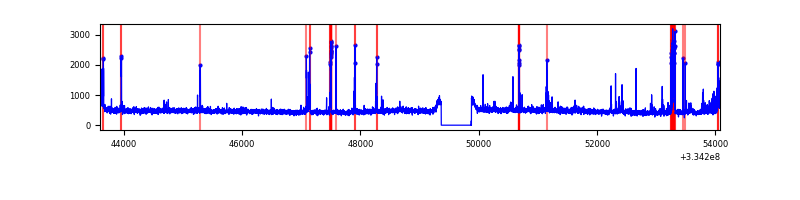 |
| B | 10482 | 9972 | 110 | 110 | 1.05% | 1.10% | 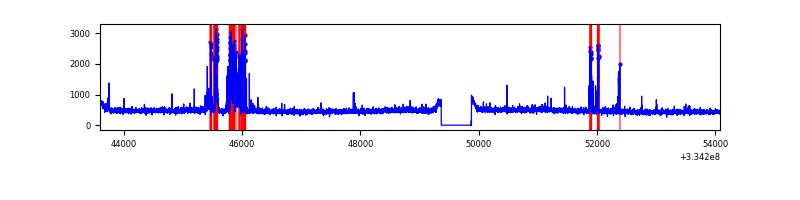 |
| C | 10482 | 9972 | 1 | 1 | 0.01% | 0.01% | 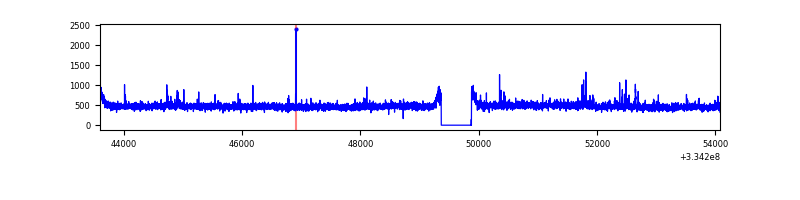 |
| D | 10482 | 9972 | 428 | 428 | 4.08% | 4.29% | 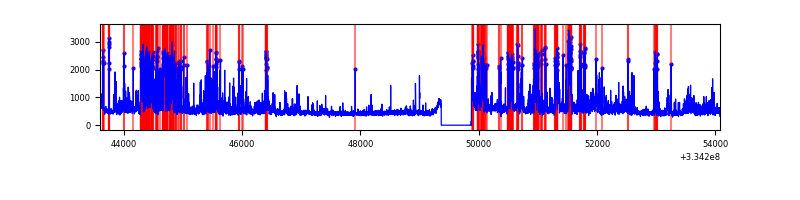 |
Top three noisy pixels from each quadrant. If the there are fewer than three noisy pixels in the level2.evt file, extra rows are filled as -1
| Pixel properties | Quadrant properties | ||||||
|---|---|---|---|---|---|---|---|
| Quadrant | DetID | PixID | Counts | Sigma | Mean | Median | Sigma |
| A | 0 | 13 | 428325 | 1782.32 | 1184 | 1158 | 239.7 |
| A | 13 | 254 | 15141 | 58.34 | 1184 | 1158 | 239.7 |
| A | 5 | 168 | 11575 | 43.46 | 1184 | 1158 | 239.7 |
| B | 5 | 172 | 492895 | 2194.56 | 1177 | 1149 | 224.1 |
| B | 12 | 111 | 27119 | 115.9 | 1177 | 1149 | 224.1 |
| B | 11 | 111 | 24152 | 102.66 | 1177 | 1149 | 224.1 |
| C | 14 | 238 | 181080 | 670.72 | 1142 | 1148 | 268.3 |
| C | 3 | 233 | 121764 | 449.61 | 1142 | 1148 | 268.3 |
| C | 2 | 16 | 12059 | 40.67 | 1142 | 1148 | 268.3 |
| D | 1 | 52 | 1764290 | 6526.62 | 1127 | 1101 | 270.2 |
| D | 12 | 233 | 725515 | 2681.49 | 1127 | 1101 | 270.2 |
| D | 7 | 38 | 56792 | 206.15 | 1127 | 1101 | 270.2 |
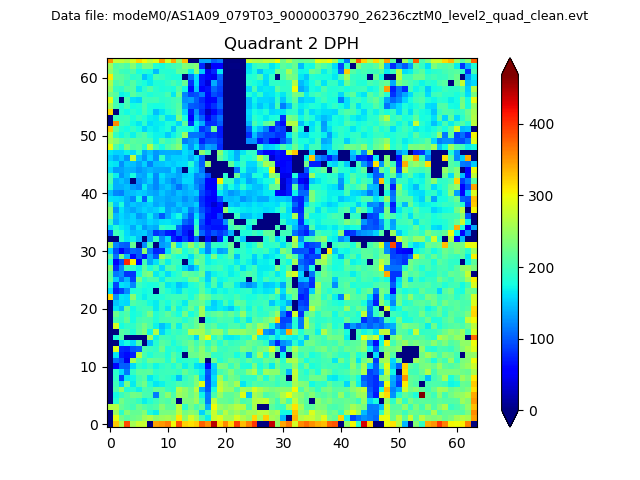
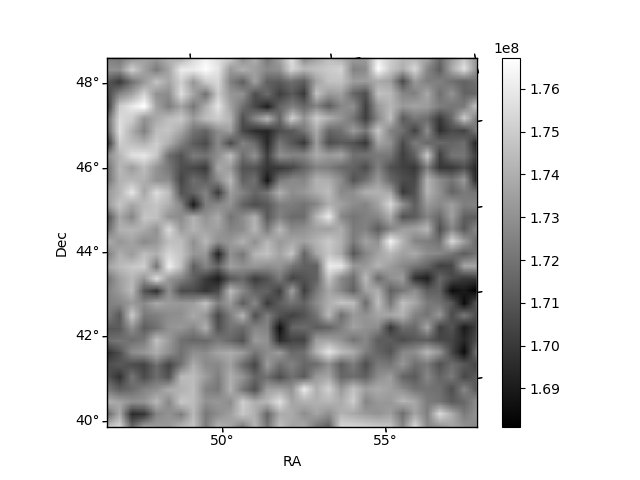
Histogram calculated using DETX and DETY for each event in the final _common_clean file
| Quadrant A |  |
 |
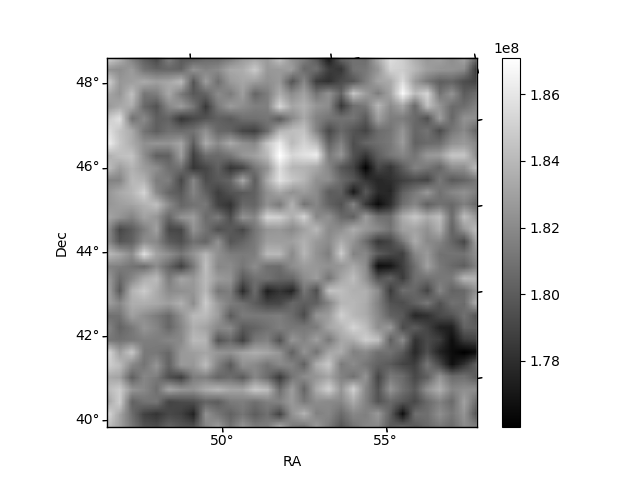
Quadrant B |
|---|---|---|---|
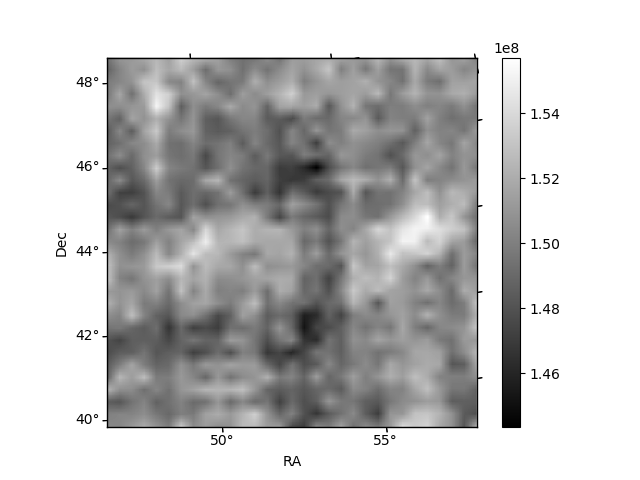
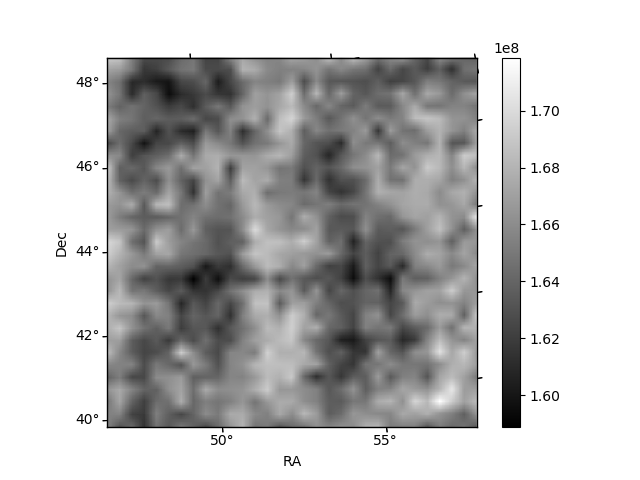
| Quadrant D | 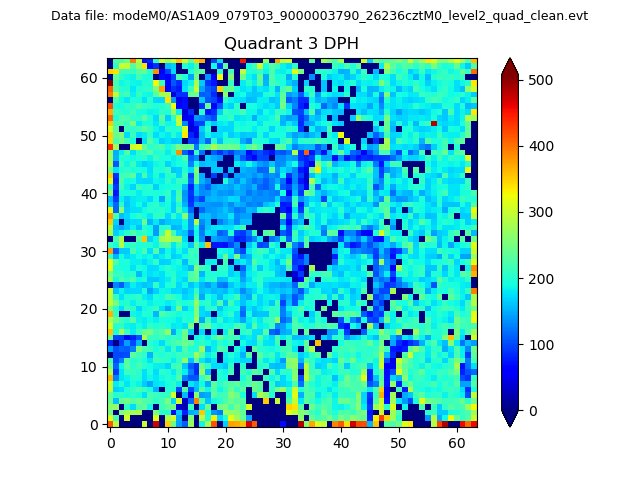 |
 |
Quadrant C |
| Plot type | Count rate plots | Images |
|---|---|---|
| Comparison with Poisson distribution Blue bars denote a histogram of data divided into 1 sec bins. Red curve is a Poisson curve with rate = median count rate of data. |
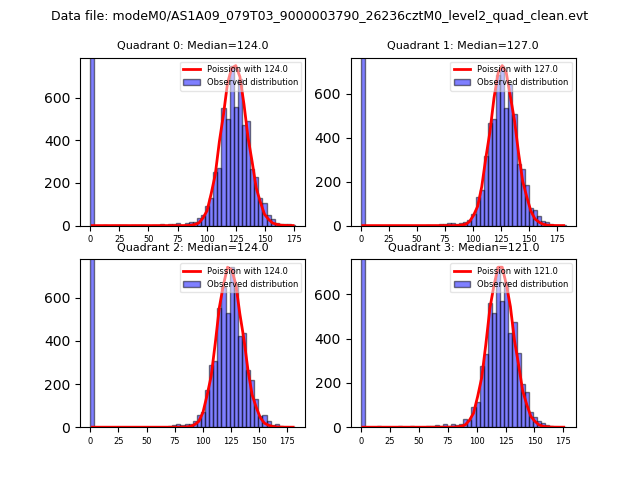 |
 |
| Quadrant-wise count rates Data is divided into 100 sec bins |
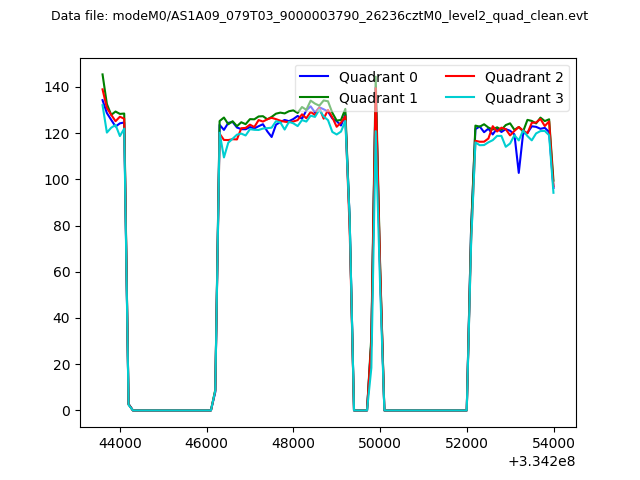 |
|
| Module-wise count rates for Quadrant A Data is divided into 100 sec bins |
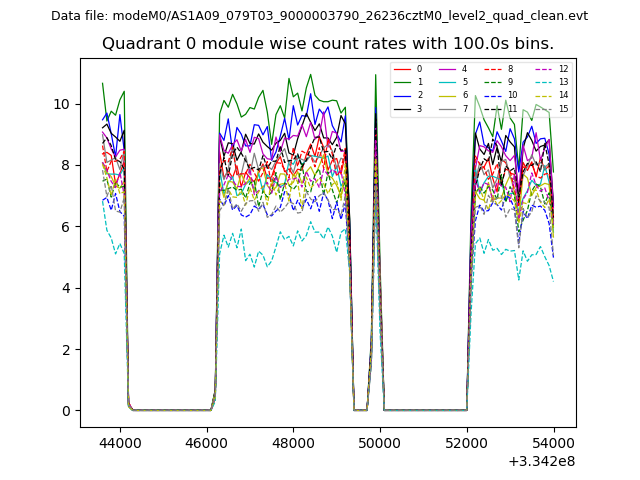 |
 |
| Module-wise count rates for Quadrant B Data is divided into 100 sec bins |
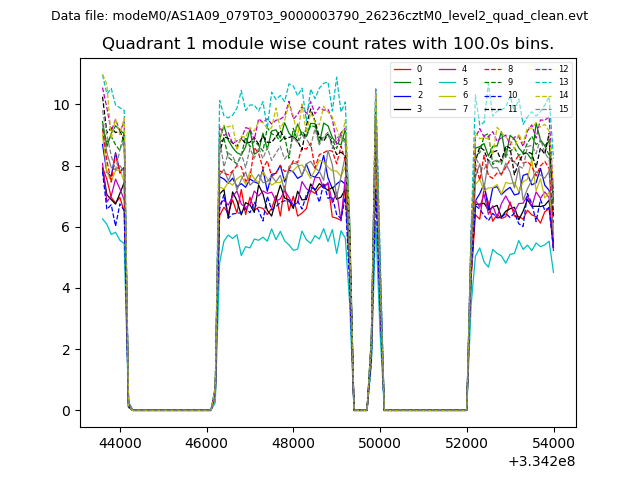 |
 |
| Module-wise count rates for Quadrant C Data is divided into 100 sec bins |
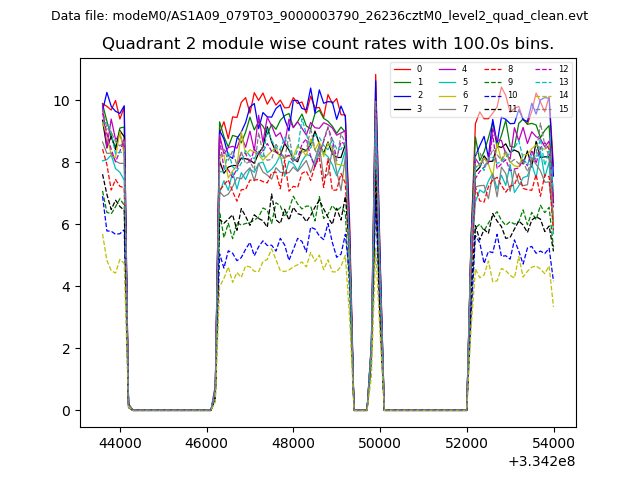 |
 |
| Module-wise count rates for Quadrant D Data is divided into 100 sec bins |
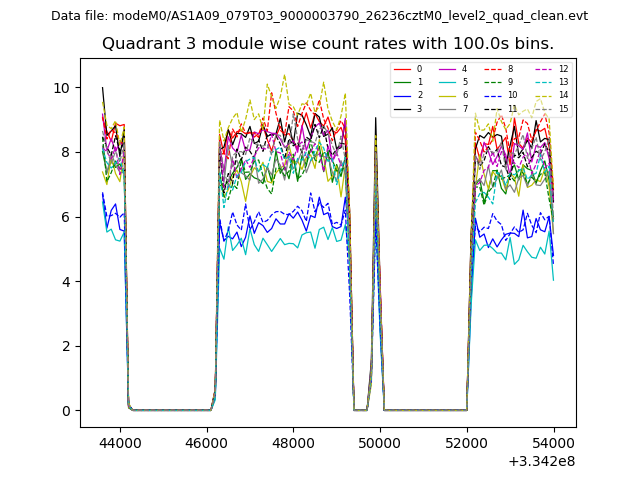 |
 |
| Parameter | Plot |
|---|---|
| CZT HV Monitor | 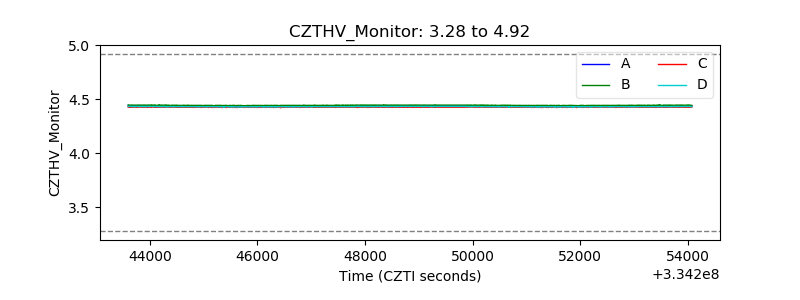 |
| D_VDD | 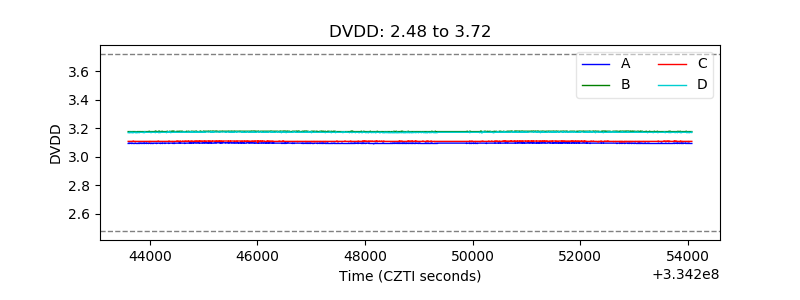 |
| Temperature 1 | 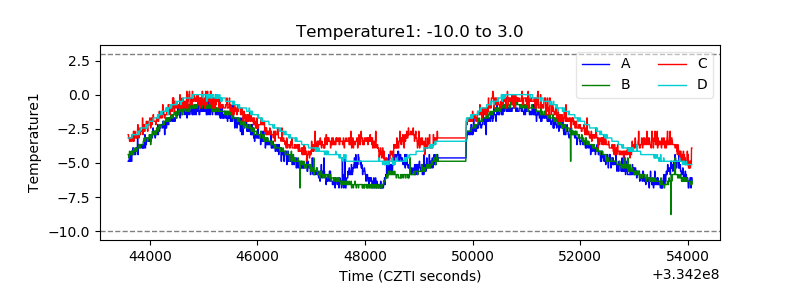 |
| Veto HV Monitor | 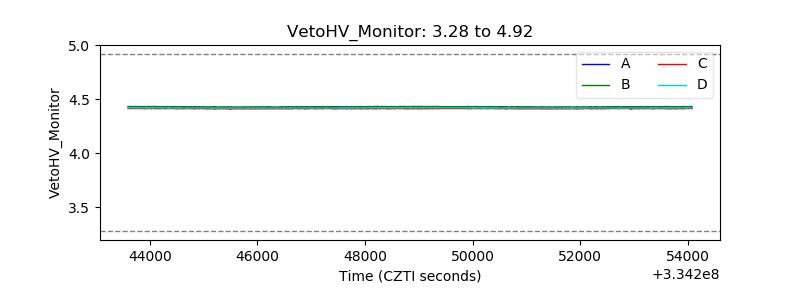 |
| Veto LLD |  |
| Alpha Counter | 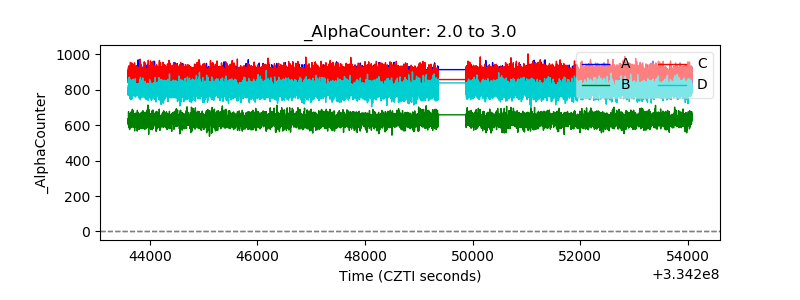 |
| _CPM_Rate | 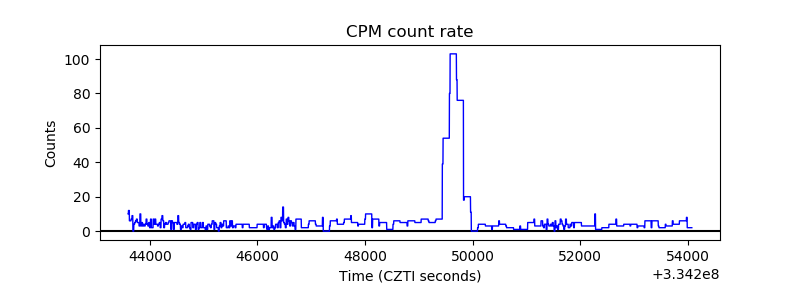 |
| CZT Counter | 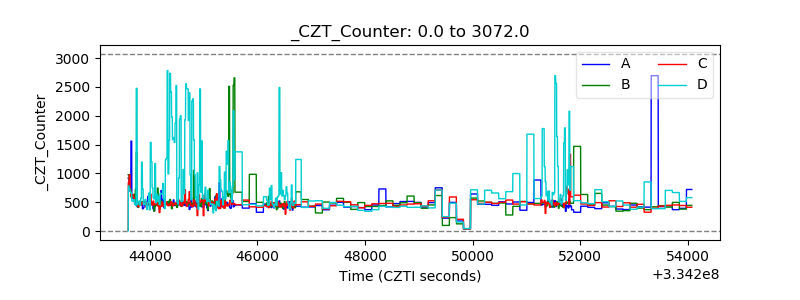 |
| +2.5 Volts monitor |  |
| +5 Volts monitor |  |
| _ROLL_ROT | 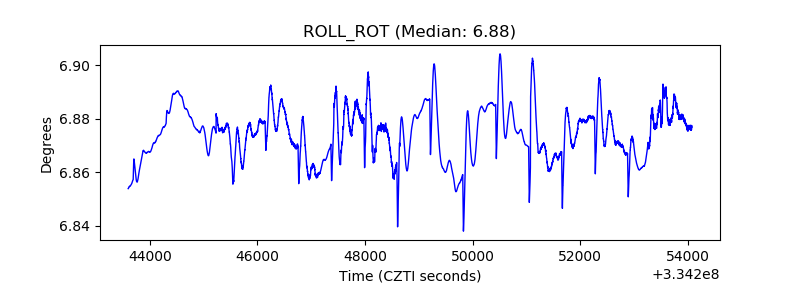 |
| _Roll_DEC | 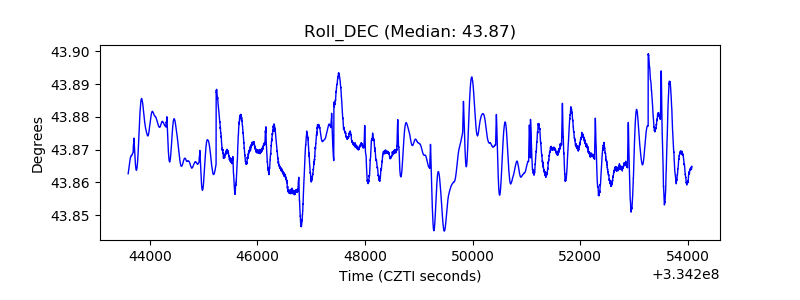 |
| _Roll_RA |  |
| Veto Counter | 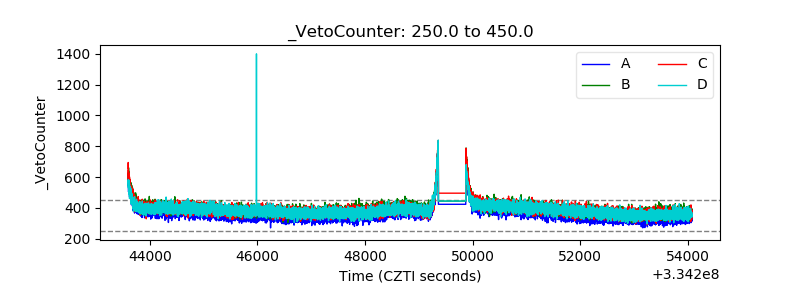 |