| Param | Original file | Final file |
|---|---|---|
| Filename | modeM0/AS1A09_079T03_9000003790_26237cztM0_level2.evt | modeM0/AS1A09_079T03_9000003790_26237cztM0_level2_quad_clean.evt |
| Size (bytes) | 679,466,880 | 113,279,040 |
| Size | 648.0 MB | 108.0 MB |
| Events in quadrant A | 4,366,592 | 709,649 |
| Events in quadrant B | 4,628,623 | 723,714 |
| Events in quadrant C | 4,522,596 | 707,019 |
| Events in quadrant D | 6,462,809 | 678,417 |
| Mode M0 | |||
|---|---|---|---|
| Quadrant | BADHDUFLAG | Total packets | Discarded packets |
| A | 0 | 18632 | 0 |
| B | 0 | 19442 | 0 |
| C | 0 | 19014 | 0 |
| D | 0 | 25076 | 0 |
| Mode M9 | |||
|---|---|---|---|
| Quadrant | BADHDUFLAG | Total packets | Discarded packets |
| A | 0 | 16 | 0 |
| B | 0 | 16 | 0 |
| C | 0 | 16 | 0 |
| D | 0 | 16 | 0 |
| Quadrant | Total seconds | Saturated seconds | Saturation percentage |
|---|---|---|---|
| A | 8813 | 97 | 1.100647% |
| B | 8813 | 228 | 2.587087% |
| C | 8813 | 239 | 2.711903% |
| D | 8813 | 636 | 7.216612% |
Noise dominated data is calculated using 1-second bins in cleaned event files. If a bin has >2000 counts, and if more than 50% of those come from <1% of pixels, then it is considered to be noise-dominated and hence unusable.
| Quadrant | # 1 sec bins | Bins with >0 counts | Bins with >2000 counts | High rate bins dominated by noise | Noise dominated (total time) | Noise dominated (detector-on time) | Marked lightcurve |
|---|---|---|---|---|---|---|---|
| A | 10373 | 8815 | 17 | 17 | 0.16% | 0.19% | 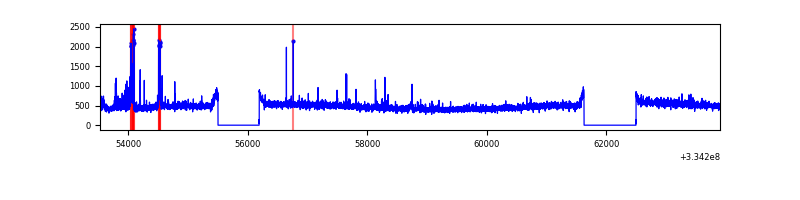 |
| B | 10373 | 8815 | 95 | 95 | 0.92% | 1.08% | 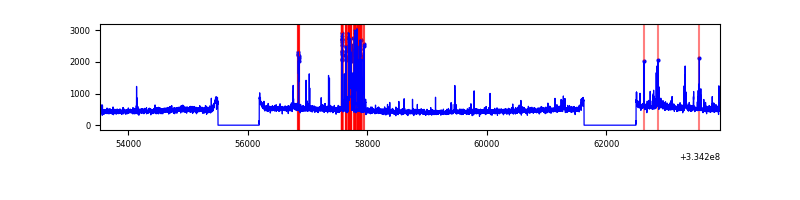 |
| C | 10373 | 8815 | 26 | 26 | 0.25% | 0.29% | 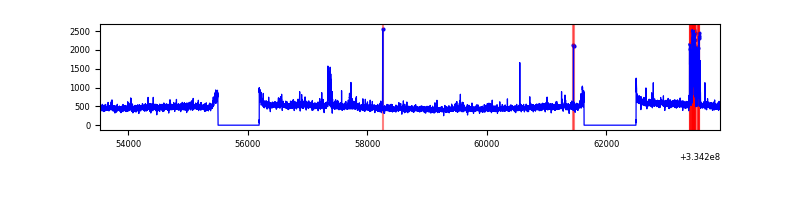 |
| D | 10373 | 8815 | 522 | 522 | 5.03% | 5.92% | 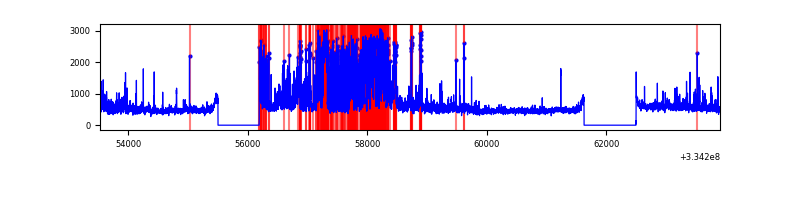 |
Top three noisy pixels from each quadrant. If the there are fewer than three noisy pixels in the level2.evt file, extra rows are filled as -1
| Pixel properties | Quadrant properties | ||||||
|---|---|---|---|---|---|---|---|
| Quadrant | DetID | PixID | Counts | Sigma | Mean | Median | Sigma |
| A | 0 | 13 | 167267 | 759.79 | 1086 | 1064 | 218.7 |
| A | 13 | 254 | 13398 | 56.38 | 1086 | 1064 | 218.7 |
| A | 3 | 137 | 10059 | 41.12 | 1086 | 1064 | 218.7 |
| B | 5 | 172 | 366804 | 1780.74 | 1075 | 1044 | 205.4 |
| B | 0 | 186 | 26502 | 123.94 | 1075 | 1044 | 205.4 |
| B | 12 | 111 | 24700 | 115.17 | 1075 | 1044 | 205.4 |
| C | 0 | 207 | 166534 | 677.22 | 1041 | 1047 | 244.4 |
| C | 14 | 238 | 164741 | 669.89 | 1041 | 1047 | 244.4 |
| C | 3 | 233 | 115458 | 468.2 | 1041 | 1047 | 244.4 |
| D | 1 | 52 | 2450722 | 9985.06 | 1025 | 996 | 245.3 |
| D | 12 | 233 | 68895 | 276.76 | 1025 | 996 | 245.3 |
| D | 2 | 234 | 38097 | 151.22 | 1025 | 996 | 245.3 |
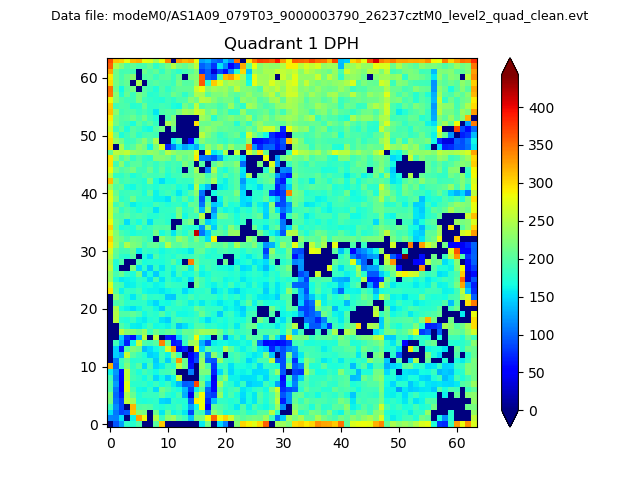
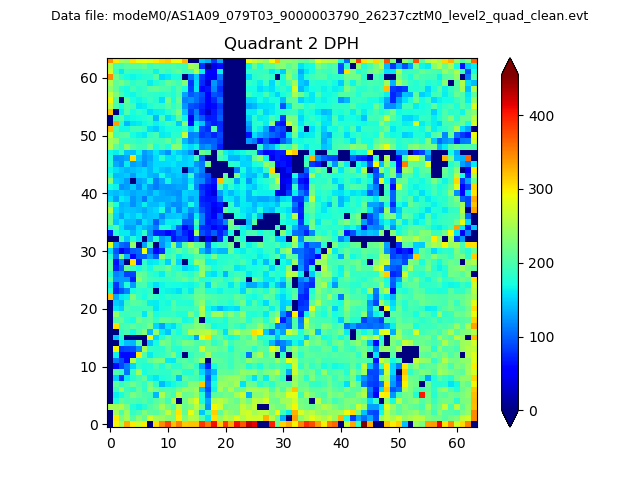
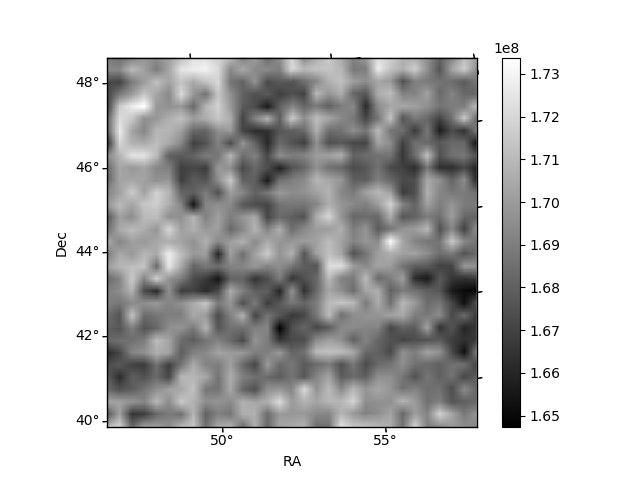
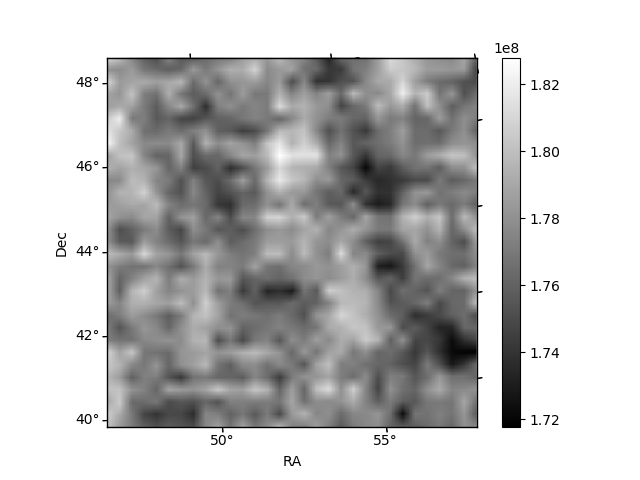
Histogram calculated using DETX and DETY for each event in the final _common_clean file
| Quadrant A |  |
 |
Quadrant B |
|---|---|---|---|
| Quadrant D | 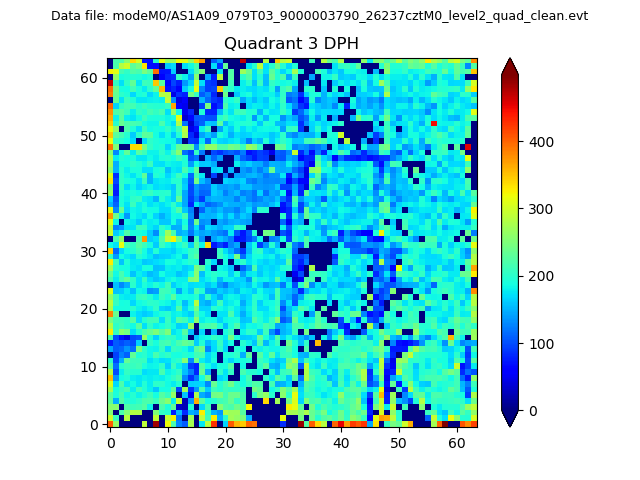 |
 |
Quadrant C |
| Plot type | Count rate plots | Images |
|---|---|---|
| Comparison with Poisson distribution Blue bars denote a histogram of data divided into 1 sec bins. Red curve is a Poisson curve with rate = median count rate of data. |
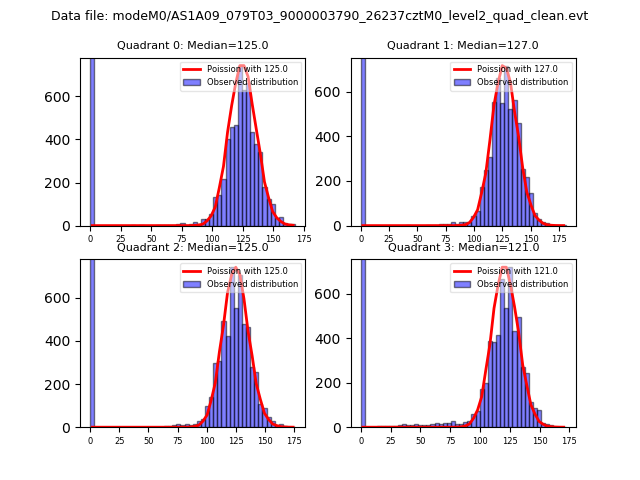 |
 |
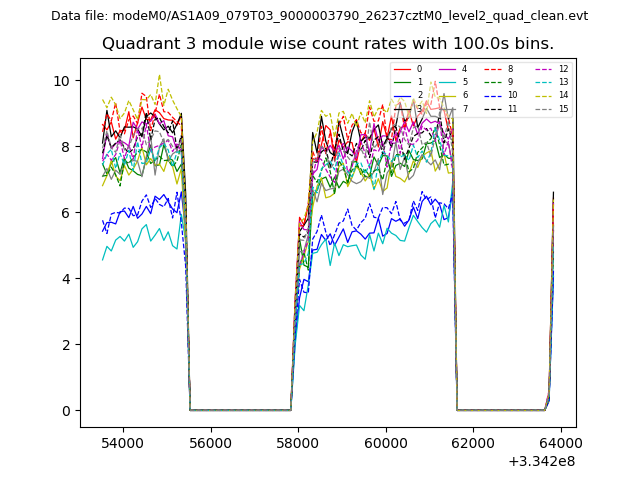
| Quadrant-wise count rates Data is divided into 100 sec bins |
 |
|
| Module-wise count rates for Quadrant A Data is divided into 100 sec bins |
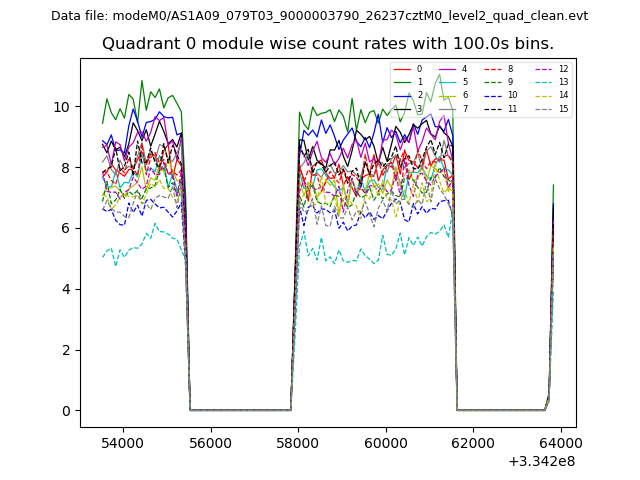 |
 |
| Module-wise count rates for Quadrant B Data is divided into 100 sec bins |
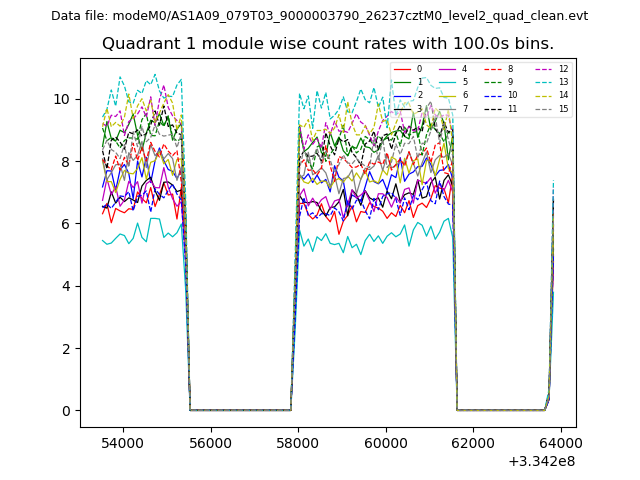 |
 |
| Module-wise count rates for Quadrant C Data is divided into 100 sec bins |
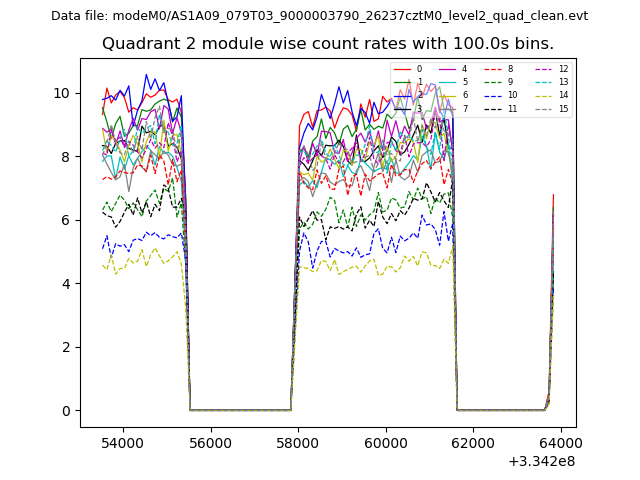 |
 |
| Module-wise count rates for Quadrant D Data is divided into 100 sec bins |
 |
 |
| Parameter | Plot |
|---|---|
| CZT HV Monitor | 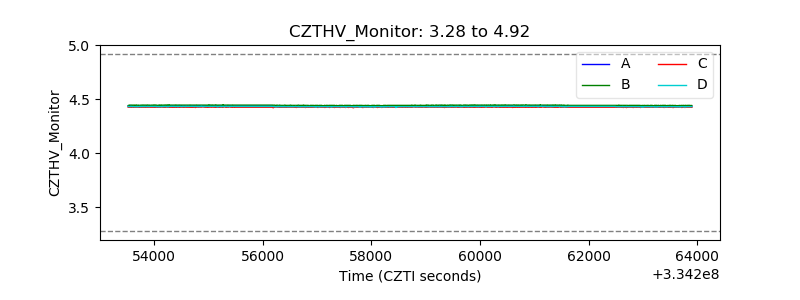 |
| D_VDD | 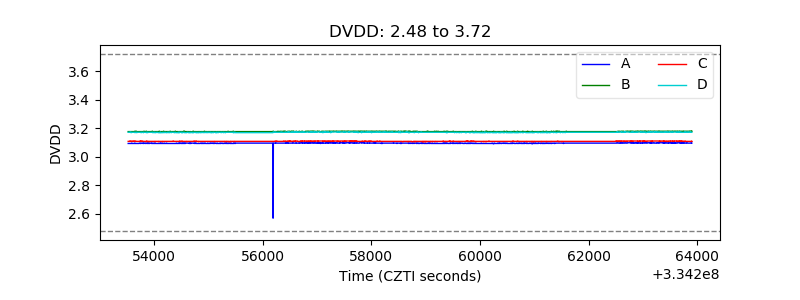 |
| Temperature 1 | 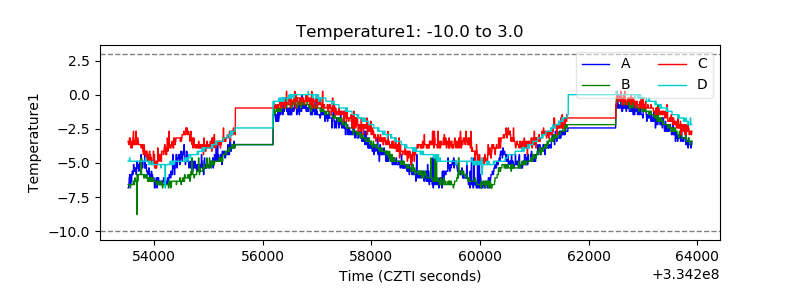 |
| Veto HV Monitor | 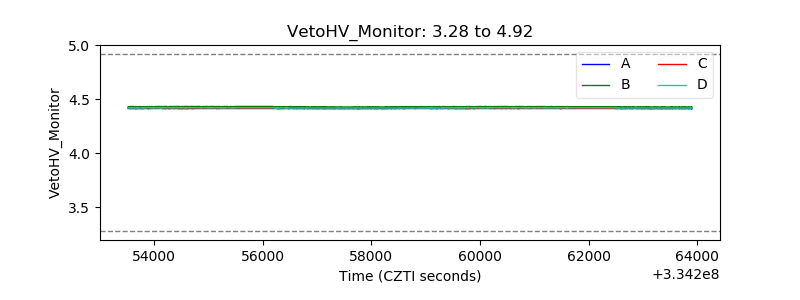 |
| Veto LLD | 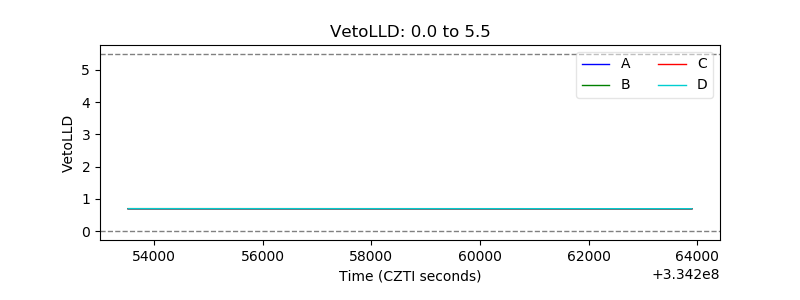 |
| Alpha Counter | 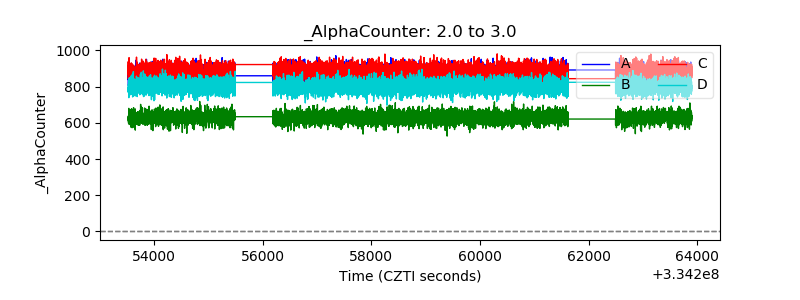 |
| _CPM_Rate | 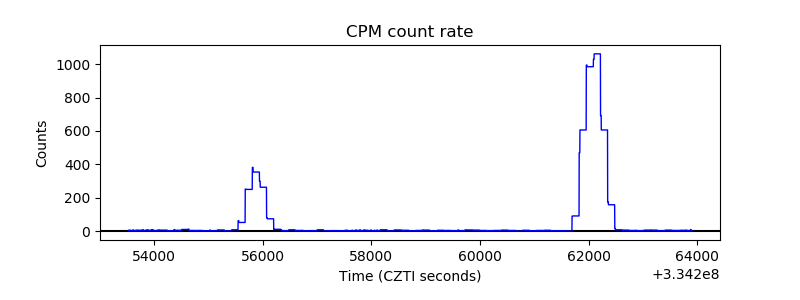 |
| CZT Counter | 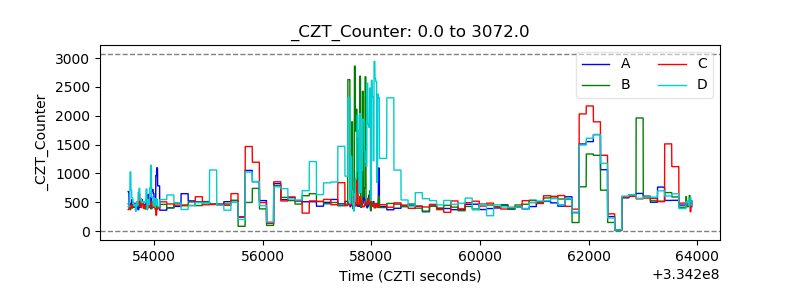 |
| +2.5 Volts monitor |  |
| +5 Volts monitor |  |
| _ROLL_ROT | 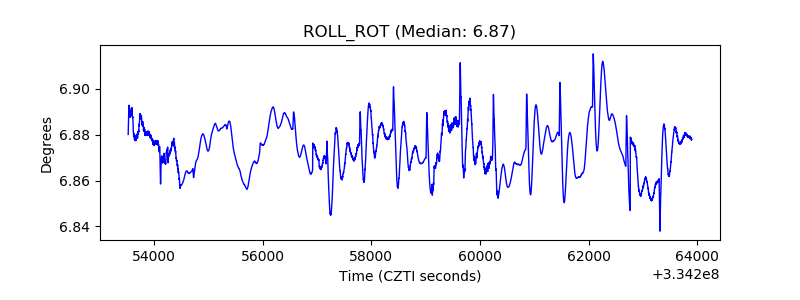 |
| _Roll_DEC | 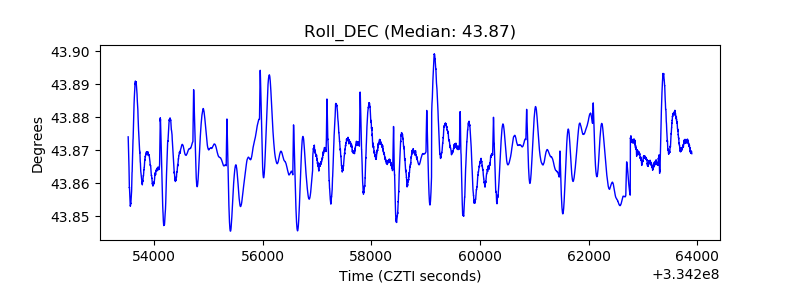 |
| _Roll_RA |  |
| Veto Counter | 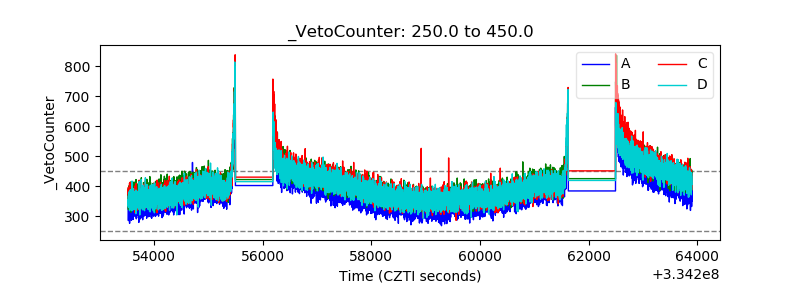 |