| Param | Original file | Final file |
|---|---|---|
| Filename | modeM0/AS1A09_079T03_9000003790_26238cztM0_level2.evt | modeM0/AS1A09_079T03_9000003790_26238cztM0_level2_quad_clean.evt |
| Size (bytes) | 434,010,240 | 86,184,000 |
| Size | 413.9 MB | 82.2 MB |
| Events in quadrant A | 3,116,554 | 542,779 |
| Events in quadrant B | 3,117,091 | 555,522 |
| Events in quadrant C | 3,296,545 | 544,110 |
| Events in quadrant D | 3,189,925 | 532,229 |
| Mode M0 | |||
|---|---|---|---|
| Quadrant | BADHDUFLAG | Total packets | Discarded packets |
| A | 0 | 13336 | 0 |
| B | 0 | 13374 | 0 |
| C | 0 | 13897 | 0 |
| D | 0 | 13836 | 0 |
| Mode M9 | |||
|---|---|---|---|
| Quadrant | BADHDUFLAG | Total packets | Discarded packets |
| A | 0 | 11 | 0 |
| B | 0 | 11 | 0 |
| C | 0 | 11 | 0 |
| D | 0 | 11 | 0 |
| Quadrant | Total seconds | Saturated seconds | Saturation percentage |
|---|---|---|---|
| A | 6237 | 44 | 0.705467% |
| B | 6238 | 45 | 0.721385% |
| C | 6238 | 158 | 2.532863% |
| D | 6238 | 48 | 0.769477% |
Noise dominated data is calculated using 1-second bins in cleaned event files. If a bin has >2000 counts, and if more than 50% of those come from <1% of pixels, then it is considered to be noise-dominated and hence unusable.
| Quadrant | # 1 sec bins | Bins with >0 counts | Bins with >2000 counts | High rate bins dominated by noise | Noise dominated (total time) | Noise dominated (detector-on time) | Marked lightcurve |
|---|---|---|---|---|---|---|---|
| A | 7267 | 6238 | 10 | 10 | 0.14% | 0.16% | 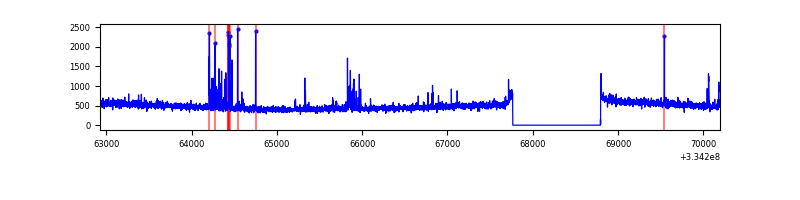 |
| B | 7268 | 6239 | 2 | 2 | 0.03% | 0.03% | 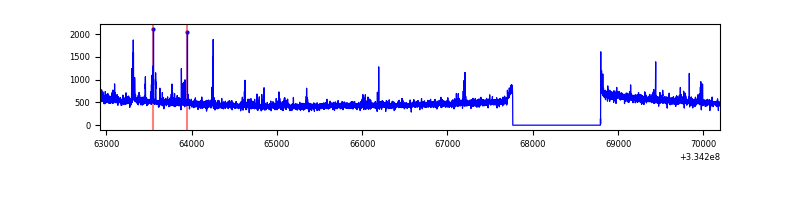 |
| C | 7268 | 6239 | 28 | 28 | 0.39% | 0.45% | 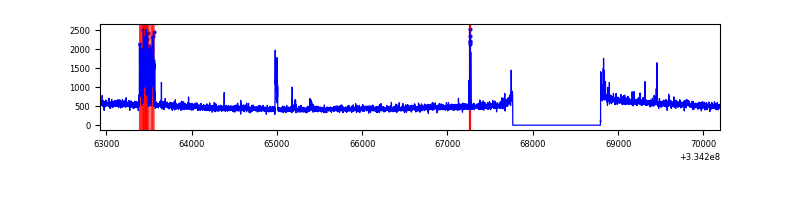 |
| D | 7268 | 6239 | 18 | 18 | 0.25% | 0.29% | 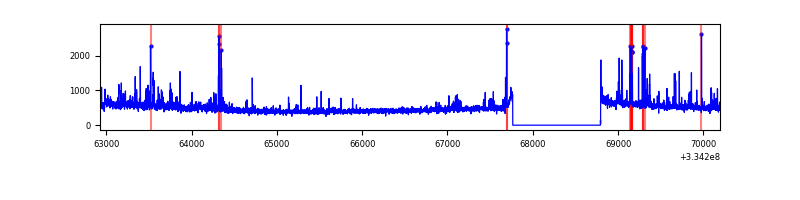 |
Top three noisy pixels from each quadrant. If the there are fewer than three noisy pixels in the level2.evt file, extra rows are filled as -1
| Pixel properties | Quadrant properties | ||||||
|---|---|---|---|---|---|---|---|
| Quadrant | DetID | PixID | Counts | Sigma | Mean | Median | Sigma |
| A | 0 | 13 | 133112 | 856.68 | 771 | 755 | 154.5 |
| A | 13 | 254 | 10297 | 61.76 | 771 | 755 | 154.5 |
| A | 3 | 137 | 7155 | 41.42 | 771 | 755 | 154.5 |
| B | 5 | 172 | 51876 | 348.58 | 773 | 754 | 146.7 |
| B | 12 | 111 | 17356 | 113.2 | 773 | 754 | 146.7 |
| B | 11 | 111 | 14945 | 96.76 | 773 | 754 | 146.7 |
| C | 0 | 207 | 159685 | 900.34 | 748 | 752 | 176.5 |
| C | 14 | 238 | 118042 | 664.43 | 748 | 752 | 176.5 |
| C | 3 | 233 | 93406 | 524.87 | 748 | 752 | 176.5 |
| D | 1 | 52 | 213923 | 1173.84 | 755 | 737 | 181.6 |
| D | 12 | 233 | 80377 | 438.51 | 755 | 737 | 181.6 |
| D | 2 | 234 | 28644 | 153.66 | 755 | 737 | 181.6 |
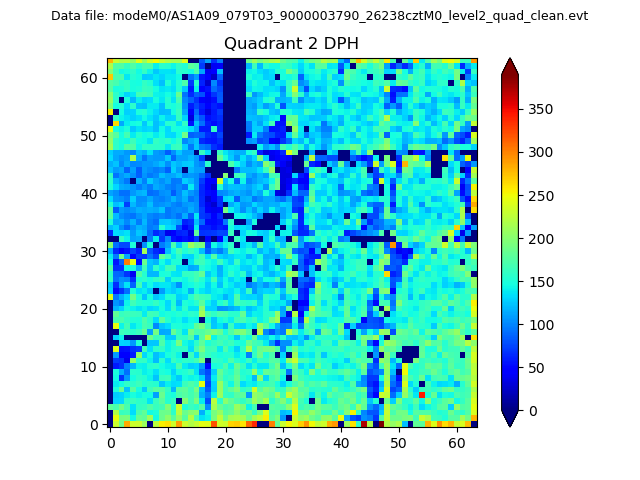
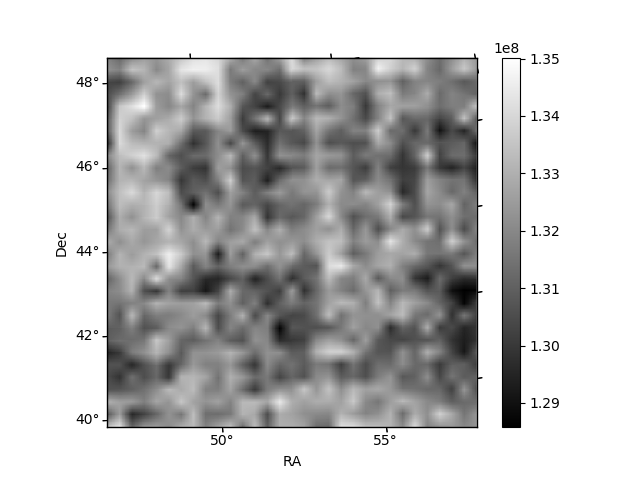
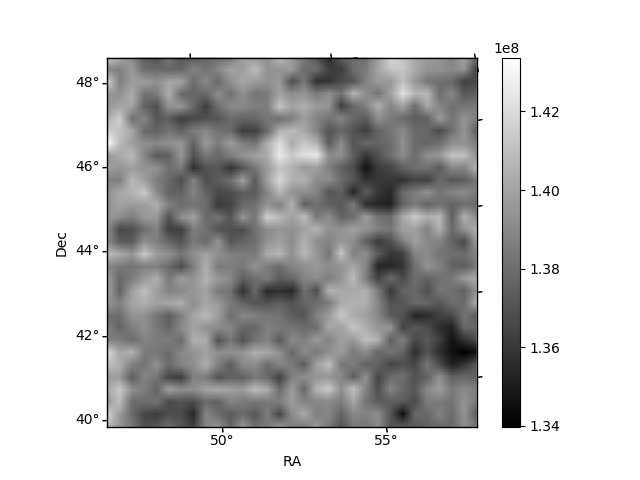
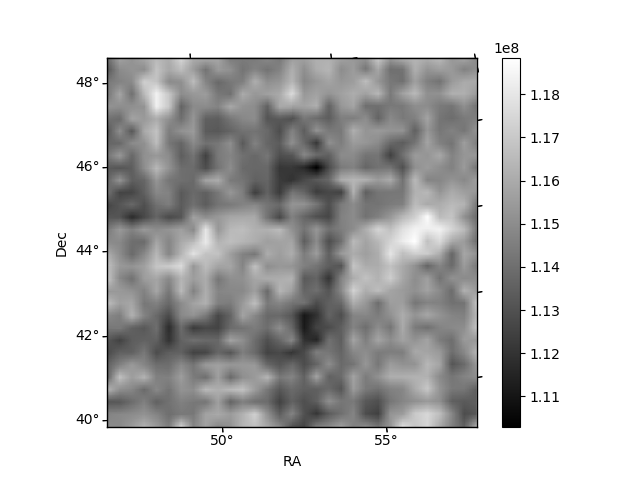
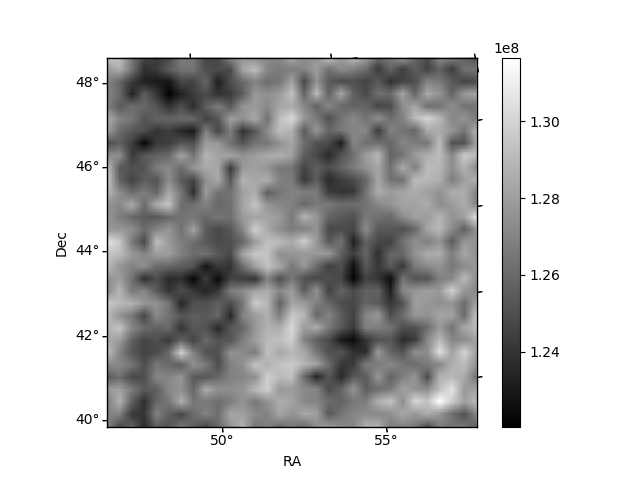
Histogram calculated using DETX and DETY for each event in the final _common_clean file
| Quadrant A | 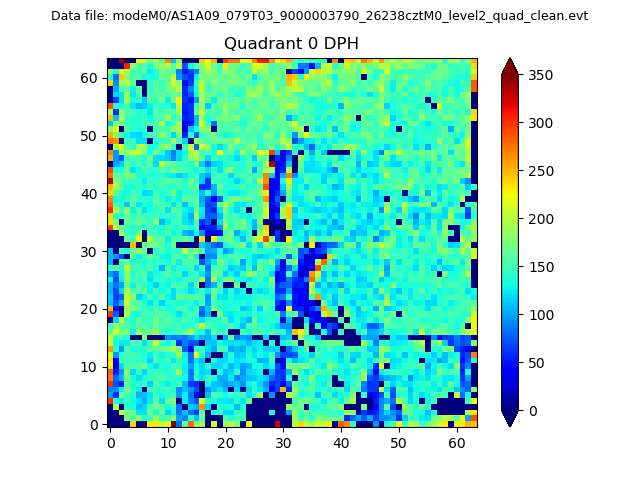 |
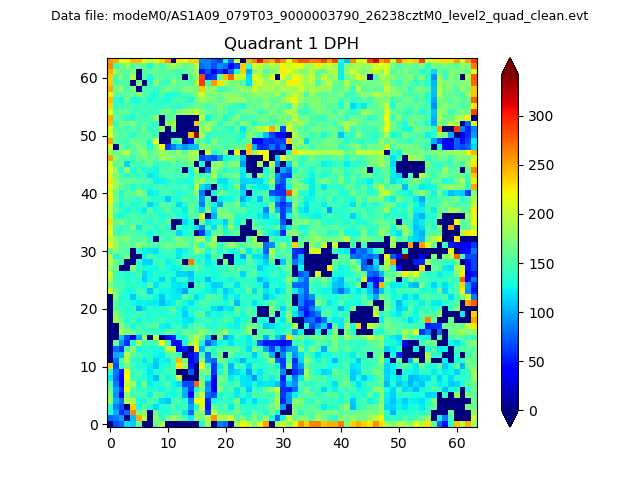 |
Quadrant B |
|---|---|---|---|
| Quadrant D | 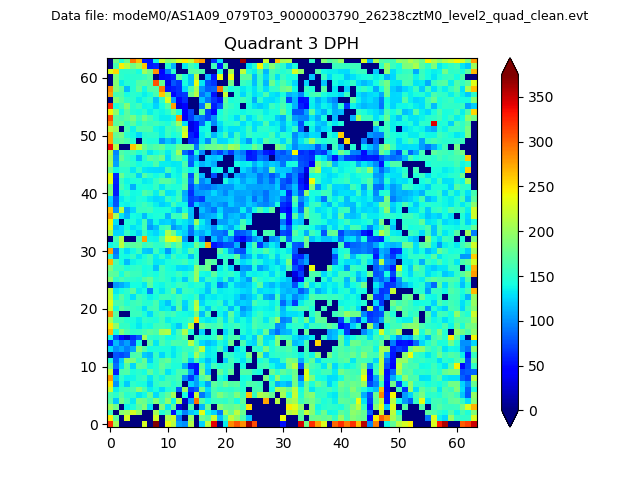 |
 |
Quadrant C |
| Plot type | Count rate plots | Images |
|---|---|---|
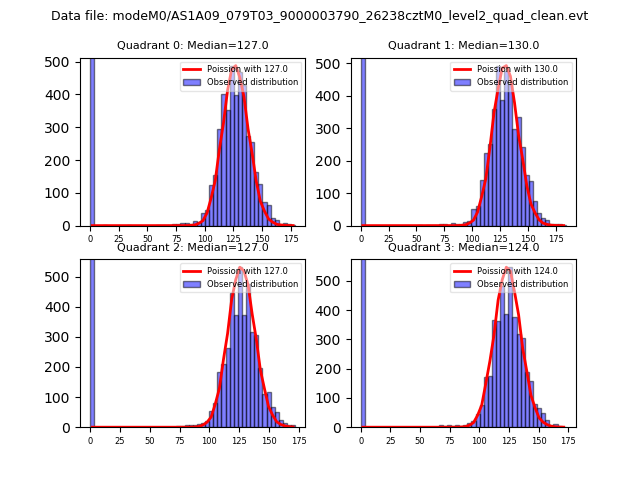
| Comparison with Poisson distribution Blue bars denote a histogram of data divided into 1 sec bins. Red curve is a Poisson curve with rate = median count rate of data. |
 |
 |
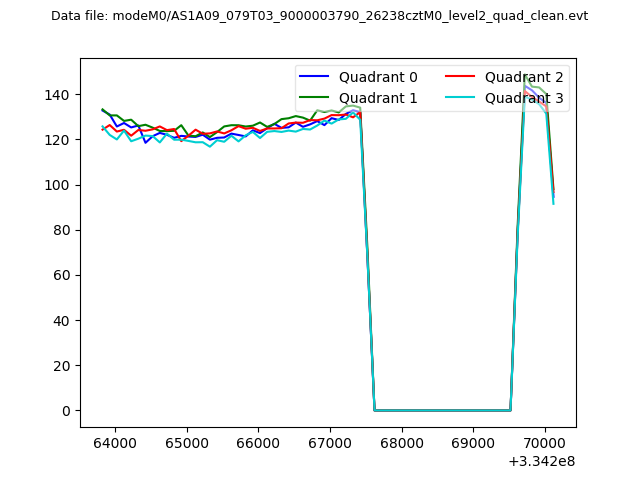
| Quadrant-wise count rates Data is divided into 100 sec bins |
 |
|
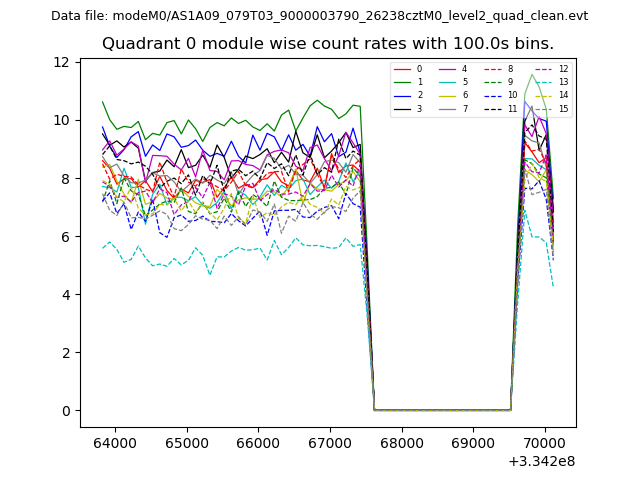
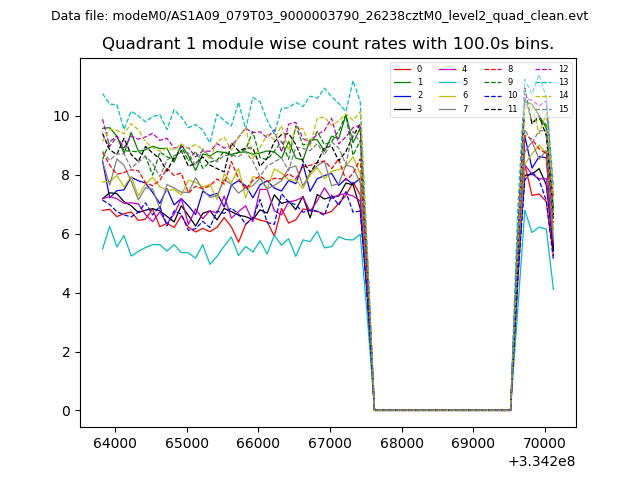
| Module-wise count rates for Quadrant A Data is divided into 100 sec bins |
 |
 |
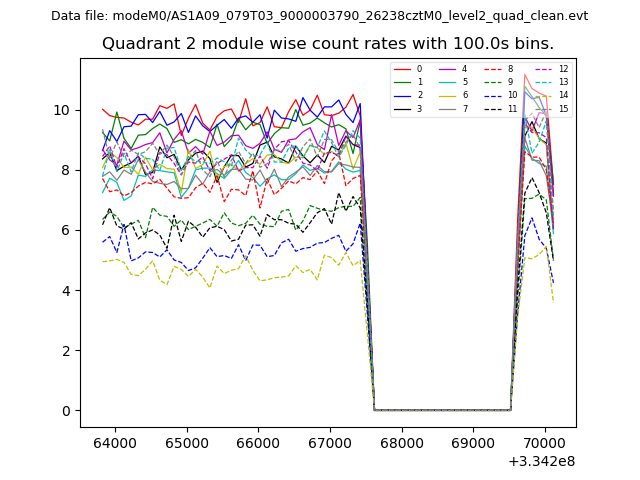
| Module-wise count rates for Quadrant B Data is divided into 100 sec bins |
 |
 |
| Module-wise count rates for Quadrant C Data is divided into 100 sec bins |
 |
 |
| Module-wise count rates for Quadrant D Data is divided into 100 sec bins |
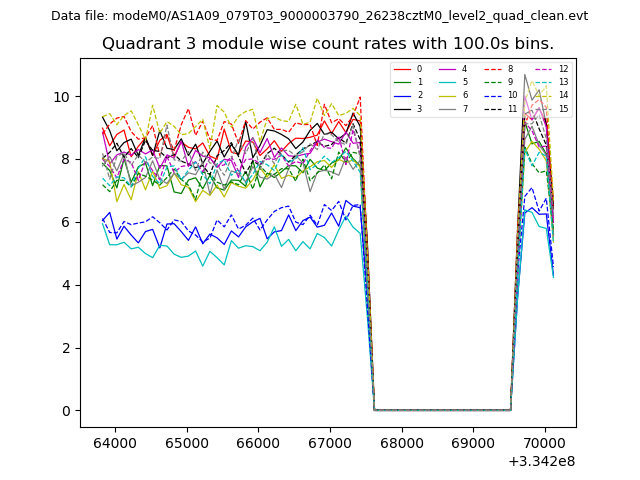 |
 |
| Parameter | Plot |
|---|---|
| CZT HV Monitor | 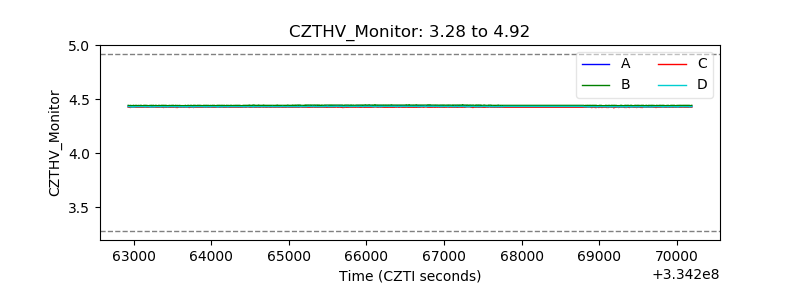 |
| D_VDD | 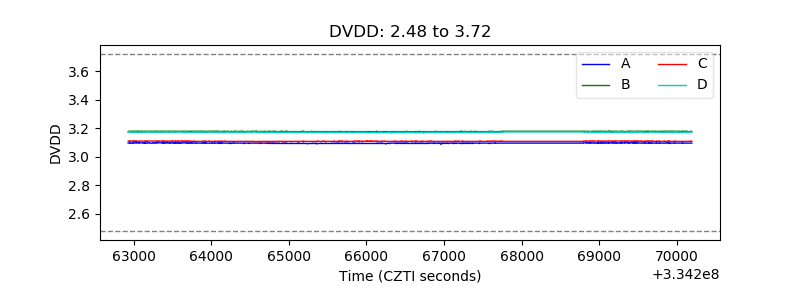 |
| Temperature 1 | 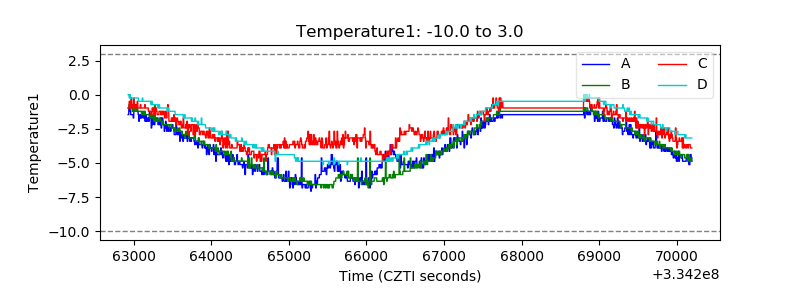 |
| Veto HV Monitor | 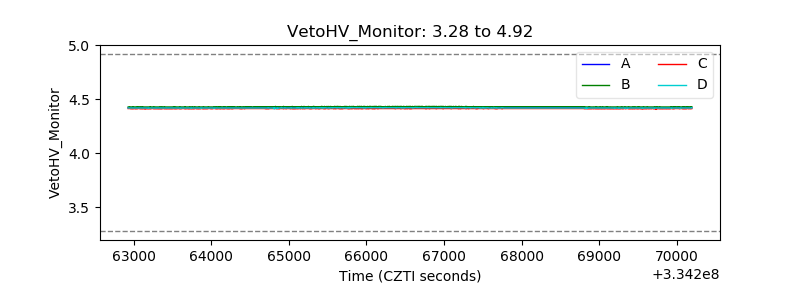 |
| Veto LLD | 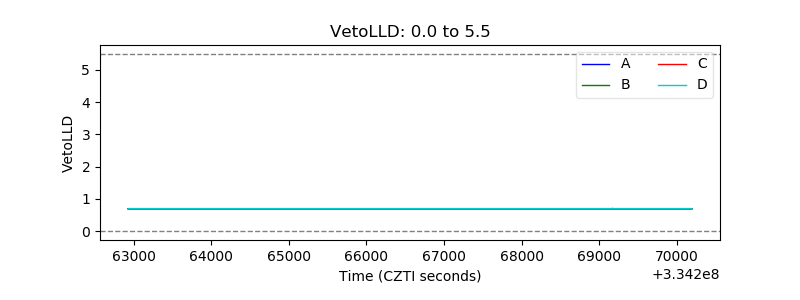 |
| Alpha Counter | 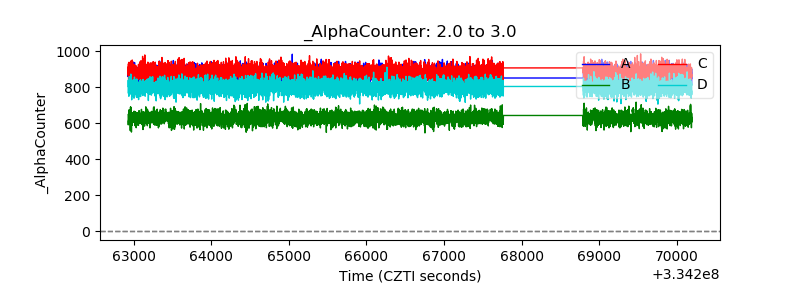 |
| _CPM_Rate | 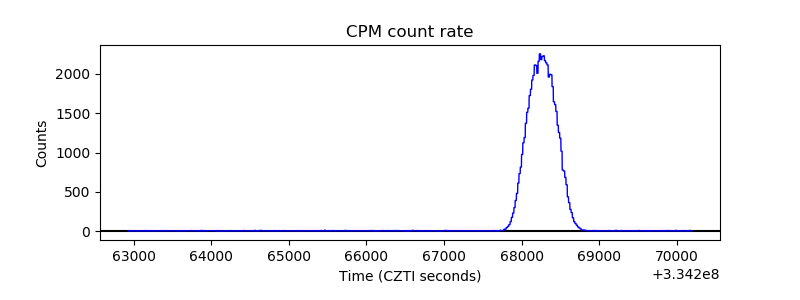 |
| CZT Counter | 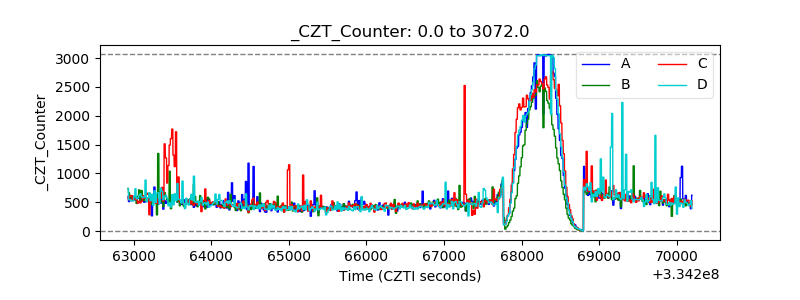 |
| +2.5 Volts monitor |  |
| +5 Volts monitor | 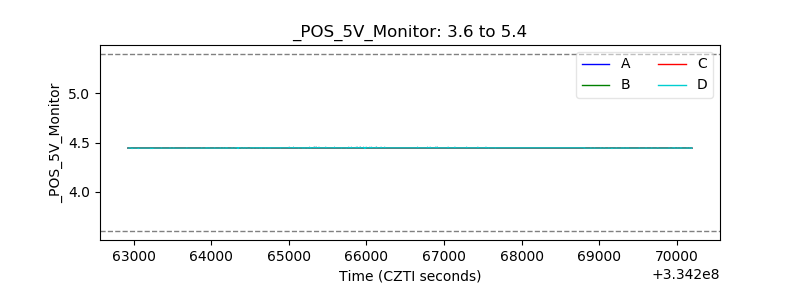 |
| _ROLL_ROT | 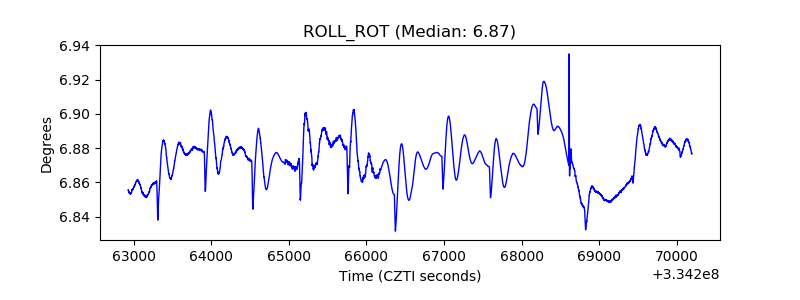 |
| _Roll_DEC | 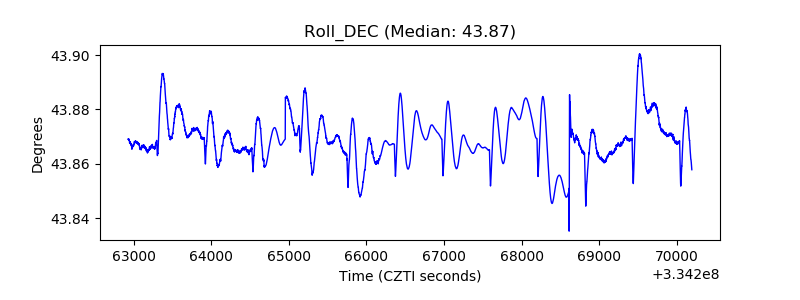 |
| _Roll_RA | 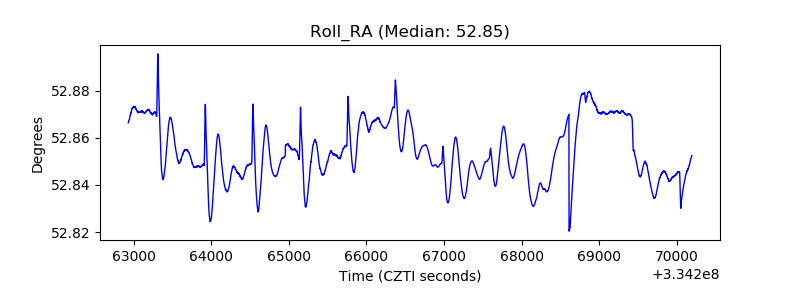 |
| Veto Counter | 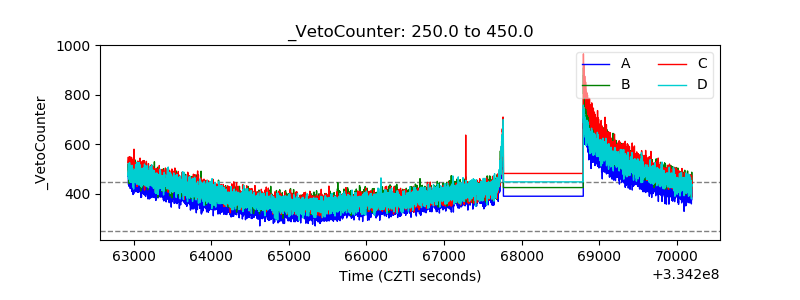 |