| Param | Original file | Final file |
|---|---|---|
| Filename | modeM0/AS1A09_079T03_9000003790_26240cztM0_level2.evt | modeM0/AS1A09_079T03_9000003790_26240cztM0_level2_quad_clean.evt |
| Size (bytes) | 455,477,760 | 97,444,800 |
| Size | 434.4 MB | 92.9 MB |
| Events in quadrant A | 3,216,257 | 624,075 |
| Events in quadrant B | 3,238,083 | 643,009 |
| Events in quadrant C | 3,357,617 | 629,238 |
| Events in quadrant D | 3,549,424 | 610,227 |
| Mode M0 | |||
|---|---|---|---|
| Quadrant | BADHDUFLAG | Total packets | Discarded packets |
| A | 0 | 13769 | 0 |
| B | 0 | 13908 | 0 |
| C | 0 | 14241 | 0 |
| D | 0 | 14880 | 0 |
| Mode M9 | |||
|---|---|---|---|
| Quadrant | BADHDUFLAG | Total packets | Discarded packets |
| A | 0 | 12 | 0 |
| B | 0 | 12 | 0 |
| C | 0 | 12 | 0 |
| D | 0 | 12 | 0 |
| Quadrant | Total seconds | Saturated seconds | Saturation percentage |
|---|---|---|---|
| A | 6369 | 41 | 0.643743% |
| B | 6369 | 46 | 0.722248% |
| C | 6369 | 91 | 1.428796% |
| D | 6369 | 100 | 1.570105% |
Noise dominated data is calculated using 1-second bins in cleaned event files. If a bin has >2000 counts, and if more than 50% of those come from <1% of pixels, then it is considered to be noise-dominated and hence unusable.
| Quadrant | # 1 sec bins | Bins with >0 counts | Bins with >2000 counts | High rate bins dominated by noise | Noise dominated (total time) | Noise dominated (detector-on time) | Marked lightcurve |
|---|---|---|---|---|---|---|---|
| A | 7544 | 6370 | 1 | 1 | 0.01% | 0.02% | 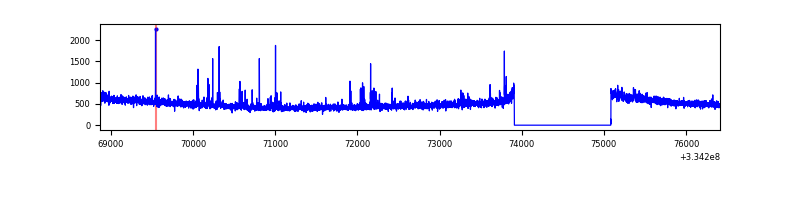 |
| B | 7544 | 6370 | 1 | 1 | 0.01% | 0.02% | 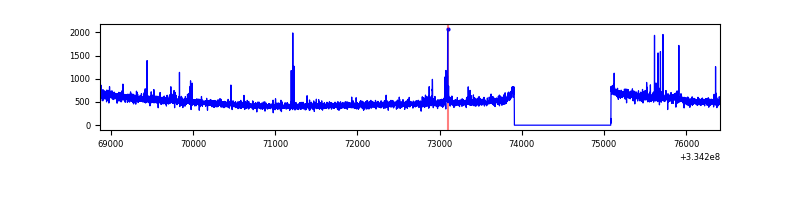 |
| C | 7544 | 6370 | 6 | 6 | 0.08% | 0.09% | 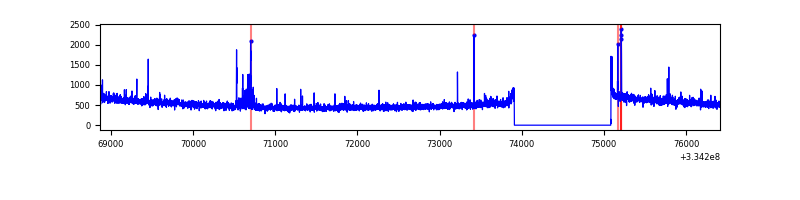 |
| D | 7544 | 6370 | 54 | 54 | 0.72% | 0.85% | 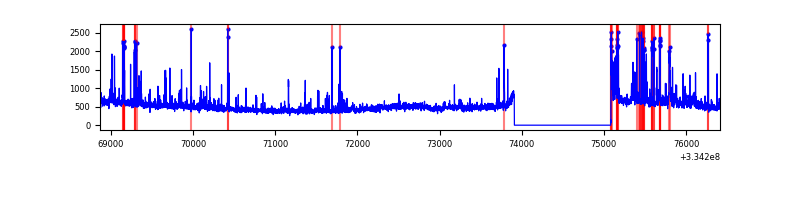 |
Top three noisy pixels from each quadrant. If the there are fewer than three noisy pixels in the level2.evt file, extra rows are filled as -1
| Pixel properties | Quadrant properties | ||||||
|---|---|---|---|---|---|---|---|
| Quadrant | DetID | PixID | Counts | Sigma | Mean | Median | Sigma |
| A | 0 | 13 | 86622 | 533.2 | 808 | 793 | 161.0 |
| A | 13 | 254 | 11044 | 63.68 | 808 | 793 | 161.0 |
| A | 3 | 137 | 7134 | 39.39 | 808 | 793 | 161.0 |
| B | 0 | 230 | 28071 | 177.41 | 814 | 795 | 153.7 |
| B | 5 | 172 | 23943 | 150.56 | 814 | 795 | 153.7 |
| B | 12 | 111 | 17790 | 110.54 | 814 | 795 | 153.7 |
| C | 14 | 238 | 125582 | 676.32 | 792 | 797 | 184.5 |
| C | 2 | 16 | 83328 | 447.31 | 792 | 797 | 184.5 |
| C | 3 | 233 | 48665 | 259.44 | 792 | 797 | 184.5 |
| D | 1 | 52 | 368921 | 1949.24 | 792 | 777 | 188.9 |
| D | 12 | 233 | 80819 | 423.8 | 792 | 777 | 188.9 |
| D | 2 | 234 | 28692 | 147.8 | 792 | 777 | 188.9 |
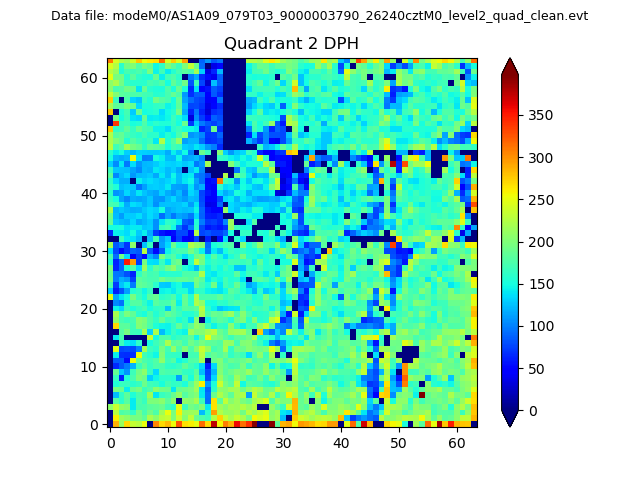
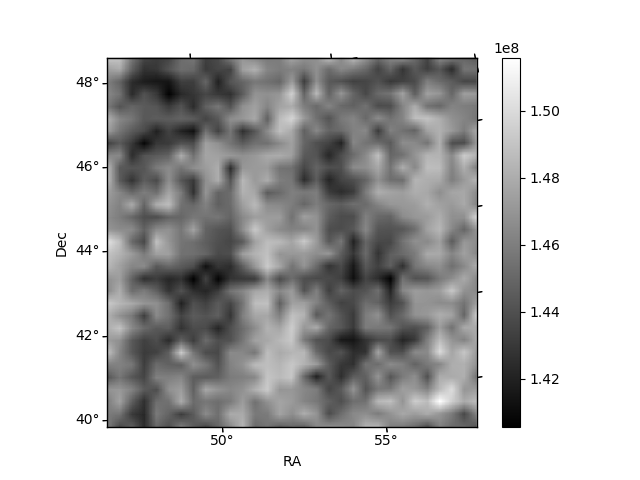
Histogram calculated using DETX and DETY for each event in the final _common_clean file
| Quadrant A | 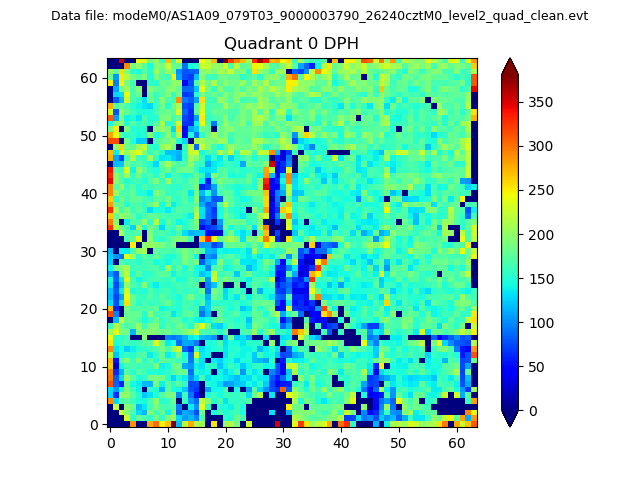 |
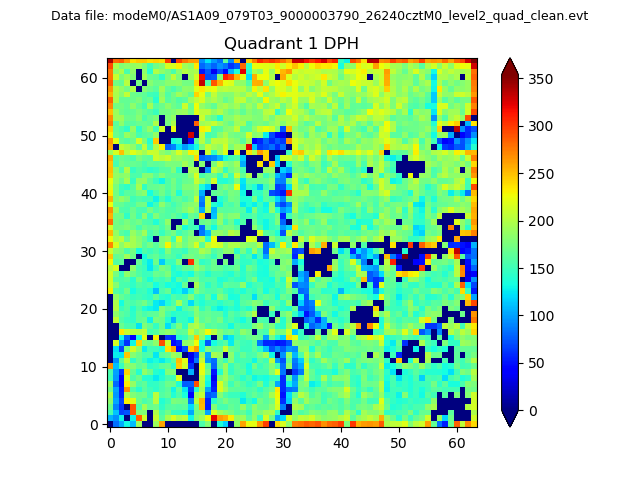 |
Quadrant B |
|---|---|---|---|
| Quadrant D | 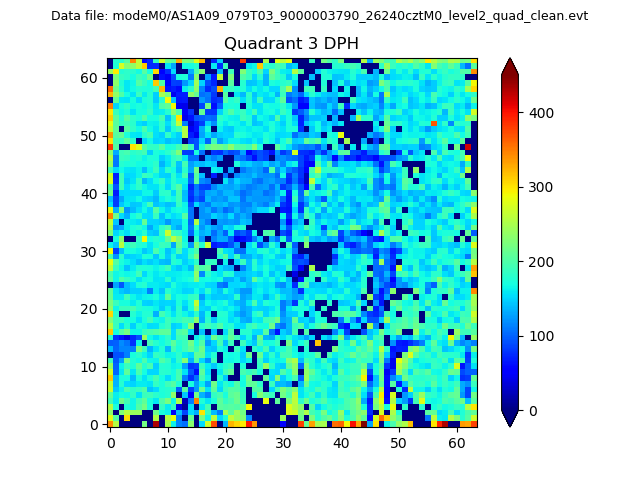 |
 |
Quadrant C |
| Plot type | Count rate plots | Images |
|---|---|---|
| Comparison with Poisson distribution Blue bars denote a histogram of data divided into 1 sec bins. Red curve is a Poisson curve with rate = median count rate of data. |
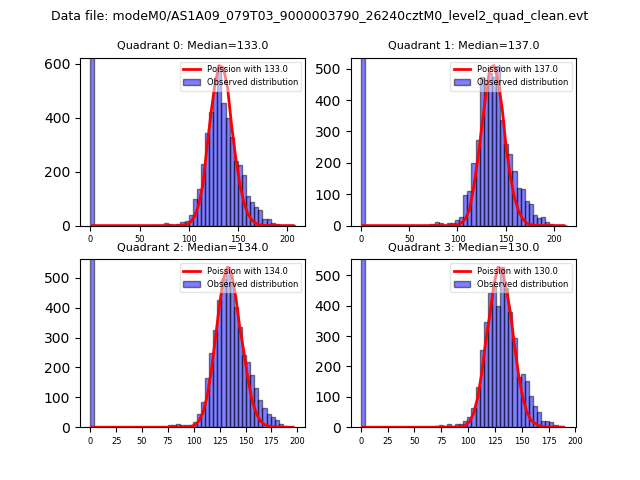 |
 |
| Quadrant-wise count rates Data is divided into 100 sec bins |
 |
|
| Module-wise count rates for Quadrant A Data is divided into 100 sec bins |
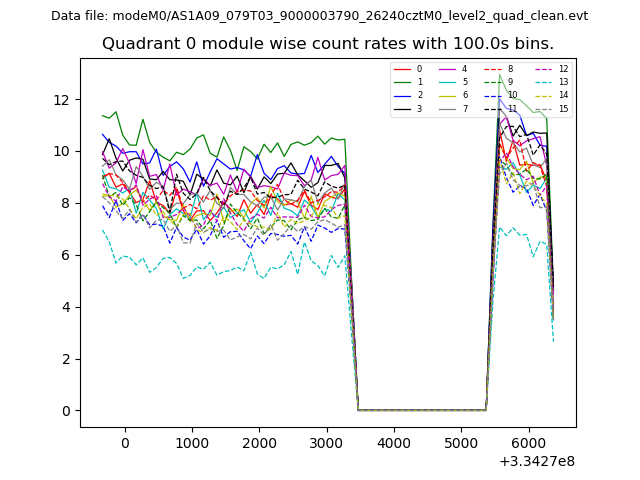 |
 |
| Module-wise count rates for Quadrant B Data is divided into 100 sec bins |
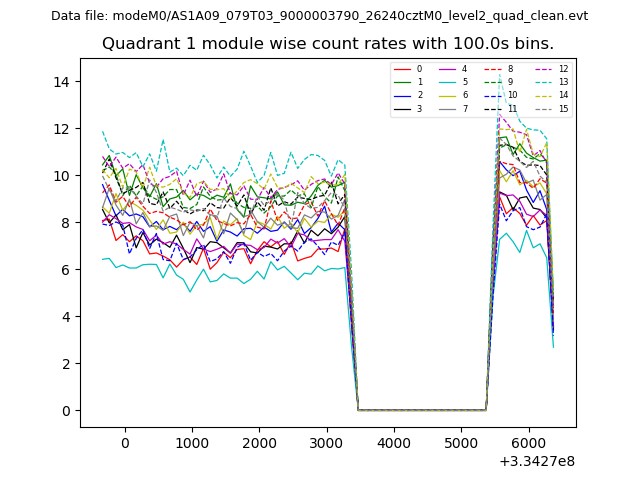 |
 |
| Module-wise count rates for Quadrant C Data is divided into 100 sec bins |
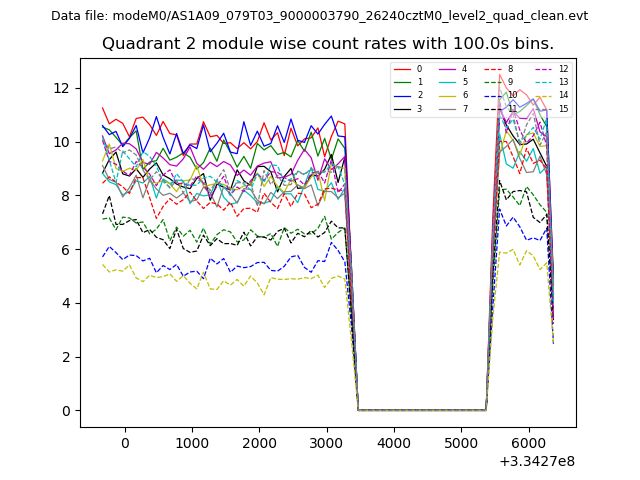 |
 |
| Module-wise count rates for Quadrant D Data is divided into 100 sec bins |
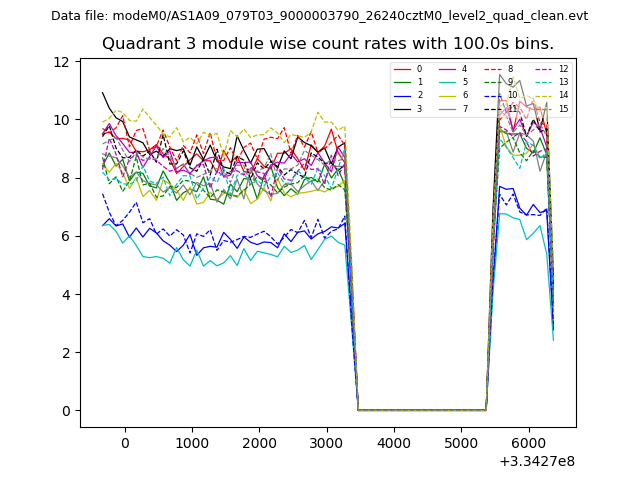 |
 |
| Parameter | Plot |
|---|---|
| CZT HV Monitor | 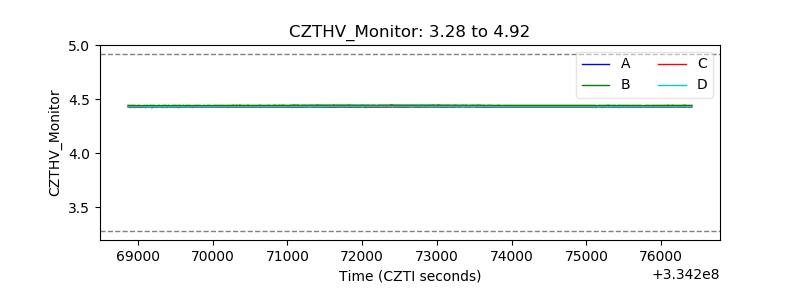 |
| D_VDD | 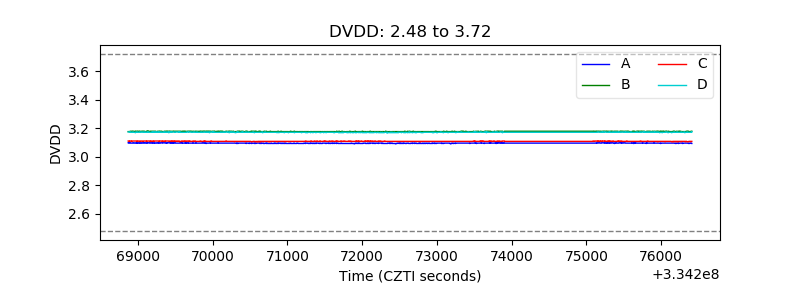 |
| Temperature 1 |  |
| Veto HV Monitor | 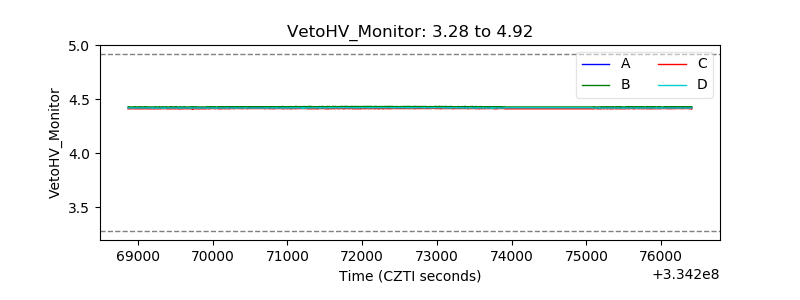 |
| Veto LLD | 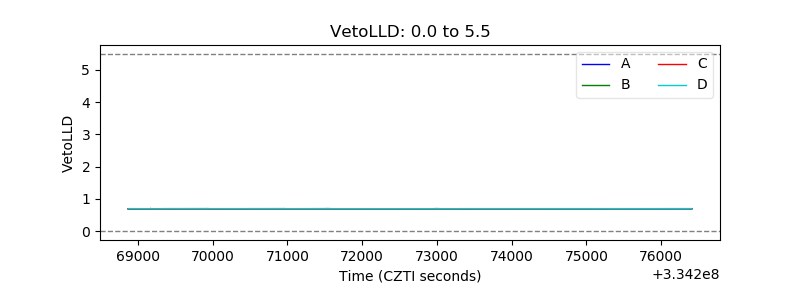 |
| Alpha Counter | 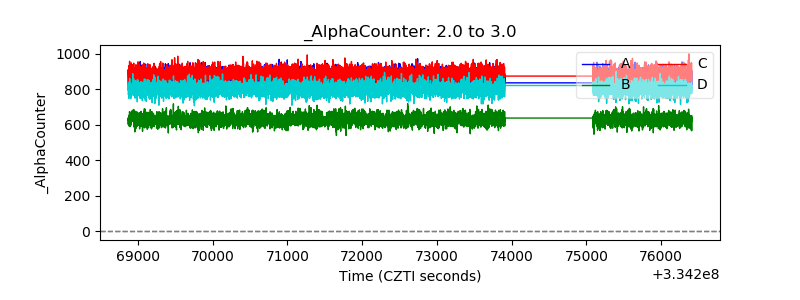 |
| _CPM_Rate | 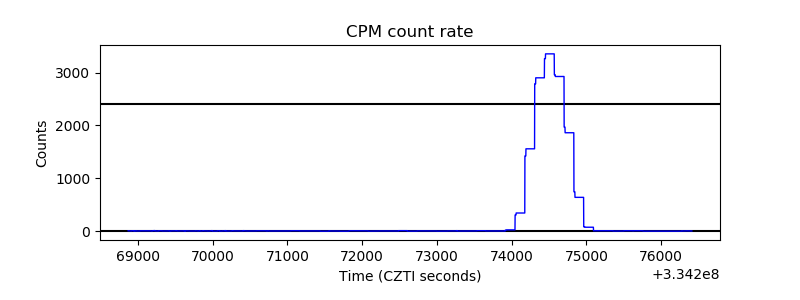 |
| CZT Counter | 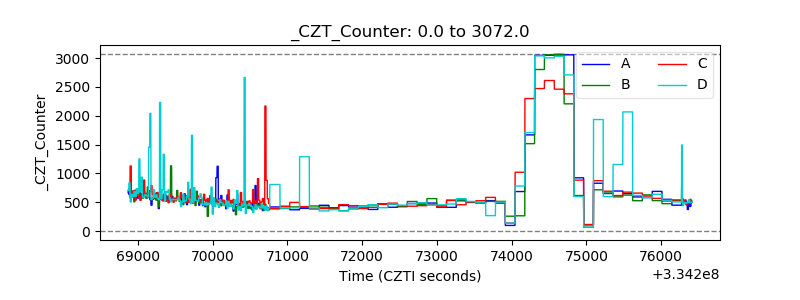 |
| +2.5 Volts monitor |  |
| +5 Volts monitor |  |
| _ROLL_ROT | 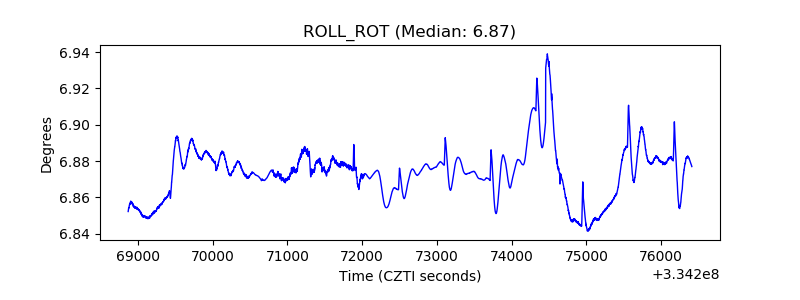 |
| _Roll_DEC | 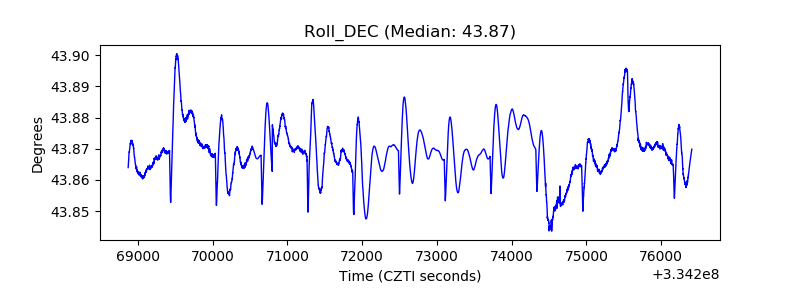 |
| _Roll_RA |  |
| Veto Counter | 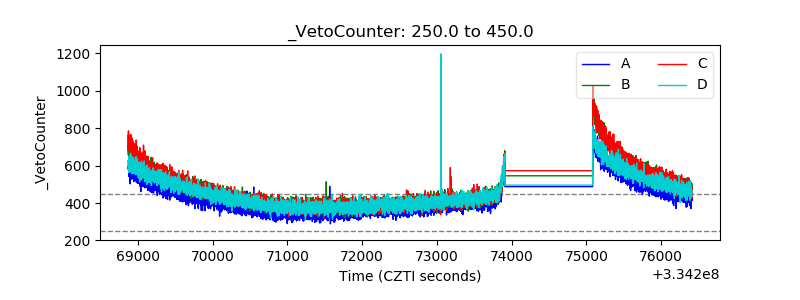 |