| Param | Original file | Final file |
|---|---|---|
| Filename | modeM0/AS1A09_079T03_9000003790_26241cztM0_level2.evt | modeM0/AS1A09_079T03_9000003790_26241cztM0_level2_quad_clean.evt |
| Size (bytes) | 481,818,240 | 111,726,720 |
| Size | 459.5 MB | 106.6 MB |
| Events in quadrant A | 3,331,749 | 732,414 |
| Events in quadrant B | 3,436,826 | 762,581 |
| Events in quadrant C | 3,551,802 | 741,577 |
| Events in quadrant D | 3,841,772 | 705,666 |
| Mode M0 | |||
|---|---|---|---|
| Quadrant | BADHDUFLAG | Total packets | Discarded packets |
| A | 0 | 14064 | 0 |
| B | 0 | 14354 | 0 |
| C | 0 | 14753 | 0 |
| D | 0 | 15802 | 0 |
| Mode M9 | |||
|---|---|---|---|
| Quadrant | BADHDUFLAG | Total packets | Discarded packets |
| A | 0 | 17 | 0 |
| B | 0 | 18 | 0 |
| C | 0 | 18 | 0 |
| D | 0 | 18 | 0 |
| Quadrant | Total seconds | Saturated seconds | Saturation percentage |
|---|---|---|---|
| A | 6339 | 47 | 0.741442% |
| B | 6339 | 105 | 1.656413% |
| C | 6339 | 141 | 2.224326% |
| D | 6339 | 174 | 2.744912% |
Noise dominated data is calculated using 1-second bins in cleaned event files. If a bin has >2000 counts, and if more than 50% of those come from <1% of pixels, then it is considered to be noise-dominated and hence unusable.
| Quadrant | # 1 sec bins | Bins with >0 counts | Bins with >2000 counts | High rate bins dominated by noise | Noise dominated (total time) | Noise dominated (detector-on time) | Marked lightcurve |
|---|---|---|---|---|---|---|---|
| A | 7589 | 6340 | 25 | 25 | 0.33% | 0.39% | 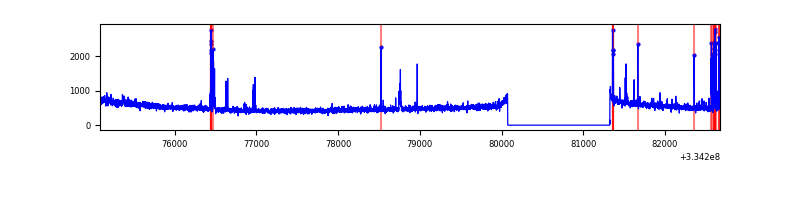 |
| B | 7589 | 6340 | 19 | 19 | 0.25% | 0.30% | 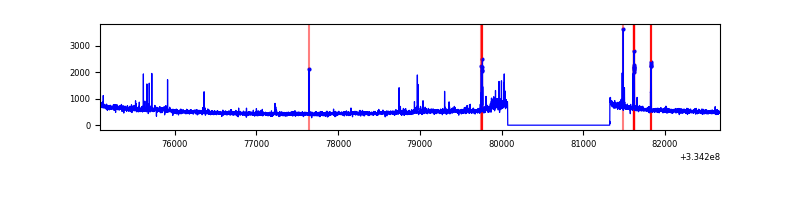 |
| C | 7589 | 6340 | 17 | 17 | 0.22% | 0.27% | 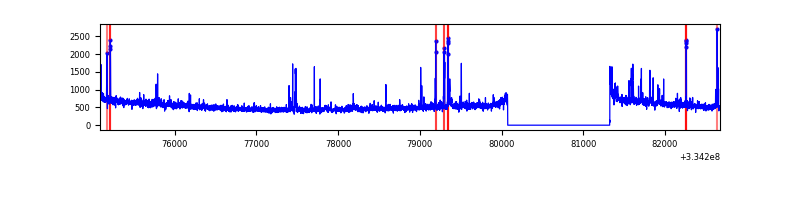 |
| D | 7589 | 6340 | 97 | 97 | 1.28% | 1.53% | 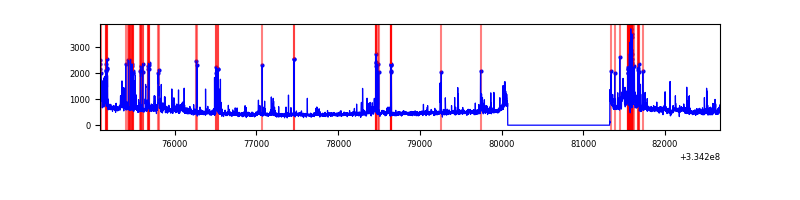 |
Top three noisy pixels from each quadrant. If the there are fewer than three noisy pixels in the level2.evt file, extra rows are filled as -1
| Pixel properties | Quadrant properties | ||||||
|---|---|---|---|---|---|---|---|
| Quadrant | DetID | PixID | Counts | Sigma | Mean | Median | Sigma |
| A | 0 | 13 | 146632 | 887.13 | 821 | 805 | 164.4 |
| A | 6 | 16 | 15164 | 87.35 | 821 | 805 | 164.4 |
| A | 13 | 254 | 9891 | 55.27 | 821 | 805 | 164.4 |
| B | 5 | 172 | 112643 | 725.63 | 831 | 816 | 154.1 |
| B | 0 | 230 | 37607 | 238.73 | 831 | 816 | 154.1 |
| B | 7 | 219 | 21377 | 133.42 | 831 | 816 | 154.1 |
| C | 3 | 233 | 233900 | 1242.71 | 806 | 813 | 187.6 |
| C | 14 | 238 | 129871 | 688.08 | 806 | 813 | 187.6 |
| C | 2 | 16 | 38360 | 200.18 | 806 | 813 | 187.6 |
| D | 1 | 52 | 656599 | 3481.79 | 796 | 779 | 188.4 |
| D | 12 | 233 | 95982 | 505.44 | 796 | 779 | 188.4 |
| D | 2 | 234 | 26864 | 138.48 | 796 | 779 | 188.4 |
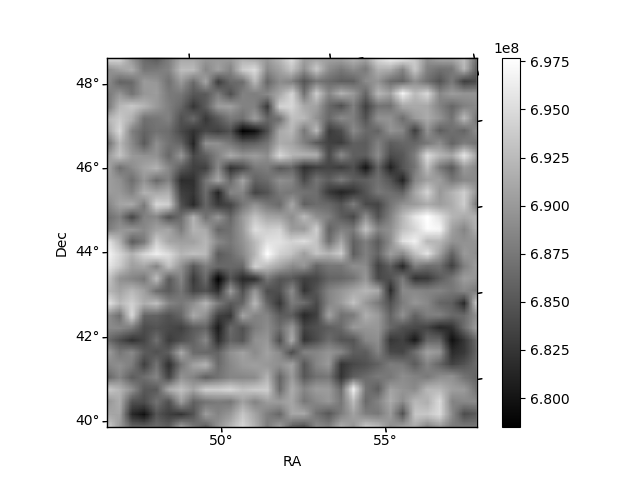
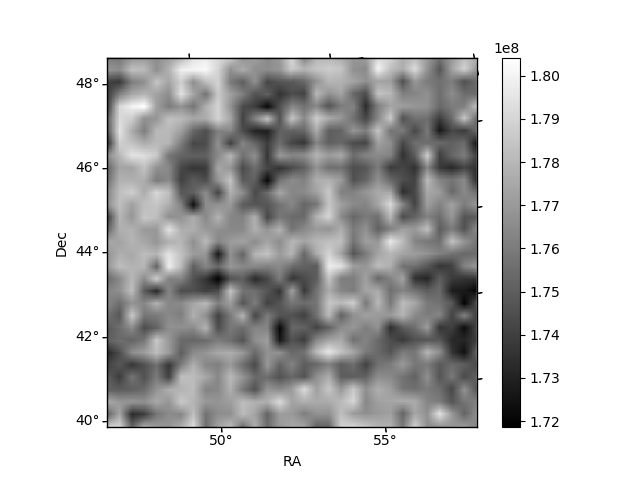
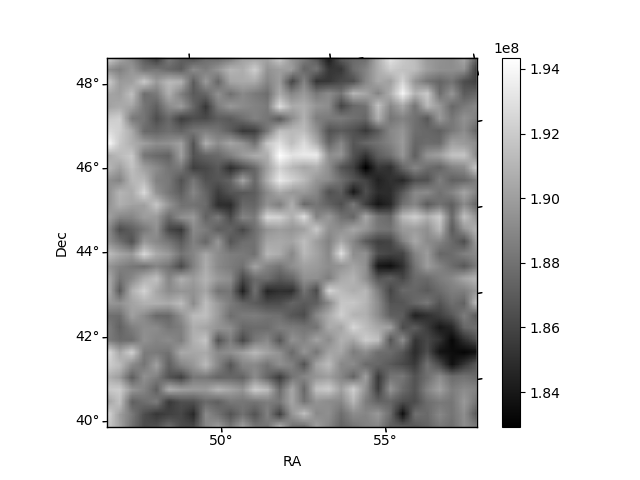
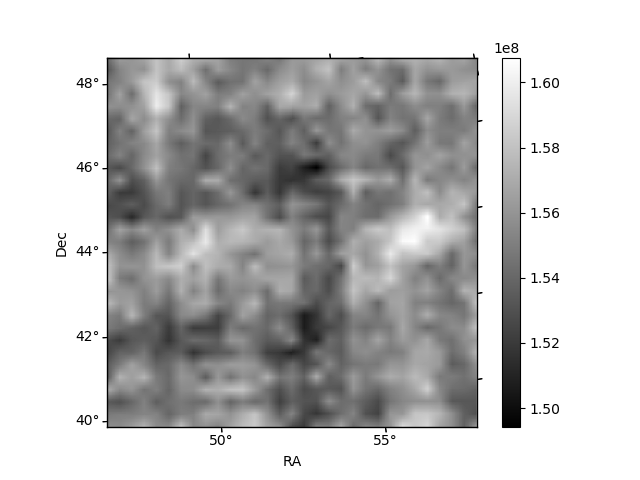
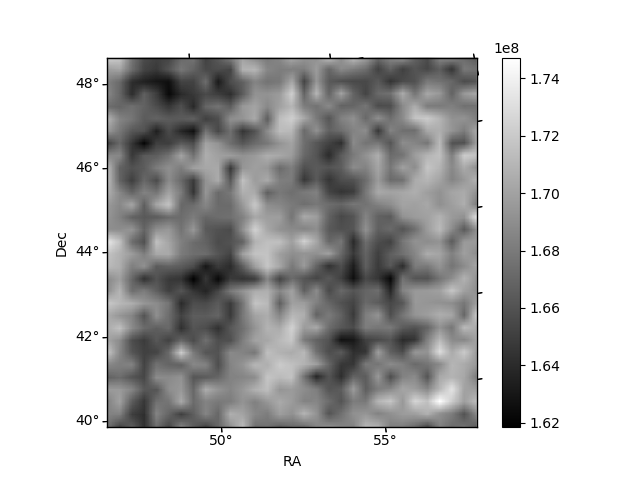
Histogram calculated using DETX and DETY for each event in the final _common_clean file
| Quadrant A | 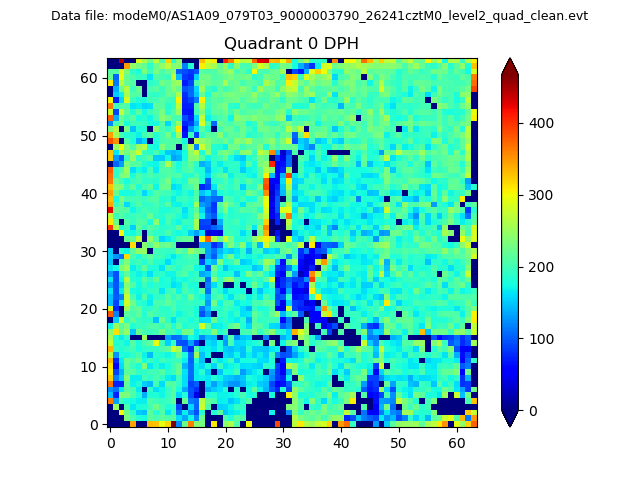 |
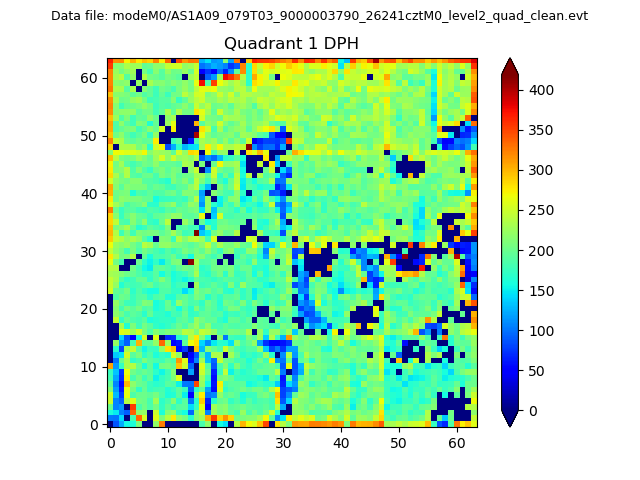 |
Quadrant B |
|---|---|---|---|
| Quadrant D | 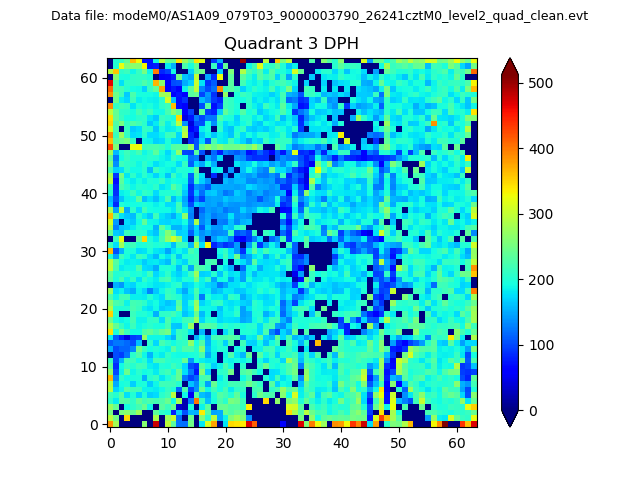 |
 |
Quadrant C |
| Plot type | Count rate plots | Images |
|---|---|---|
| Comparison with Poisson distribution Blue bars denote a histogram of data divided into 1 sec bins. Red curve is a Poisson curve with rate = median count rate of data. |
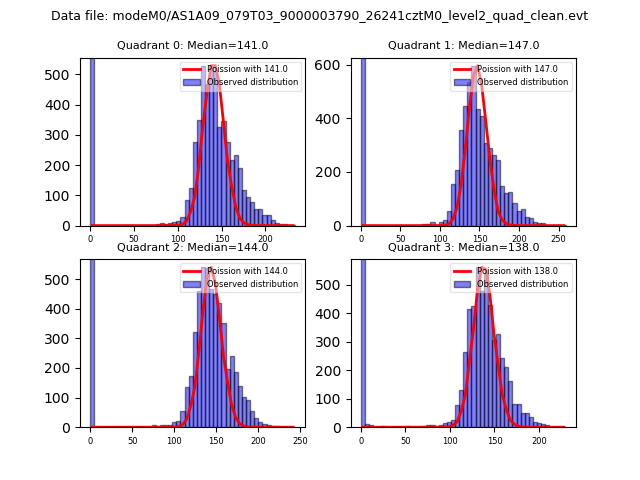 |
 |
| Quadrant-wise count rates Data is divided into 100 sec bins |
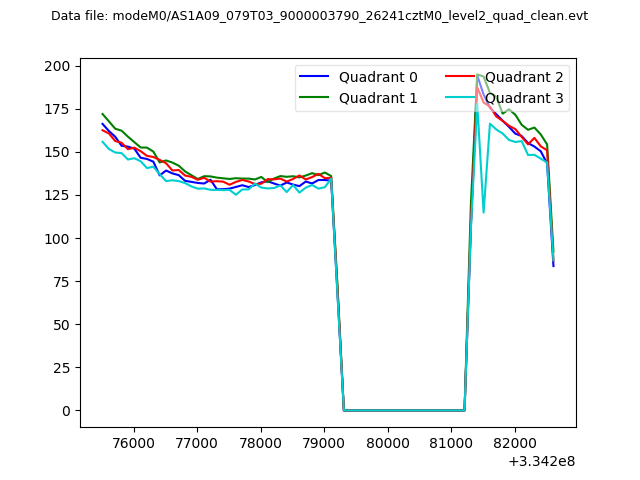 |
|
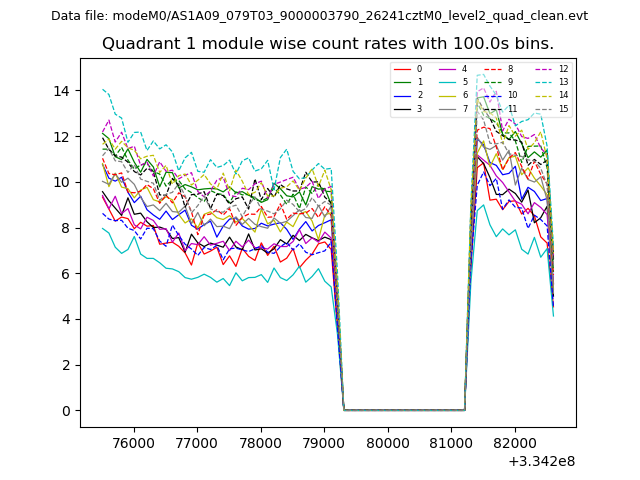
| Module-wise count rates for Quadrant A Data is divided into 100 sec bins |
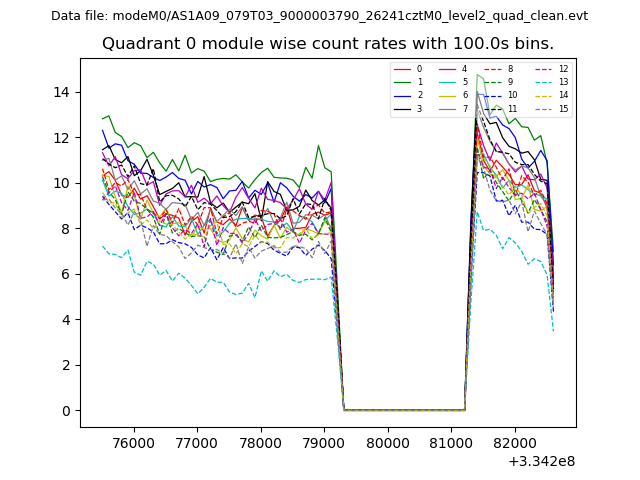 |
 |
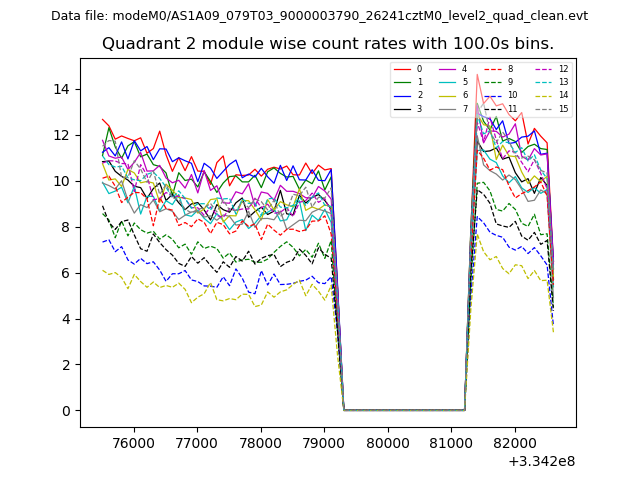
| Module-wise count rates for Quadrant B Data is divided into 100 sec bins |
 |
 |
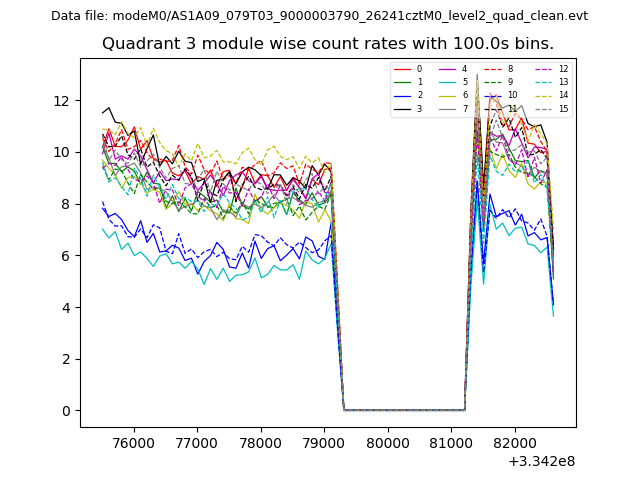
| Module-wise count rates for Quadrant C Data is divided into 100 sec bins |
 |
 |
| Module-wise count rates for Quadrant D Data is divided into 100 sec bins |
 |
 |
| Parameter | Plot |
|---|---|
| CZT HV Monitor | 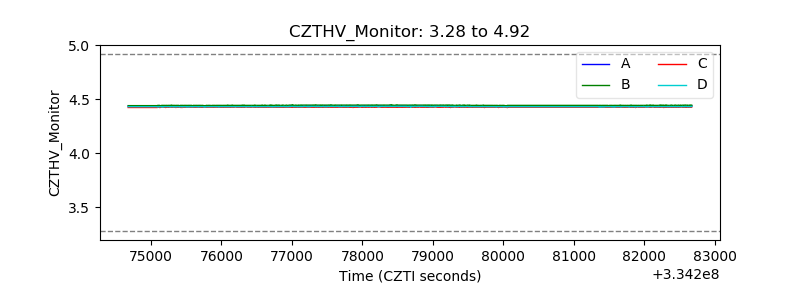 |
| D_VDD | 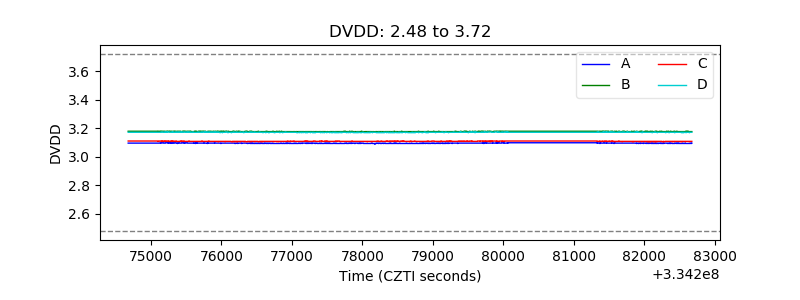 |
| Temperature 1 |  |
| Veto HV Monitor |  |
| Veto LLD | 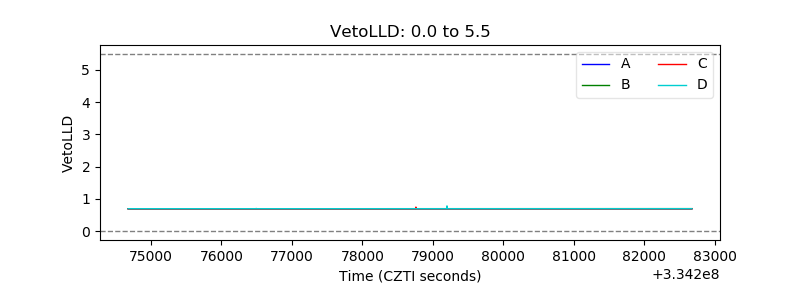 |
| Alpha Counter | 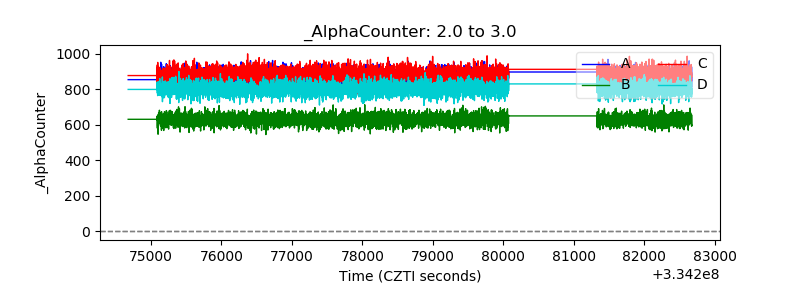 |
| _CPM_Rate | 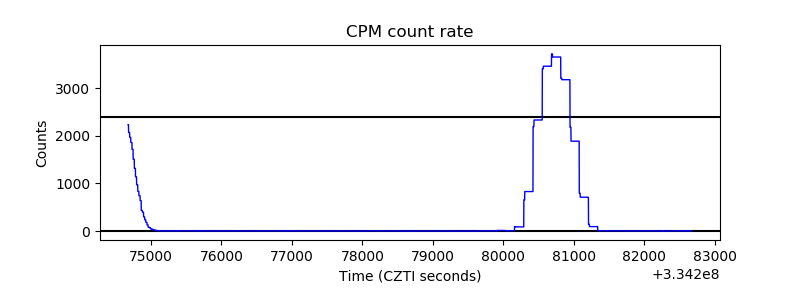 |
| CZT Counter |  |
| +2.5 Volts monitor |  |
| +5 Volts monitor |  |
| _ROLL_ROT | 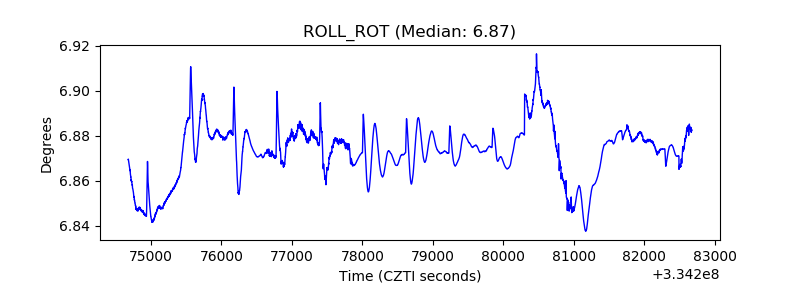 |
| _Roll_DEC | 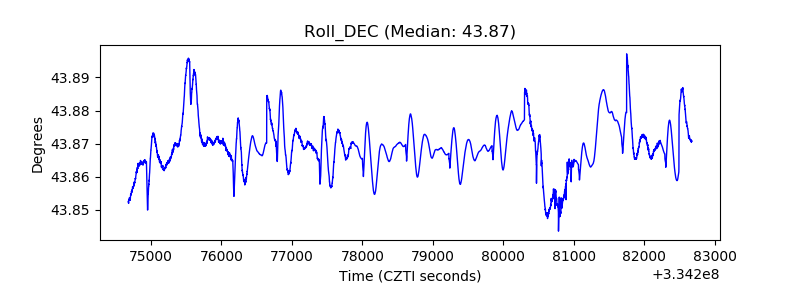 |
| _Roll_RA | 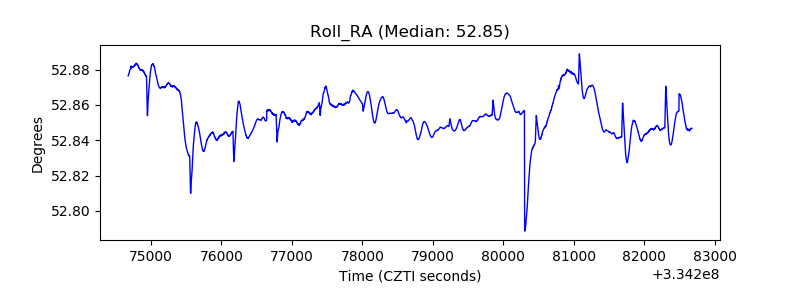 |
| Veto Counter | 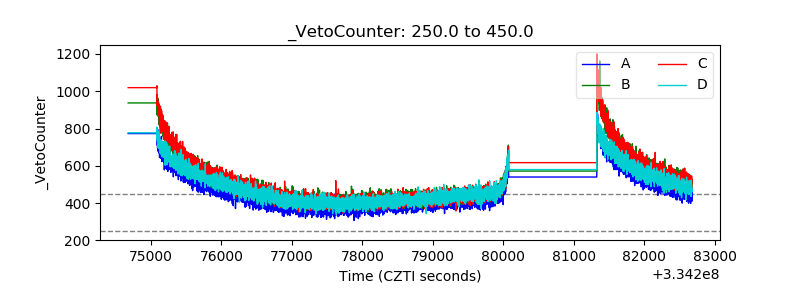 |