| Param | Original file | Final file |
|---|---|---|
| Filename | modeM0/AS1A09_079T03_9000003790_26242cztM0_level2.evt | modeM0/AS1A09_079T03_9000003790_26242cztM0_level2_quad_clean.evt |
| Size (bytes) | 504,247,680 | 114,252,480 |
| Size | 480.9 MB | 109.0 MB |
| Events in quadrant A | 3,458,508 | 756,454 |
| Events in quadrant B | 3,300,129 | 800,424 |
| Events in quadrant C | 3,463,712 | 768,426 |
| Events in quadrant D | 4,628,595 | 702,425 |
| Mode M0 | |||
|---|---|---|---|
| Quadrant | BADHDUFLAG | Total packets | Discarded packets |
| A | 0 | 14236 | 0 |
| B | 0 | 13694 | 0 |
| C | 0 | 14298 | 0 |
| D | 0 | 18016 | 0 |
| Mode M9 | |||
|---|---|---|---|
| Quadrant | BADHDUFLAG | Total packets | Discarded packets |
| A | 0 | 21 | 0 |
| B | 0 | 22 | 0 |
| C | 0 | 22 | 0 |
| D | 0 | 22 | 0 |
| Quadrant | Total seconds | Saturated seconds | Saturation percentage |
|---|---|---|---|
| A | 6197 | 80 | 1.290947% |
| B | 6197 | 59 | 0.952074% |
| C | 6197 | 118 | 1.904147% |
| D | 6197 | 475 | 7.664999% |
Noise dominated data is calculated using 1-second bins in cleaned event files. If a bin has >2000 counts, and if more than 50% of those come from <1% of pixels, then it is considered to be noise-dominated and hence unusable.
| Quadrant | # 1 sec bins | Bins with >0 counts | Bins with >2000 counts | High rate bins dominated by noise | Noise dominated (total time) | Noise dominated (detector-on time) | Marked lightcurve |
|---|---|---|---|---|---|---|---|
| A | 7527 | 6198 | 64 | 64 | 0.85% | 1.03% | 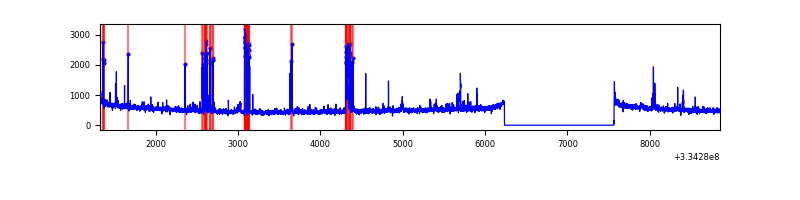 |
| B | 7527 | 6198 | 14 | 14 | 0.19% | 0.23% | 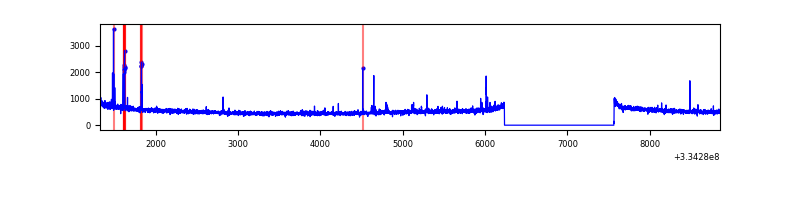 |
| C | 7527 | 6198 | 6 | 6 | 0.08% | 0.10% |  |
| D | 7527 | 6198 | 437 | 437 | 5.81% | 7.05% | 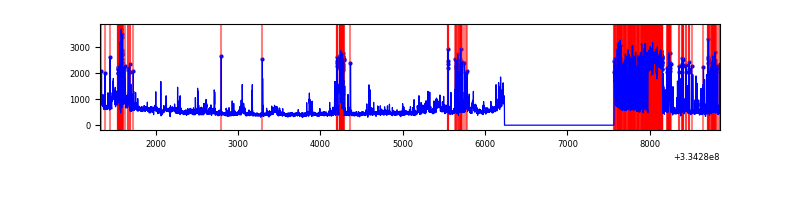 |
Top three noisy pixels from each quadrant. If the there are fewer than three noisy pixels in the level2.evt file, extra rows are filled as -1
| Pixel properties | Quadrant properties | ||||||
|---|---|---|---|---|---|---|---|
| Quadrant | DetID | PixID | Counts | Sigma | Mean | Median | Sigma |
| A | 0 | 13 | 323986 | 2011.92 | 809 | 796 | 160.6 |
| A | 13 | 254 | 9964 | 57.07 | 809 | 796 | 160.6 |
| A | 13 | 170 | 7180 | 39.74 | 809 | 796 | 160.6 |
| B | 5 | 172 | 58576 | 377.45 | 823 | 805 | 153.1 |
| B | 12 | 111 | 17413 | 108.51 | 823 | 805 | 153.1 |
| B | 0 | 230 | 15957 | 99.0 | 823 | 805 | 153.1 |
| C | 3 | 233 | 163887 | 884.64 | 795 | 803 | 184.3 |
| C | 14 | 238 | 129730 | 699.36 | 795 | 803 | 184.3 |
| C | 2 | 16 | 55862 | 298.67 | 795 | 803 | 184.3 |
| D | 1 | 52 | 1302894 | 7204.93 | 762 | 746 | 180.7 |
| D | 13 | 168 | 332100 | 1833.42 | 762 | 746 | 180.7 |
| D | 12 | 233 | 54734 | 298.72 | 762 | 746 | 180.7 |
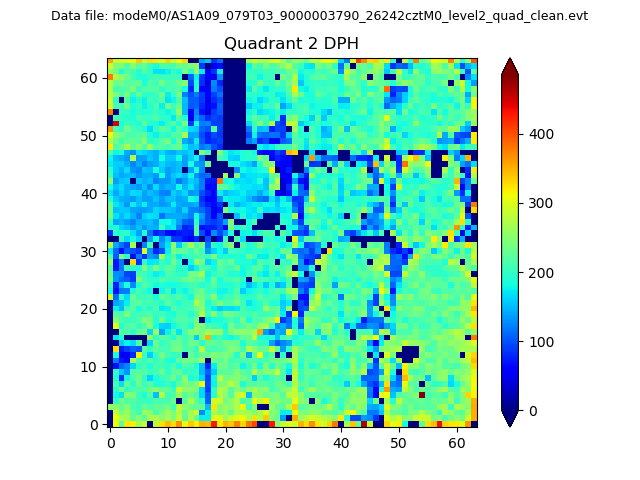
Histogram calculated using DETX and DETY for each event in the final _common_clean file
| Quadrant A | 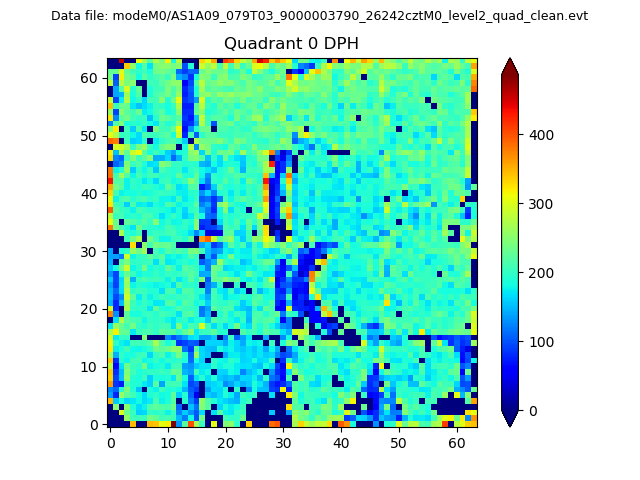 |
 |
Quadrant B |
|---|---|---|---|
| Quadrant D | 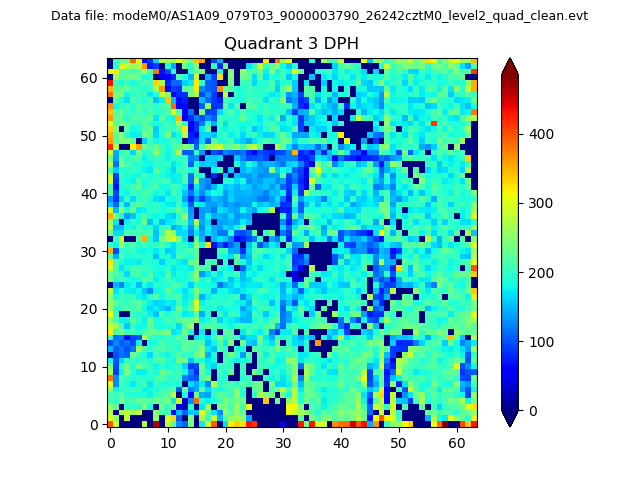 |
 |
Quadrant C |
| Plot type | Count rate plots | Images |
|---|---|---|
| Comparison with Poisson distribution Blue bars denote a histogram of data divided into 1 sec bins. Red curve is a Poisson curve with rate = median count rate of data. |
 |
 |
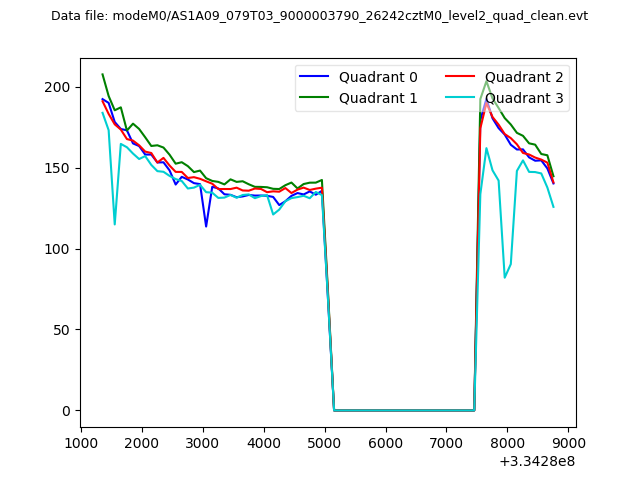
| Quadrant-wise count rates Data is divided into 100 sec bins |
 |
|
| Module-wise count rates for Quadrant A Data is divided into 100 sec bins |
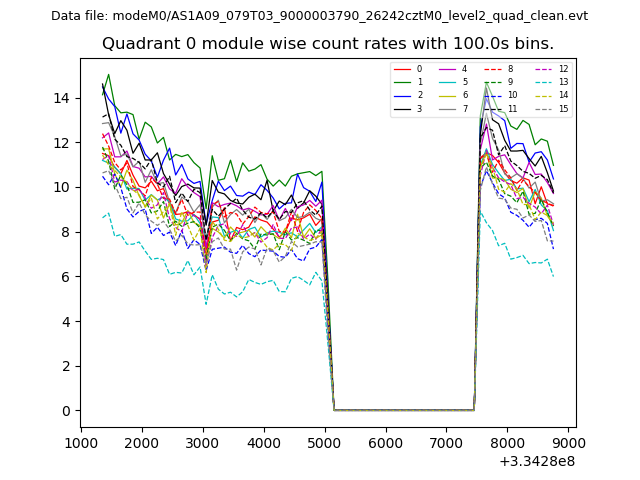 |
 |
| Module-wise count rates for Quadrant B Data is divided into 100 sec bins |
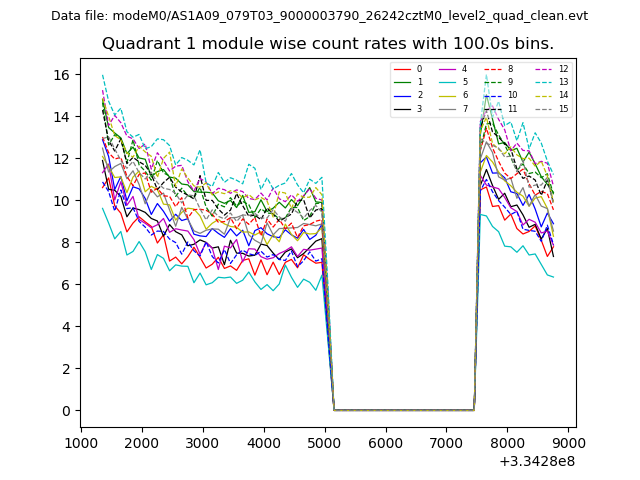 |
 |
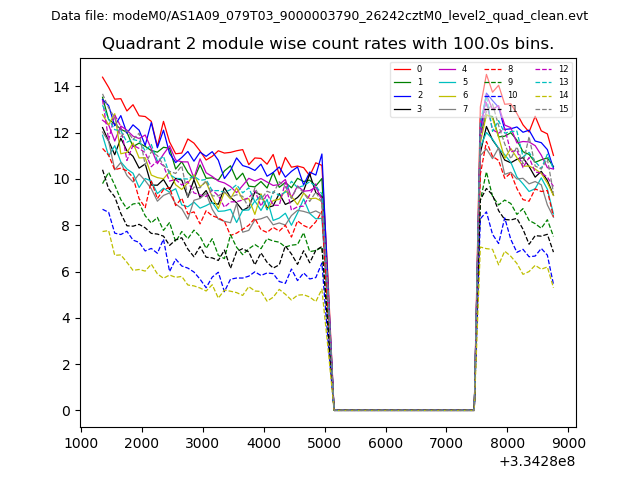
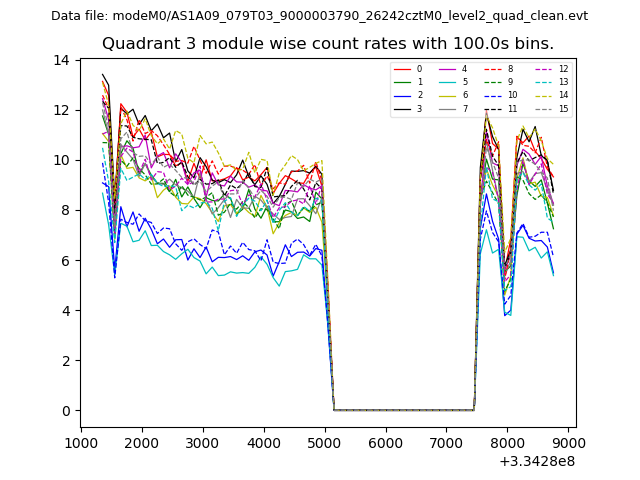
| Module-wise count rates for Quadrant C Data is divided into 100 sec bins |
 |
 |
| Module-wise count rates for Quadrant D Data is divided into 100 sec bins |
 |
 |
| Parameter | Plot |
|---|---|
| CZT HV Monitor | 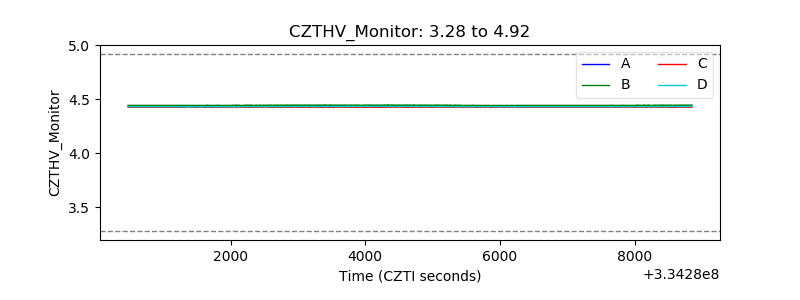 |
| D_VDD | 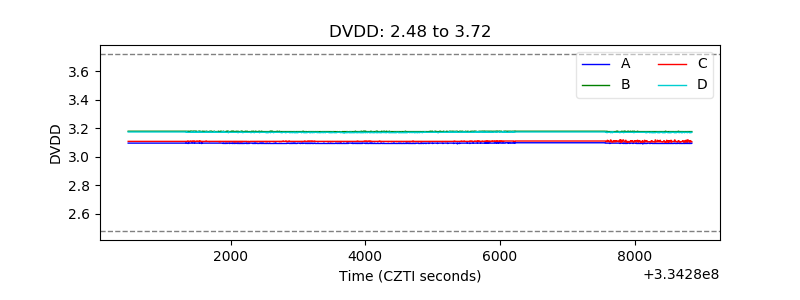 |
| Temperature 1 | 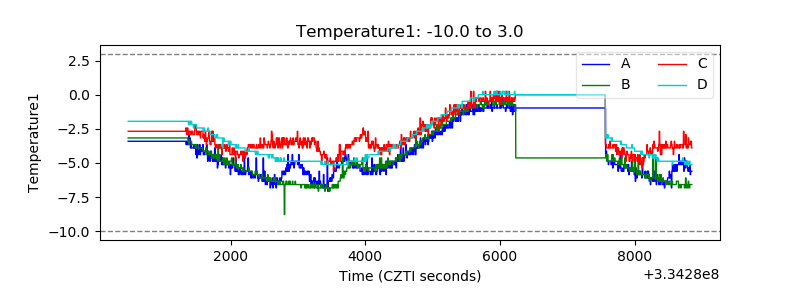 |
| Veto HV Monitor | 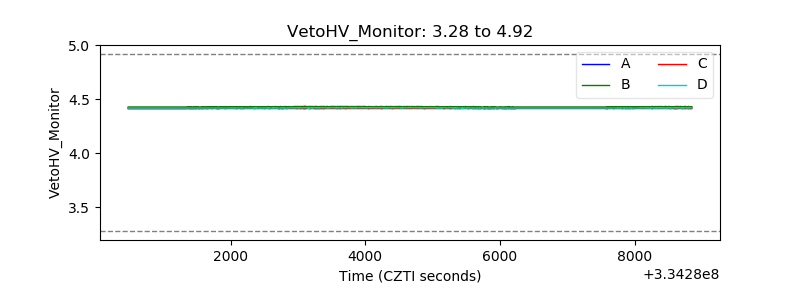 |
| Veto LLD | 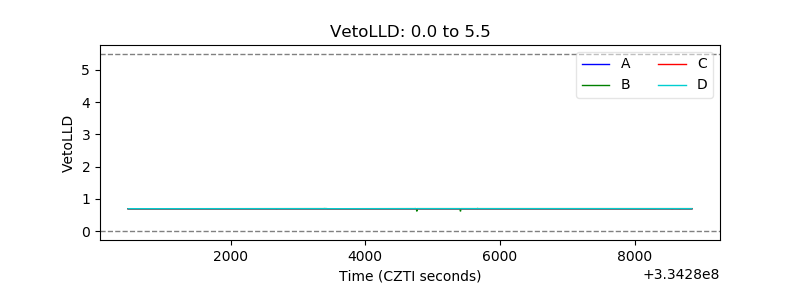 |
| Alpha Counter | 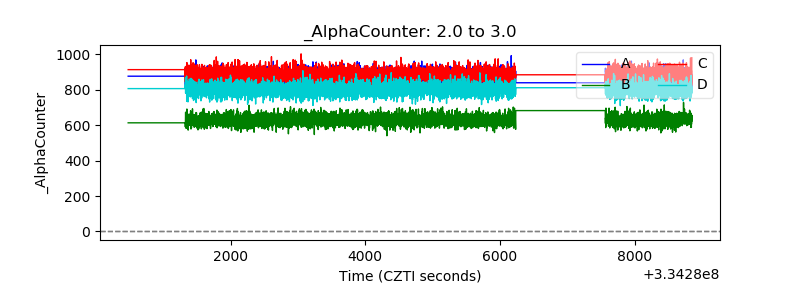 |
| _CPM_Rate | 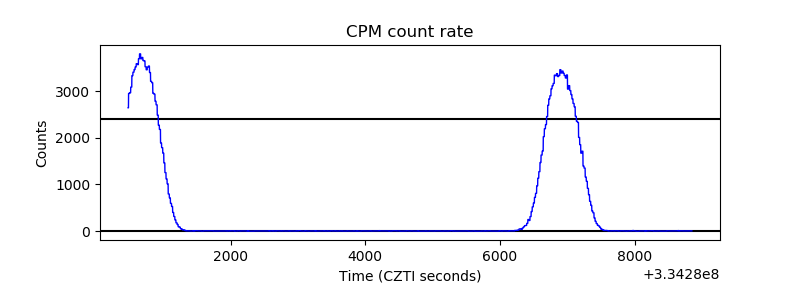 |
| CZT Counter | 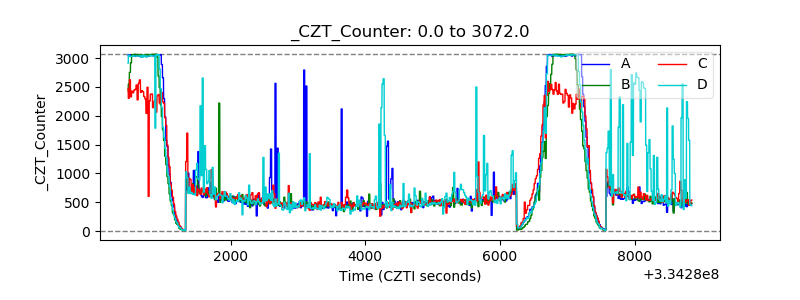 |
| +2.5 Volts monitor |  |
| +5 Volts monitor | 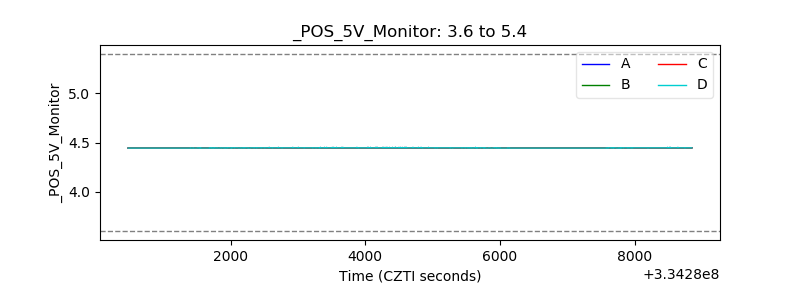 |
| _ROLL_ROT | 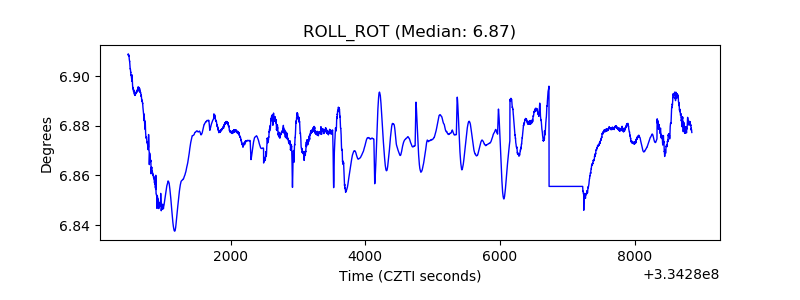 |
| _Roll_DEC | 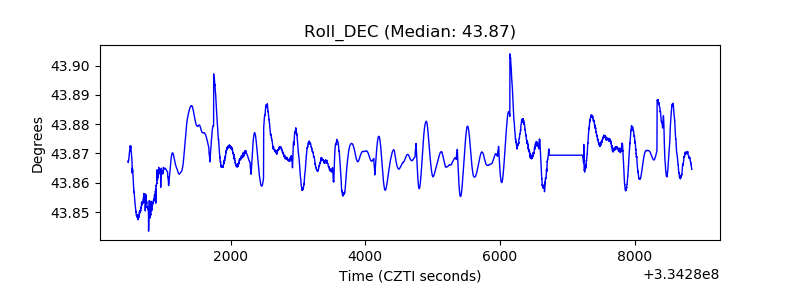 |
| _Roll_RA | 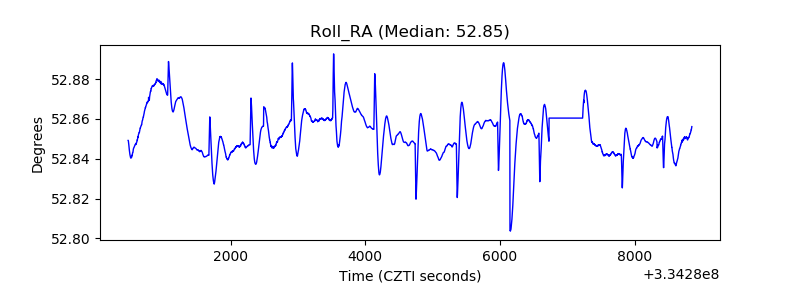 |
| Veto Counter | 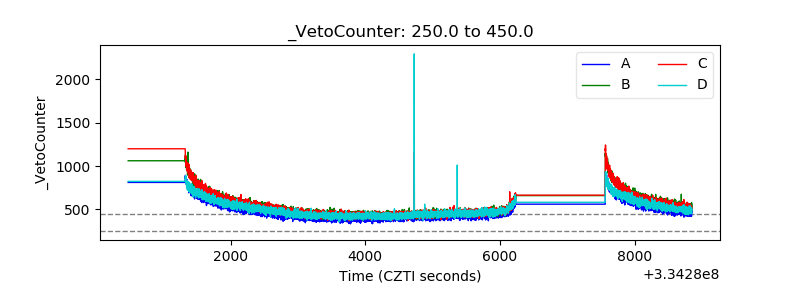 |