| Param | Original file | Final file |
|---|---|---|
| Filename | modeM0/AS1A09_079T03_9000003790_26243cztM0_level2.evt | modeM0/AS1A09_079T03_9000003790_26243cztM0_level2_quad_clean.evt |
| Size (bytes) | 527,307,840 | 114,050,880 |
| Size | 502.9 MB | 108.8 MB |
| Events in quadrant A | 3,367,788 | 752,381 |
| Events in quadrant B | 3,416,234 | 792,477 |
| Events in quadrant C | 3,694,771 | 756,301 |
| Events in quadrant D | 5,046,952 | 696,566 |
| Mode M0 | |||
|---|---|---|---|
| Quadrant | BADHDUFLAG | Total packets | Discarded packets |
| A | 0 | 14134 | 0 |
| B | 0 | 14226 | 0 |
| C | 0 | 15128 | 0 |
| D | 0 | 19405 | 0 |
| Mode M9 | |||
|---|---|---|---|
| Quadrant | BADHDUFLAG | Total packets | Discarded packets |
| A | 0 | 16 | 0 |
| B | 0 | 17 | 0 |
| C | 0 | 17 | 0 |
| D | 0 | 17 | 0 |
| Quadrant | Total seconds | Saturated seconds | Saturation percentage |
|---|---|---|---|
| A | 6547 | 31 | 0.473499% |
| B | 6547 | 53 | 0.809531% |
| C | 6547 | 136 | 2.077287% |
| D | 6547 | 473 | 7.224683% |
Noise dominated data is calculated using 1-second bins in cleaned event files. If a bin has >2000 counts, and if more than 50% of those come from <1% of pixels, then it is considered to be noise-dominated and hence unusable.
| Quadrant | # 1 sec bins | Bins with >0 counts | Bins with >2000 counts | High rate bins dominated by noise | Noise dominated (total time) | Noise dominated (detector-on time) | Marked lightcurve |
|---|---|---|---|---|---|---|---|
| A | 7897 | 6548 | 8 | 8 | 0.10% | 0.12% | 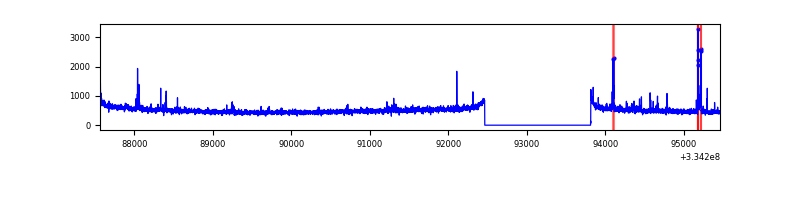 |
| B | 7897 | 6548 | 6 | 6 | 0.08% | 0.09% | 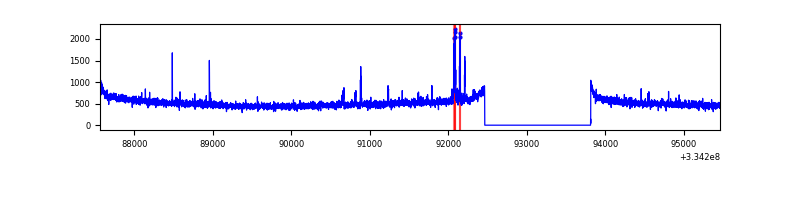 |
| C | 7897 | 6548 | 37 | 37 | 0.47% | 0.57% | 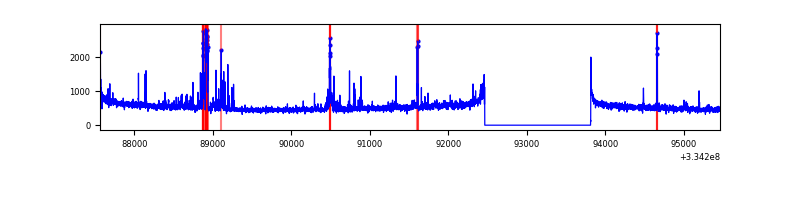 |
| D | 7897 | 6548 | 400 | 400 | 5.07% | 6.11% | 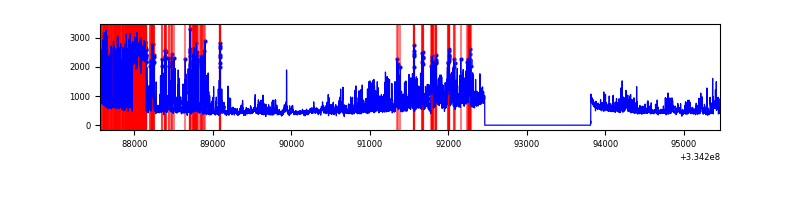 |
Top three noisy pixels from each quadrant. If the there are fewer than three noisy pixels in the level2.evt file, extra rows are filled as -1
| Pixel properties | Quadrant properties | ||||||
|---|---|---|---|---|---|---|---|
| Quadrant | DetID | PixID | Counts | Sigma | Mean | Median | Sigma |
| A | 0 | 13 | 111550 | 659.78 | 843 | 828 | 167.8 |
| A | 13 | 254 | 10652 | 58.54 | 843 | 828 | 167.8 |
| A | 0 | 226 | 7487 | 39.68 | 843 | 828 | 167.8 |
| B | 5 | 172 | 47503 | 290.62 | 857 | 836 | 160.6 |
| B | 0 | 230 | 23143 | 138.92 | 857 | 836 | 160.6 |
| B | 12 | 111 | 18415 | 109.47 | 857 | 836 | 160.6 |
| C | 2 | 16 | 250049 | 1310.02 | 821 | 828 | 190.2 |
| C | 14 | 238 | 133053 | 695.04 | 821 | 828 | 190.2 |
| C | 3 | 233 | 87447 | 455.31 | 821 | 828 | 190.2 |
| D | 1 | 52 | 1485323 | 7854.55 | 791 | 771 | 189.0 |
| D | 13 | 168 | 332780 | 1756.61 | 791 | 771 | 189.0 |
| D | 12 | 233 | 216939 | 1143.71 | 791 | 771 | 189.0 |
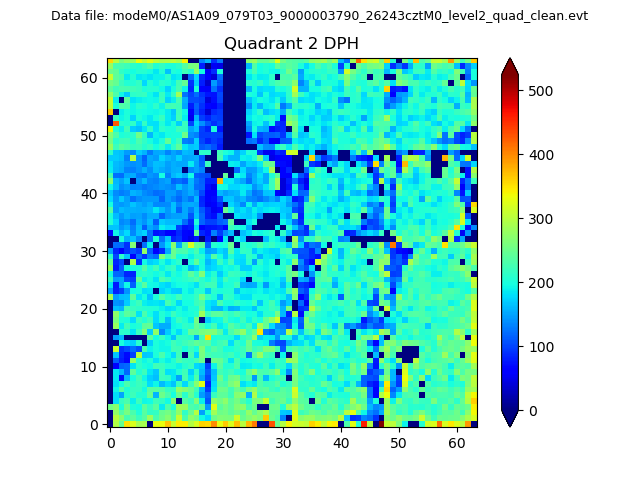
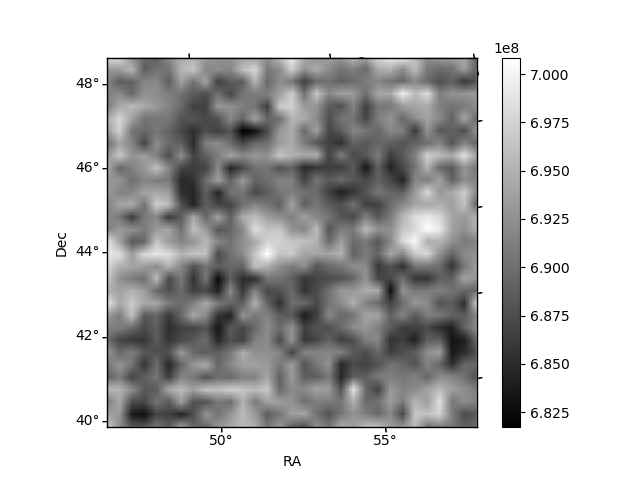
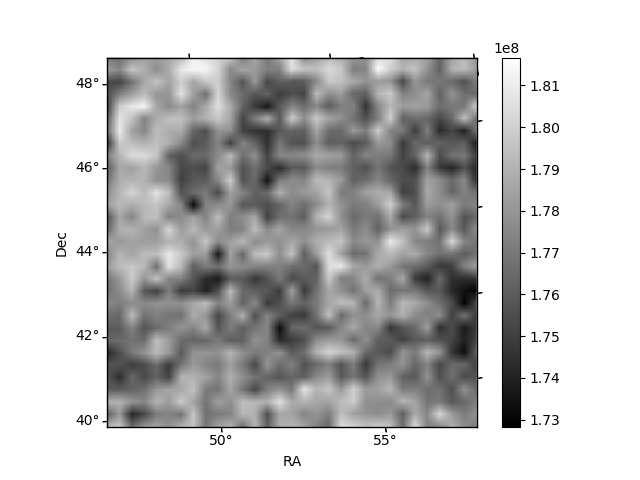
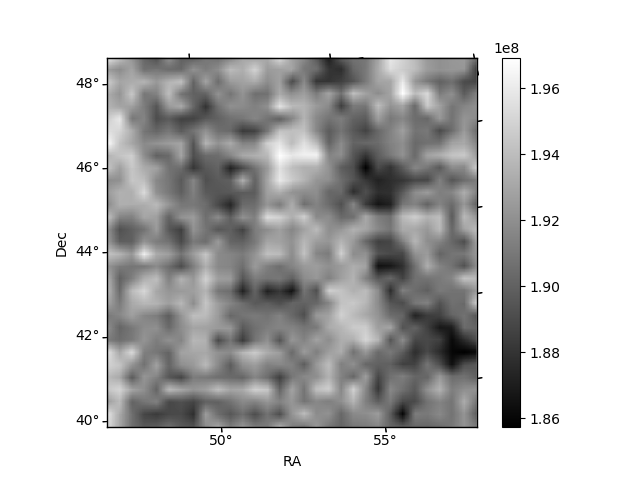
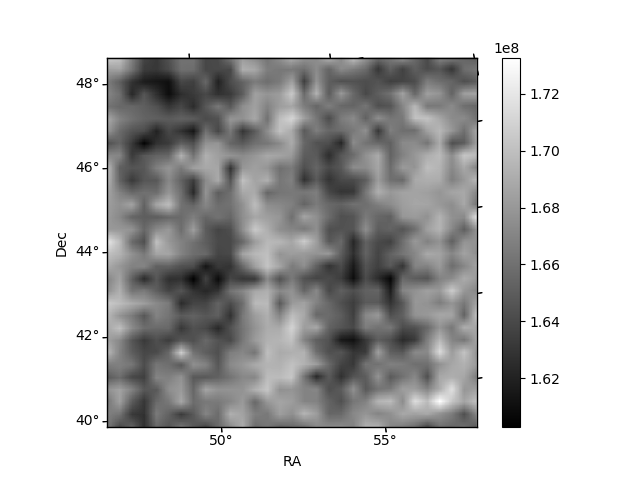
Histogram calculated using DETX and DETY for each event in the final _common_clean file
| Quadrant A | 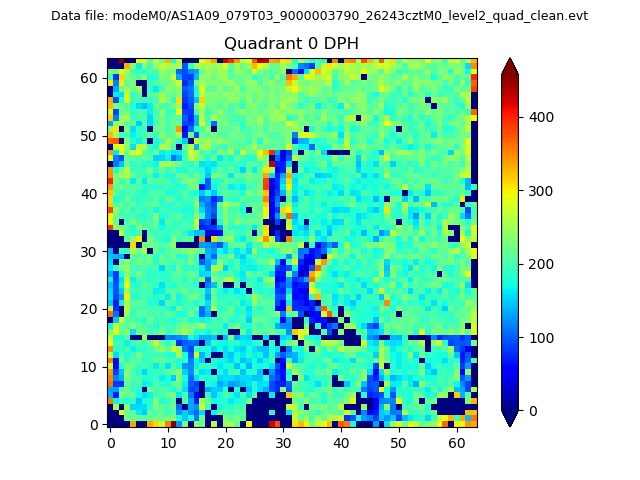 |
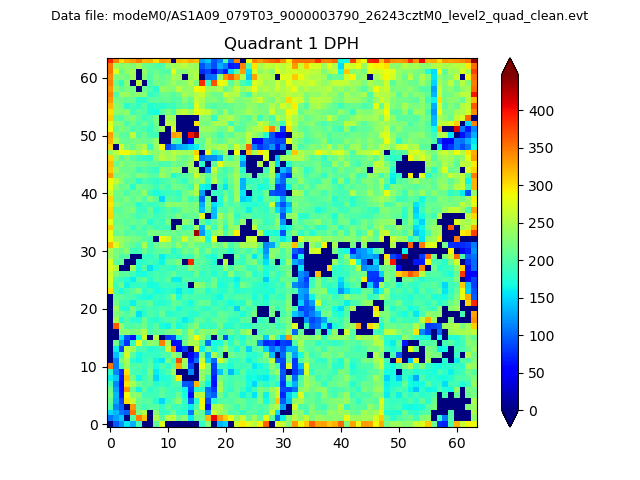 |
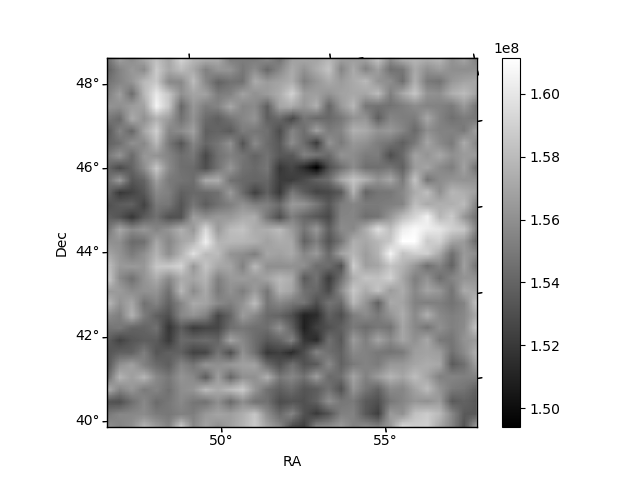
Quadrant B |
|---|---|---|---|
| Quadrant D | 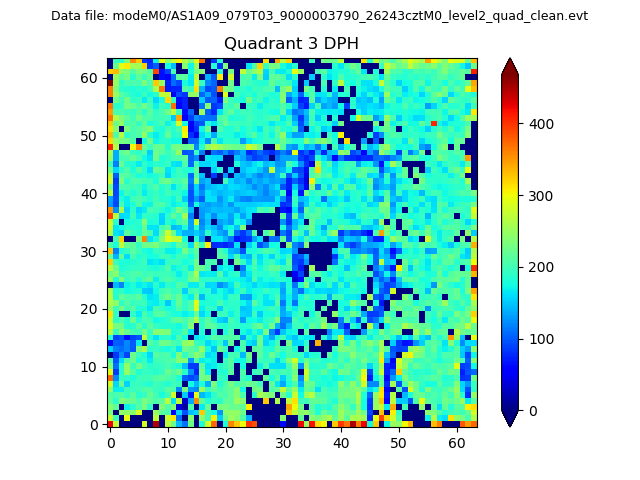 |
 |
Quadrant C |
| Plot type | Count rate plots | Images |
|---|---|---|
| Comparison with Poisson distribution Blue bars denote a histogram of data divided into 1 sec bins. Red curve is a Poisson curve with rate = median count rate of data. |
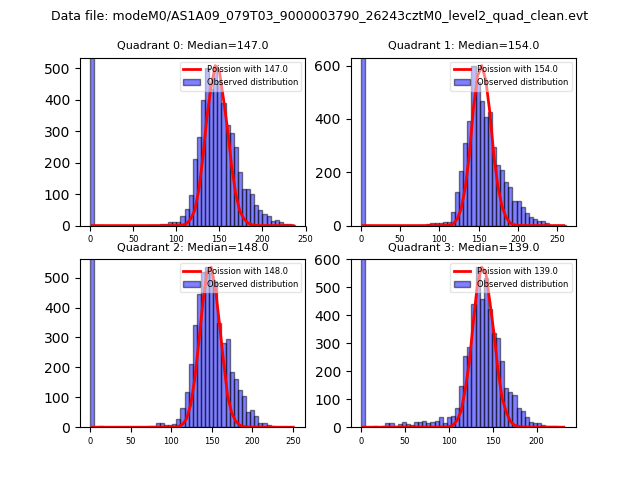 |
 |
| Quadrant-wise count rates Data is divided into 100 sec bins |
 |
|
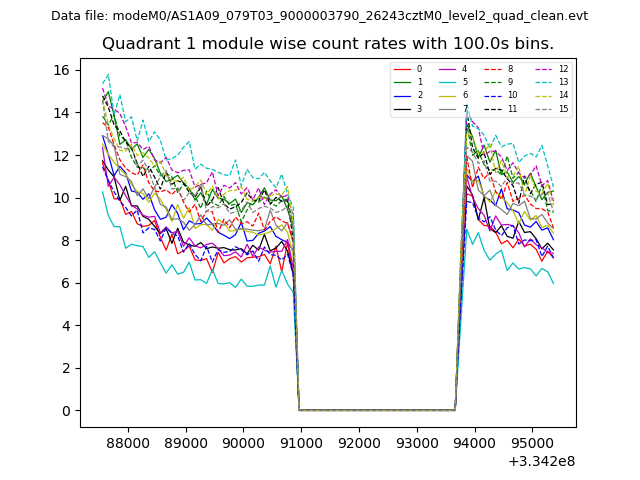
| Module-wise count rates for Quadrant A Data is divided into 100 sec bins |
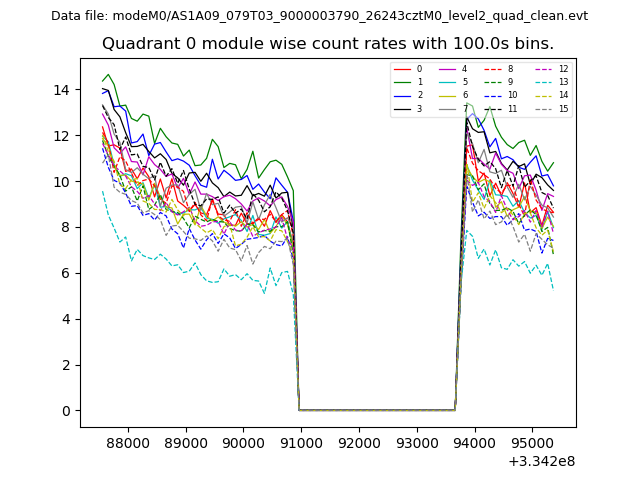 |
 |
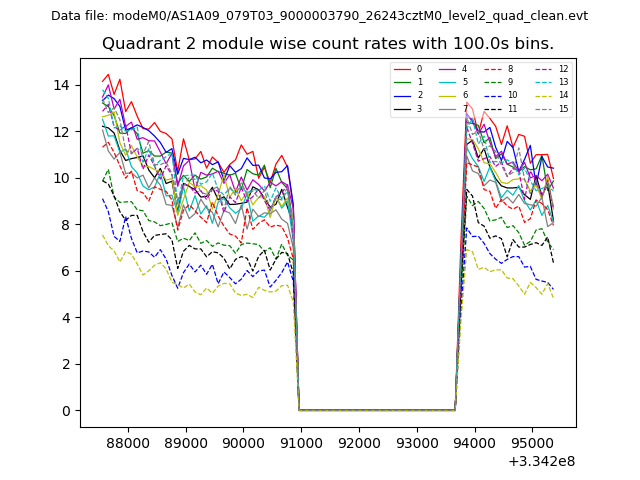
| Module-wise count rates for Quadrant B Data is divided into 100 sec bins |
 |
 |
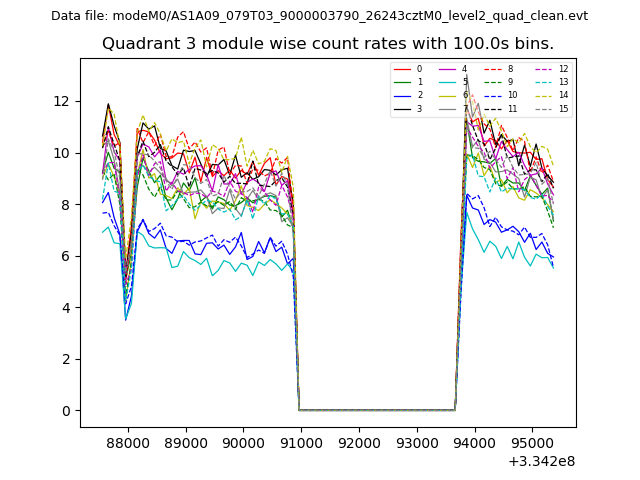
| Module-wise count rates for Quadrant C Data is divided into 100 sec bins |
 |
 |
| Module-wise count rates for Quadrant D Data is divided into 100 sec bins |
 |
 |
| Parameter | Plot |
|---|---|
| CZT HV Monitor | 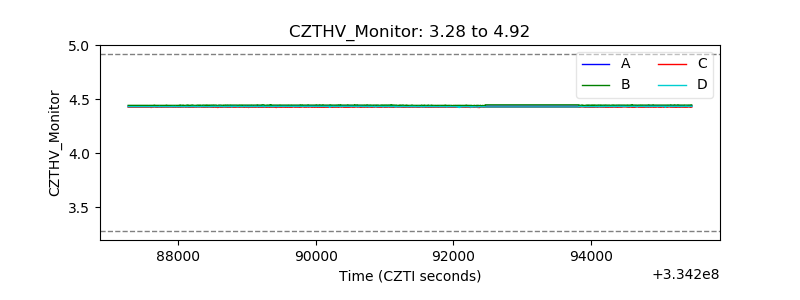 |
| D_VDD | 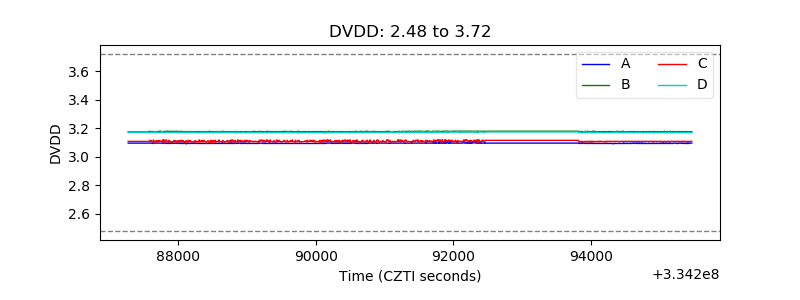 |
| Temperature 1 | 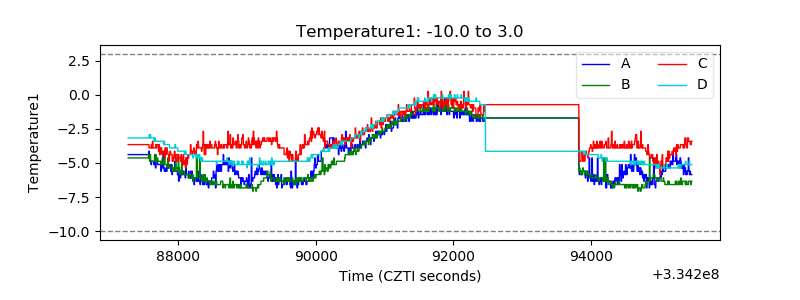 |
| Veto HV Monitor |  |
| Veto LLD | 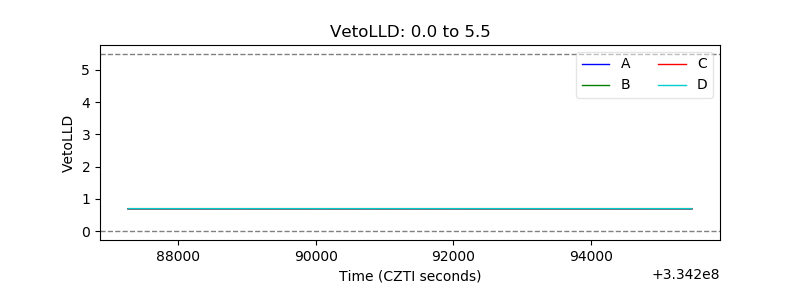 |
| Alpha Counter |  |
| _CPM_Rate | 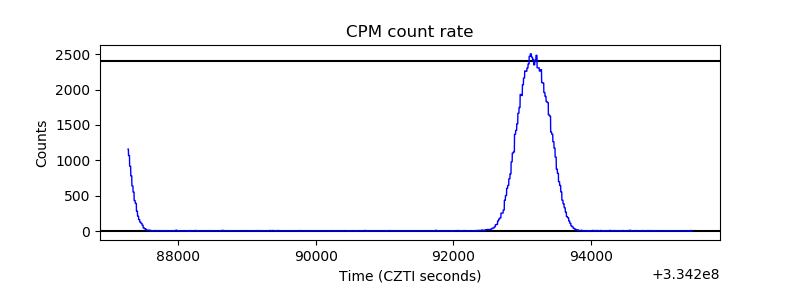 |
| CZT Counter | 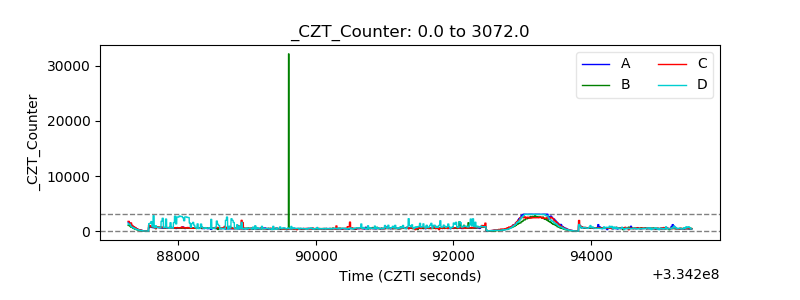 |
| +2.5 Volts monitor |  |
| +5 Volts monitor |  |
| _ROLL_ROT | 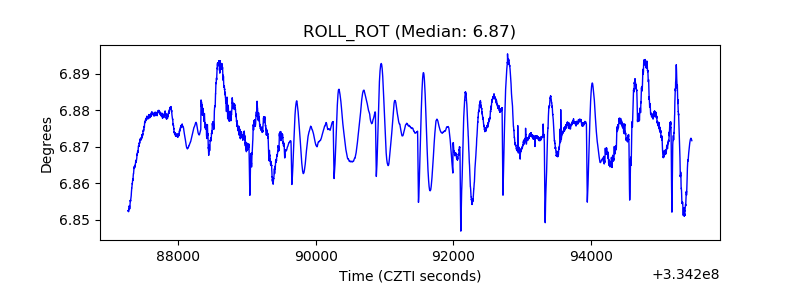 |
| _Roll_DEC | 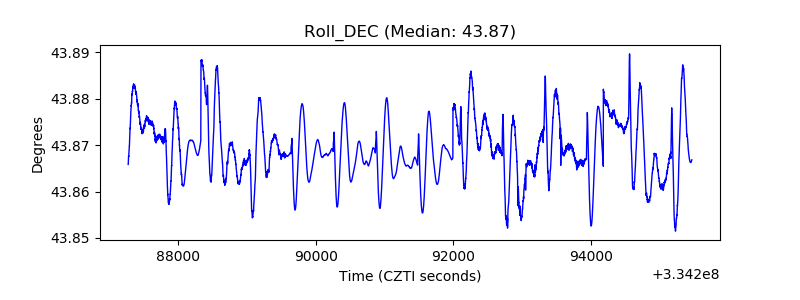 |
| _Roll_RA |  |
| Veto Counter | 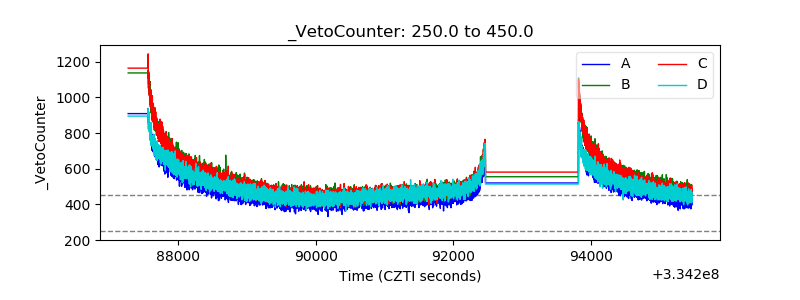 |