| Param | Original file | Final file |
|---|---|---|
| Filename | modeM0/AS1A09_079T03_9000003790_26244cztM0_level2.evt | modeM0/AS1A09_079T03_9000003790_26244cztM0_level2_quad_clean.evt |
| Size (bytes) | 522,910,080 | 101,871,360 |
| Size | 498.7 MB | 97.2 MB |
| Events in quadrant A | 3,654,130 | 655,881 |
| Events in quadrant B | 3,264,896 | 688,071 |
| Events in quadrant C | 4,294,013 | 650,796 |
| Events in quadrant D | 4,178,435 | 633,044 |
| Mode M0 | |||
|---|---|---|---|
| Quadrant | BADHDUFLAG | Total packets | Discarded packets |
| A | 0 | 15063 | 0 |
| B | 0 | 13736 | 0 |
| C | 0 | 16930 | 0 |
| D | 0 | 16981 | 0 |
| Mode M9 | |||
|---|---|---|---|
| Quadrant | BADHDUFLAG | Total packets | Discarded packets |
| A | 0 | 13 | 0 |
| B | 0 | 13 | 0 |
| C | 0 | 13 | 0 |
| D | 0 | 13 | 0 |
| Quadrant | Total seconds | Saturated seconds | Saturation percentage |
|---|---|---|---|
| A | 6553 | 131 | 1.999084% |
| B | 6554 | 16 | 0.244126% |
| C | 6554 | 331 | 5.050351% |
| D | 6554 | 184 | 2.807446% |
Noise dominated data is calculated using 1-second bins in cleaned event files. If a bin has >2000 counts, and if more than 50% of those come from <1% of pixels, then it is considered to be noise-dominated and hence unusable.
| Quadrant | # 1 sec bins | Bins with >0 counts | Bins with >2000 counts | High rate bins dominated by noise | Noise dominated (total time) | Noise dominated (detector-on time) | Marked lightcurve |
|---|---|---|---|---|---|---|---|
| A | 7883 | 6554 | 93 | 93 | 1.18% | 1.42% | 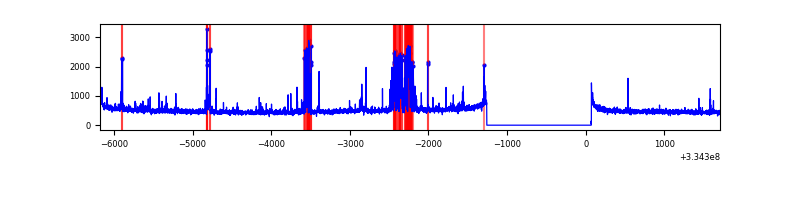 |
| B | 7884 | 6555 | 0 | 0 | 0.00% | 0.00% | 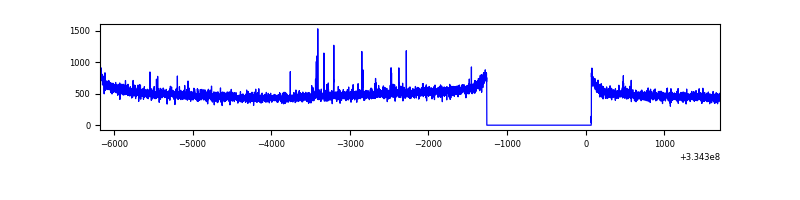 |
| C | 7884 | 6555 | 160 | 160 | 2.03% | 2.44% |  |
| D | 7884 | 6555 | 116 | 116 | 1.47% | 1.77% | 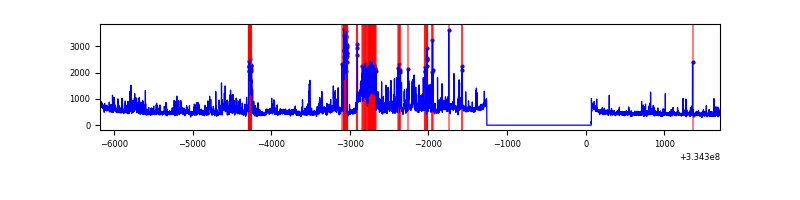 |
Top three noisy pixels from each quadrant. If the there are fewer than three noisy pixels in the level2.evt file, extra rows are filled as -1
| Pixel properties | Quadrant properties | ||||||
|---|---|---|---|---|---|---|---|
| Quadrant | DetID | PixID | Counts | Sigma | Mean | Median | Sigma |
| A | 0 | 13 | 508791 | 3114.93 | 816 | 801 | 163.1 |
| A | 13 | 254 | 10068 | 56.82 | 816 | 801 | 163.1 |
| A | 0 | 226 | 7206 | 39.27 | 816 | 801 | 163.1 |
| B | 12 | 111 | 18604 | 115.21 | 828 | 811 | 154.4 |
| B | 0 | 230 | 17716 | 109.46 | 828 | 811 | 154.4 |
| B | 11 | 111 | 16153 | 99.34 | 828 | 811 | 154.4 |
| C | 3 | 233 | 1079806 | 5962.05 | 783 | 790 | 181.0 |
| C | 14 | 238 | 126556 | 694.91 | 783 | 790 | 181.0 |
| C | 2 | 16 | 37574 | 203.25 | 783 | 790 | 181.0 |
| D | 1 | 52 | 1168536 | 6319.66 | 781 | 763 | 184.8 |
| D | 2 | 234 | 28371 | 149.41 | 781 | 763 | 184.8 |
| D | 12 | 233 | 22073 | 115.32 | 781 | 763 | 184.8 |
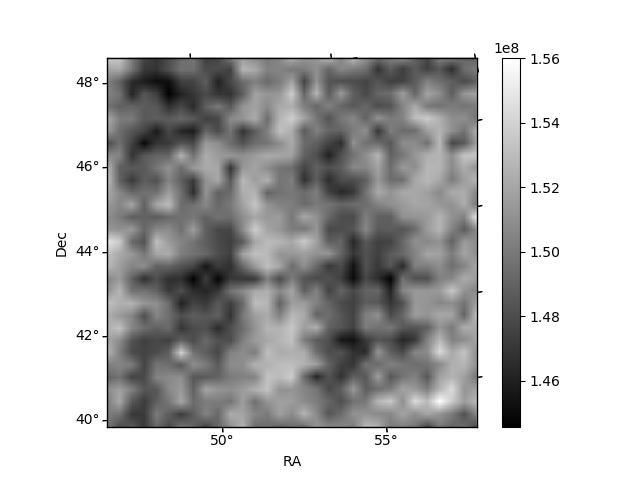
Histogram calculated using DETX and DETY for each event in the final _common_clean file
| Quadrant A | 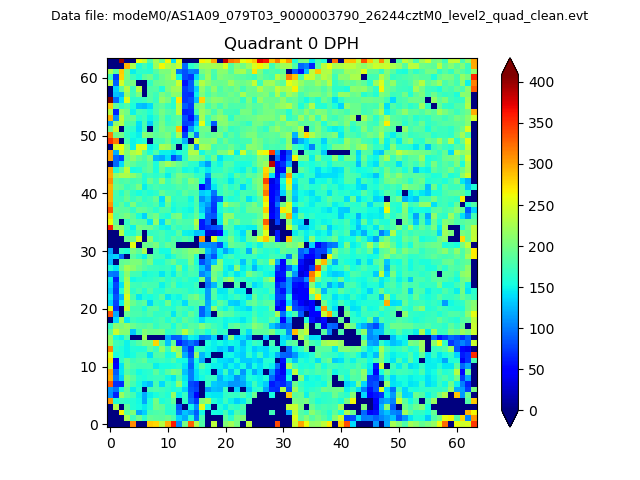 |
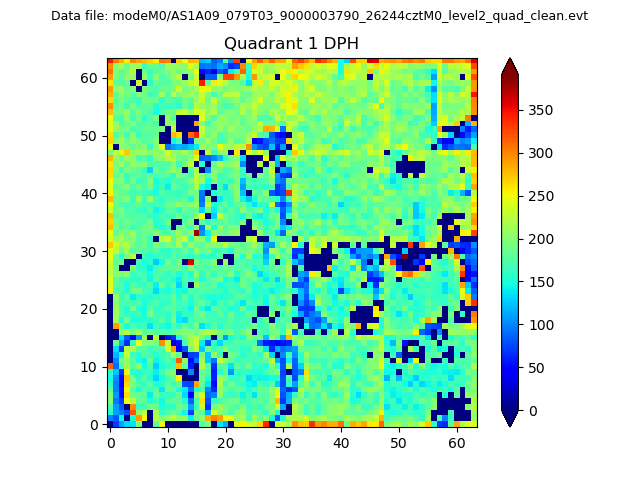 |
Quadrant B |
|---|---|---|---|
| Quadrant D | 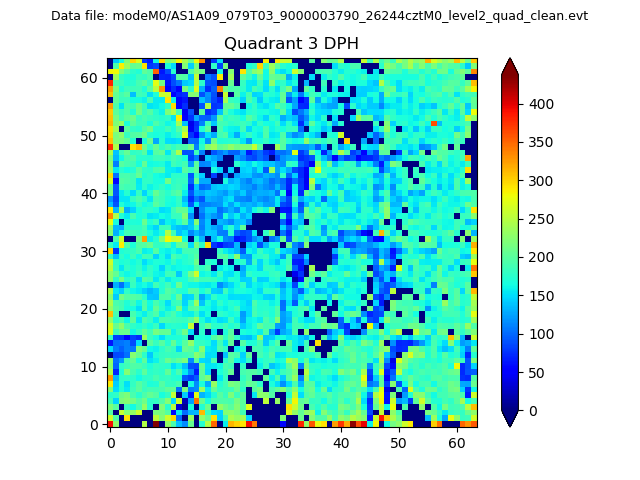 |
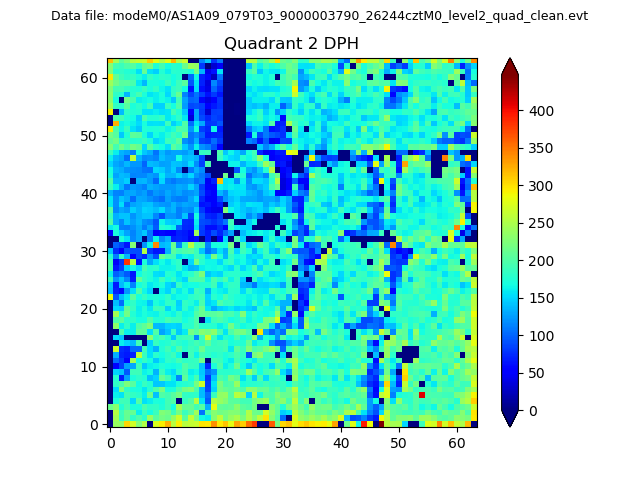 |
Quadrant C |
| Plot type | Count rate plots | Images |
|---|---|---|
| Comparison with Poisson distribution Blue bars denote a histogram of data divided into 1 sec bins. Red curve is a Poisson curve with rate = median count rate of data. |
 |
 |
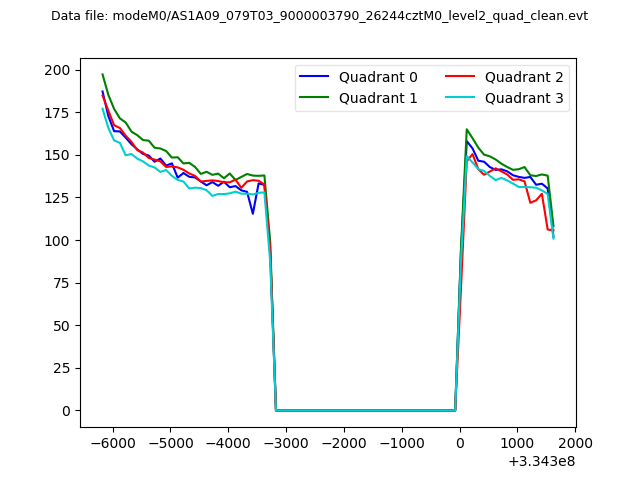
| Quadrant-wise count rates Data is divided into 100 sec bins |
 |
|
| Module-wise count rates for Quadrant A Data is divided into 100 sec bins |
 |
 |
| Module-wise count rates for Quadrant B Data is divided into 100 sec bins |
 |
 |
| Module-wise count rates for Quadrant C Data is divided into 100 sec bins |
 |
 |
| Module-wise count rates for Quadrant D Data is divided into 100 sec bins |
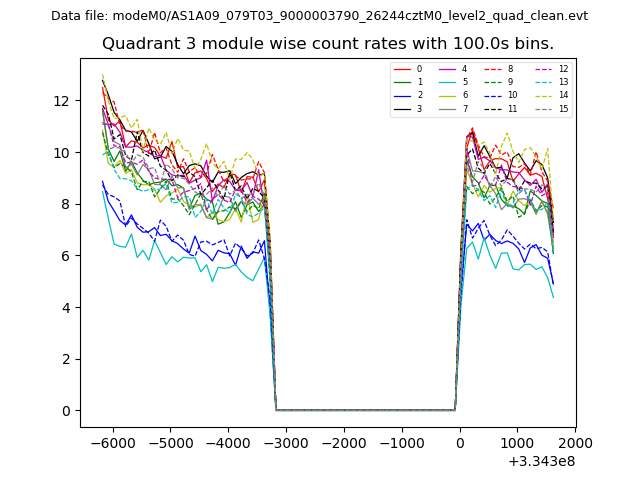 |
 |
| Parameter | Plot |
|---|---|
| CZT HV Monitor |  |
| D_VDD | 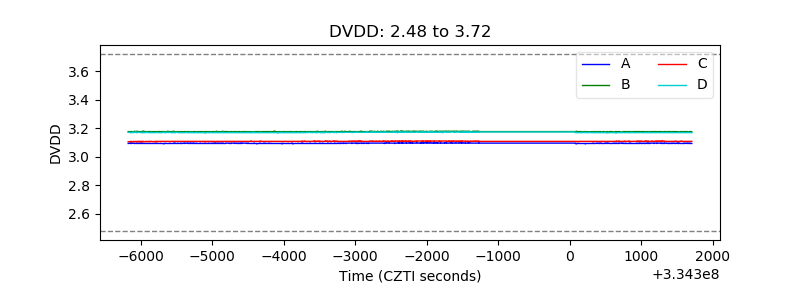 |
| Temperature 1 | 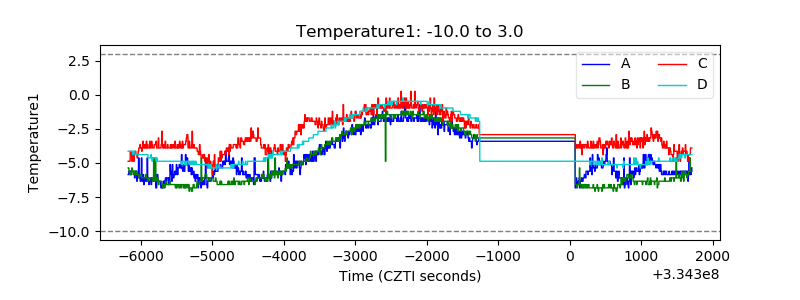 |
| Veto HV Monitor | 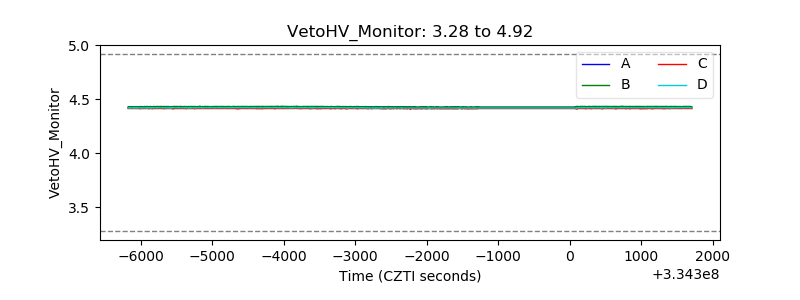 |
| Veto LLD | 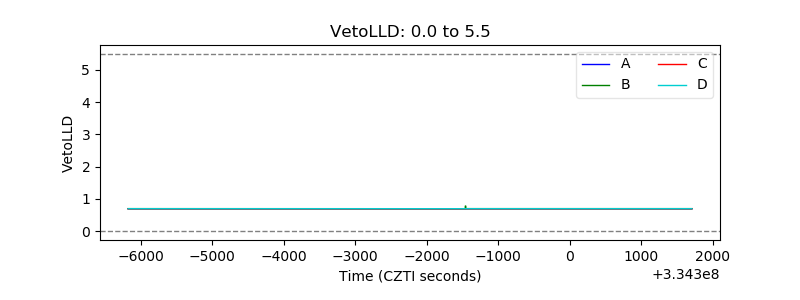 |
| Alpha Counter | 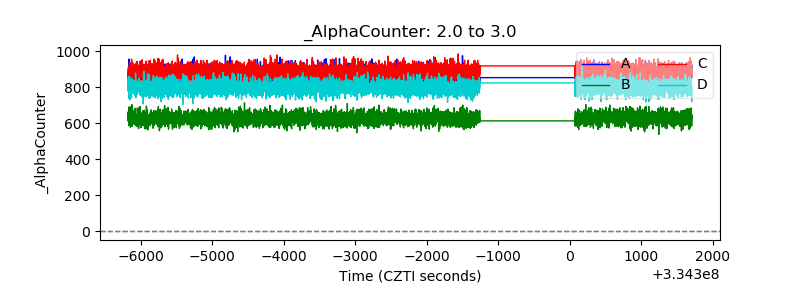 |
| _CPM_Rate | 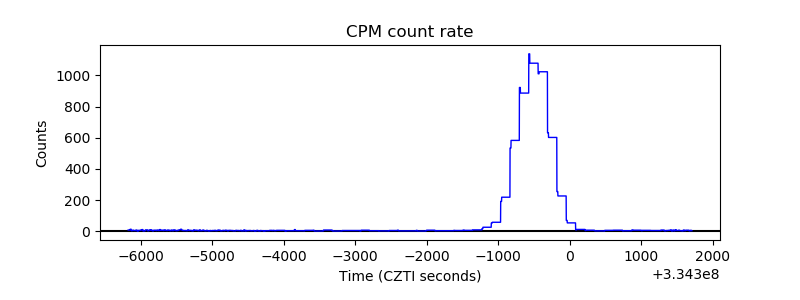 |
| CZT Counter | 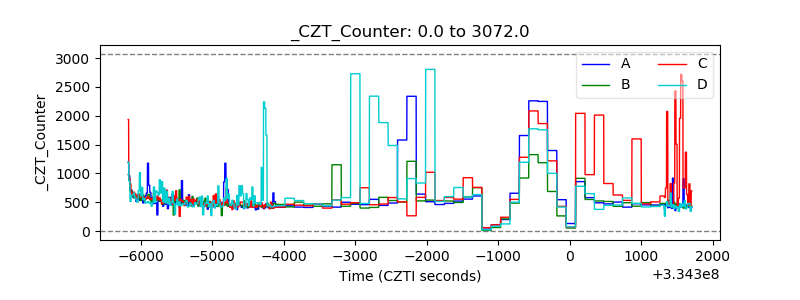 |
| +2.5 Volts monitor |  |
| +5 Volts monitor |  |
| _ROLL_ROT | 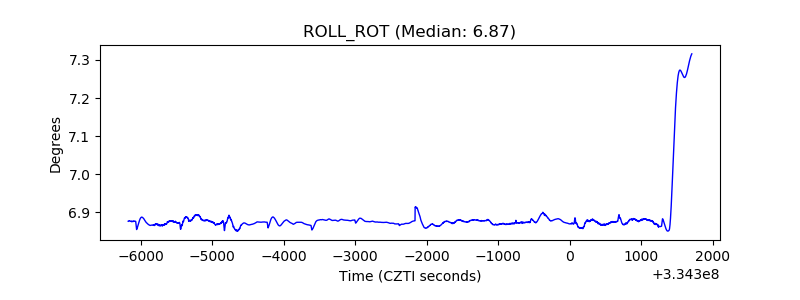 |
| _Roll_DEC | 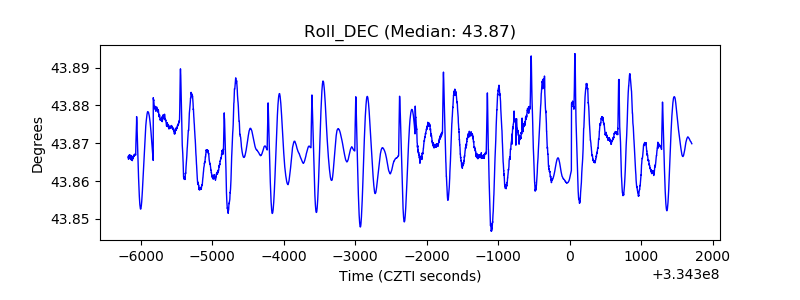 |
| _Roll_RA | 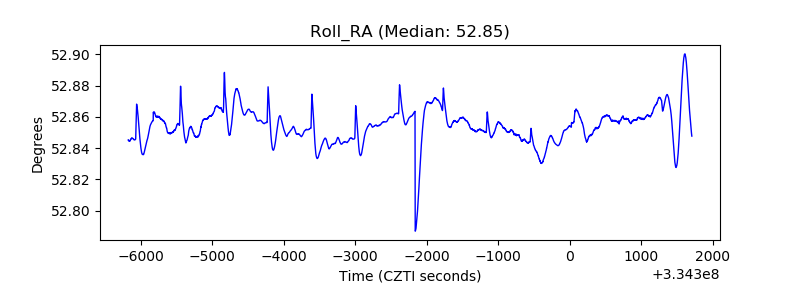 |
| Veto Counter |  |