| Param | Original file | Final file |
|---|---|---|
| Filename | modeM0/AS1A09_079T03_9000003790_26245cztM0_level2.evt | modeM0/AS1A09_079T03_9000003790_26245cztM0_level2_quad_clean.evt |
| Size (bytes) | 457,231,680 | 81,397,440 |
| Size | 436.1 MB | 77.6 MB |
| Events in quadrant A | 3,294,645 | 512,528 |
| Events in quadrant B | 2,870,884 | 531,990 |
| Events in quadrant C | 3,542,247 | 505,206 |
| Events in quadrant D | 3,733,558 | 497,737 |
| Mode M0 | |||
|---|---|---|---|
| Quadrant | BADHDUFLAG | Total packets | Discarded packets |
| A | 0 | 13705 | 0 |
| B | 0 | 12358 | 0 |
| C | 0 | 14303 | 0 |
| D | 0 | 15308 | 0 |
| Mode M9 | |||
|---|---|---|---|
| Quadrant | BADHDUFLAG | Total packets | Discarded packets |
| A | 0 | 10 | 0 |
| B | 0 | 10 | 0 |
| C | 0 | 10 | 0 |
| D | 0 | 10 | 0 |
| Quadrant | Total seconds | Saturated seconds | Saturation percentage |
|---|---|---|---|
| A | 5973 | 126 | 2.109493% |
| B | 5973 | 74 | 1.238908% |
| C | 5973 | 227 | 3.800435% |
| D | 5973 | 160 | 2.678721% |
Noise dominated data is calculated using 1-second bins in cleaned event files. If a bin has >2000 counts, and if more than 50% of those come from <1% of pixels, then it is considered to be noise-dominated and hence unusable.
| Quadrant | # 1 sec bins | Bins with >0 counts | Bins with >2000 counts | High rate bins dominated by noise | Noise dominated (total time) | Noise dominated (detector-on time) | Marked lightcurve |
|---|---|---|---|---|---|---|---|
| A | 6973 | 5974 | 44 | 44 | 0.63% | 0.74% | 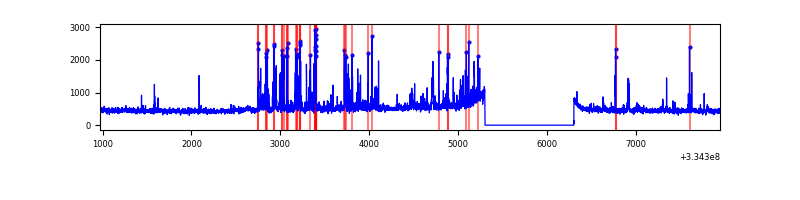 |
| B | 6973 | 5974 | 1 | 1 | 0.01% | 0.02% | 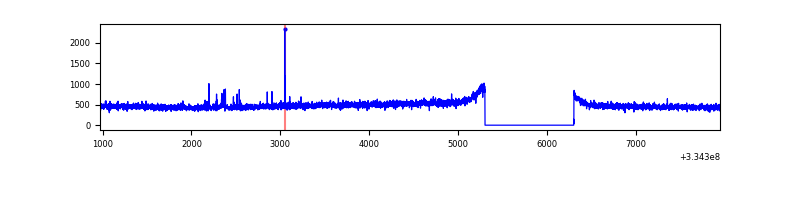 |
| C | 6973 | 5974 | 124 | 124 | 1.78% | 2.08% | 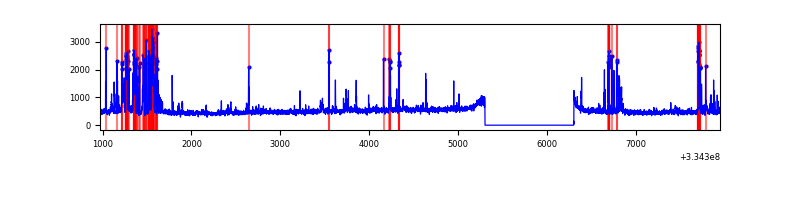 |
| D | 6973 | 5974 | 96 | 96 | 1.38% | 1.61% | 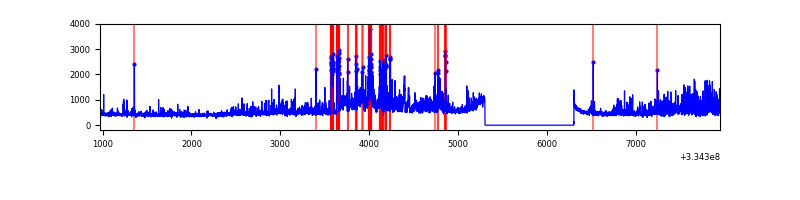 |
Top three noisy pixels from each quadrant. If the there are fewer than three noisy pixels in the level2.evt file, extra rows are filled as -1
| Pixel properties | Quadrant properties | ||||||
|---|---|---|---|---|---|---|---|
| Quadrant | DetID | PixID | Counts | Sigma | Mean | Median | Sigma |
| A | 0 | 13 | 472102 | 3205.63 | 729 | 713 | 147.1 |
| A | 13 | 254 | 10086 | 63.74 | 729 | 713 | 147.1 |
| A | 3 | 1 | 7602 | 46.85 | 729 | 713 | 147.1 |
| B | 12 | 111 | 16780 | 114.27 | 731 | 712 | 140.6 |
| B | 11 | 111 | 14602 | 98.78 | 731 | 712 | 140.6 |
| B | 14 | 111 | 13261 | 89.25 | 731 | 712 | 140.6 |
| C | 3 | 233 | 690585 | 4237.66 | 695 | 699 | 162.8 |
| C | 14 | 238 | 112184 | 684.8 | 695 | 699 | 162.8 |
| C | 2 | 16 | 32001 | 192.27 | 695 | 699 | 162.8 |
| D | 1 | 52 | 949828 | 5631.75 | 704 | 686 | 168.5 |
| D | 12 | 233 | 92990 | 547.69 | 704 | 686 | 168.5 |
| D | 2 | 234 | 27270 | 157.74 | 704 | 686 | 168.5 |
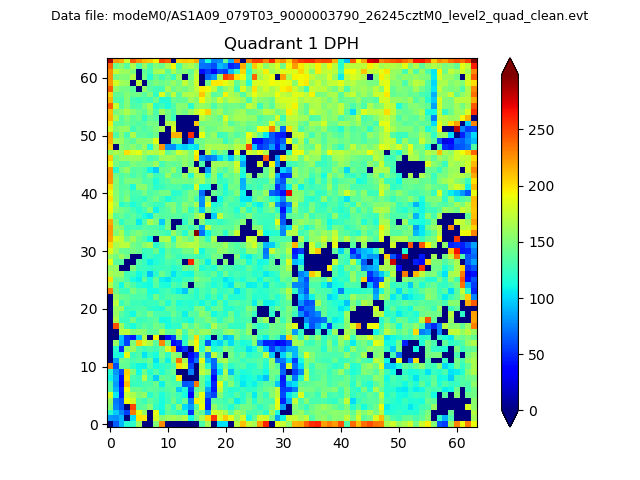
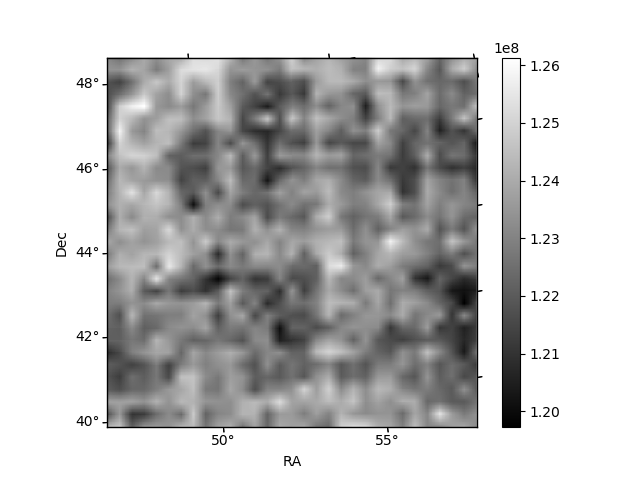
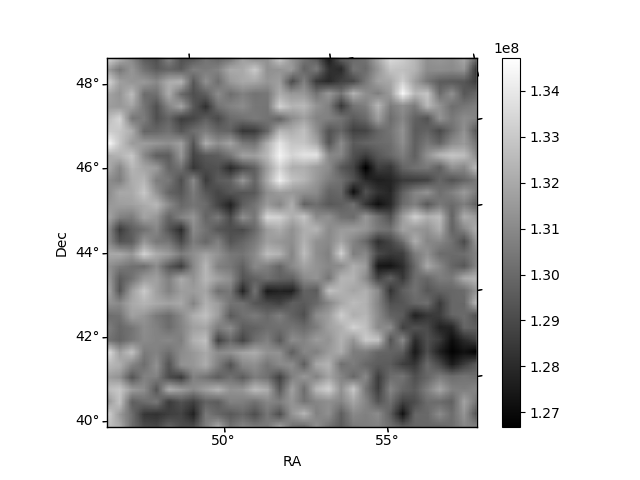
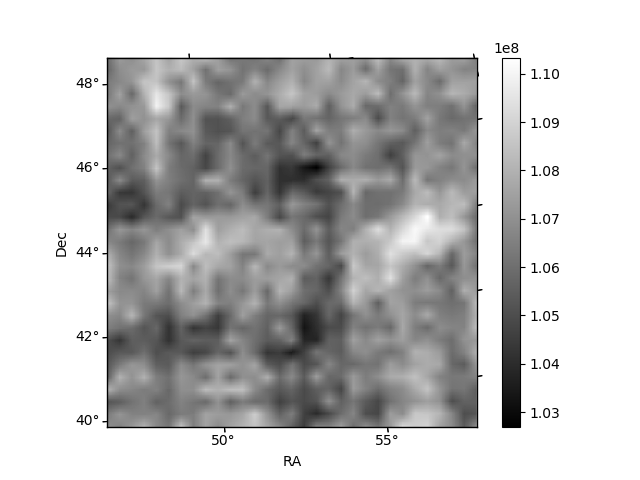
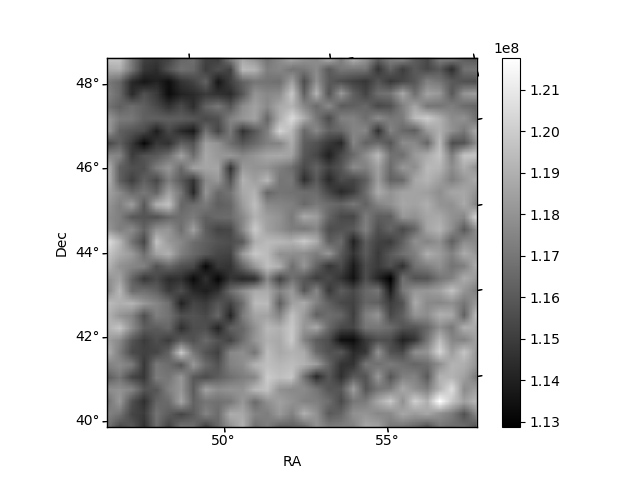
Histogram calculated using DETX and DETY for each event in the final _common_clean file
| Quadrant A |  |
 |
Quadrant B |
|---|---|---|---|
| Quadrant D | 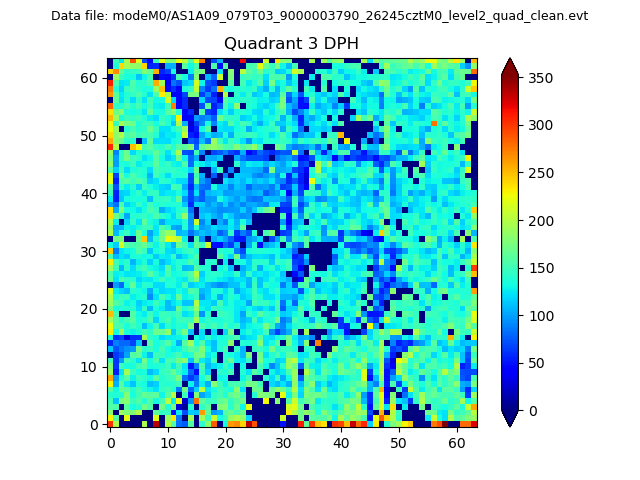 |
 |
Quadrant C |
| Plot type | Count rate plots | Images |
|---|---|---|
| Comparison with Poisson distribution Blue bars denote a histogram of data divided into 1 sec bins. Red curve is a Poisson curve with rate = median count rate of data. |
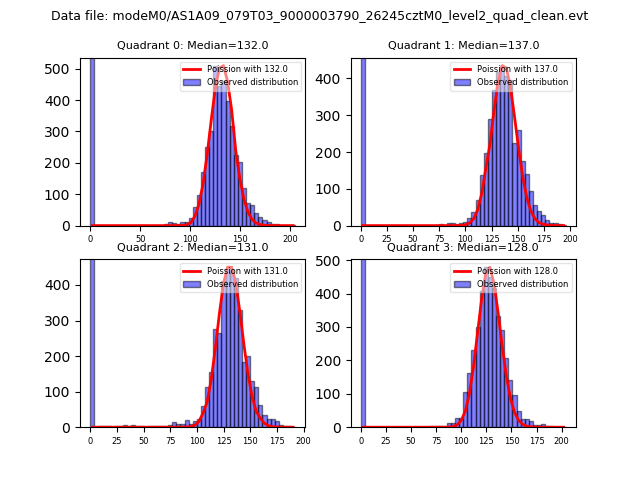 |
 |
| Quadrant-wise count rates Data is divided into 100 sec bins |
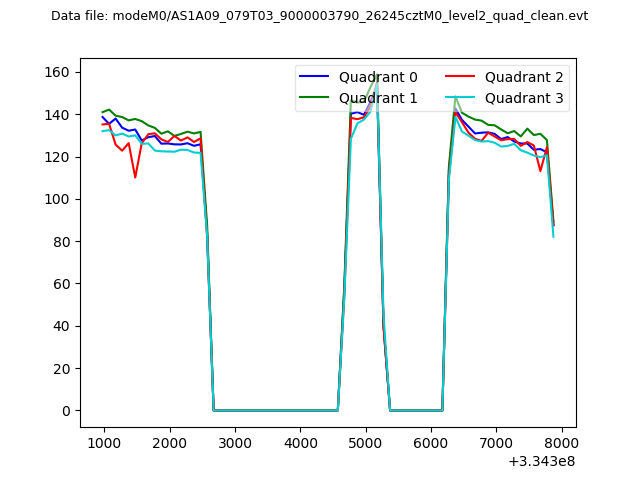 |
|
| Module-wise count rates for Quadrant A Data is divided into 100 sec bins |
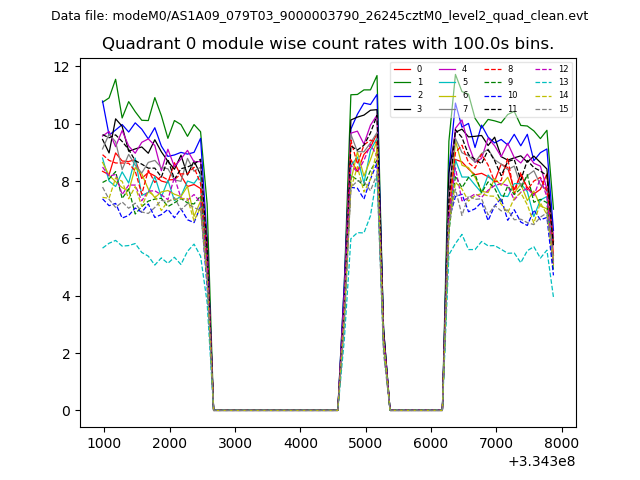 |
 |
| Module-wise count rates for Quadrant B Data is divided into 100 sec bins |
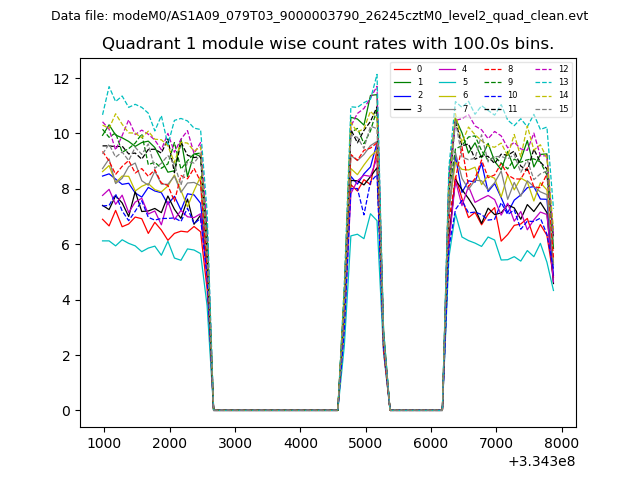 |
 |
| Module-wise count rates for Quadrant C Data is divided into 100 sec bins |
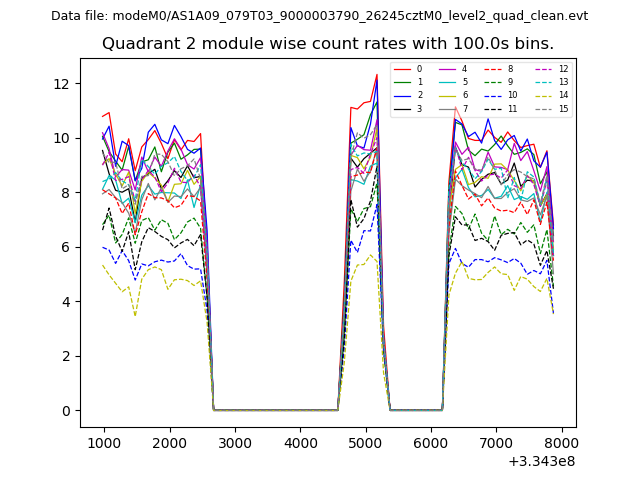 |
 |
| Module-wise count rates for Quadrant D Data is divided into 100 sec bins |
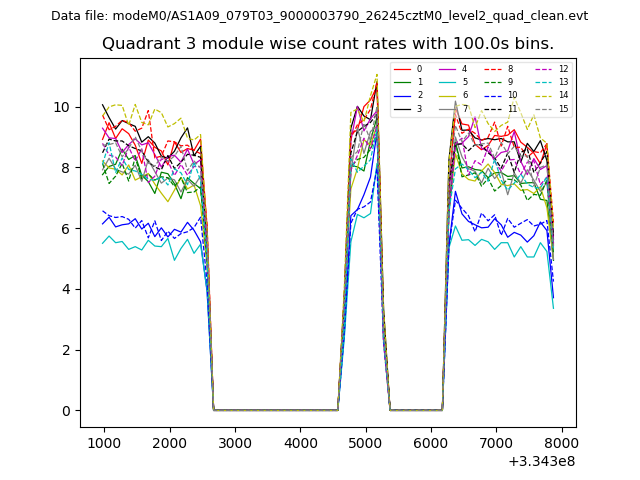 |
 |
| Parameter | Plot |
|---|---|
| CZT HV Monitor | 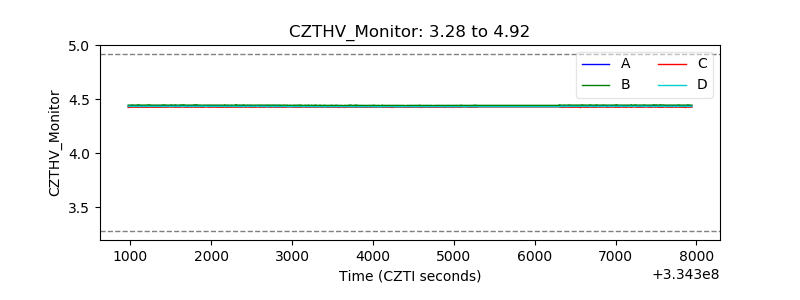 |
| D_VDD | 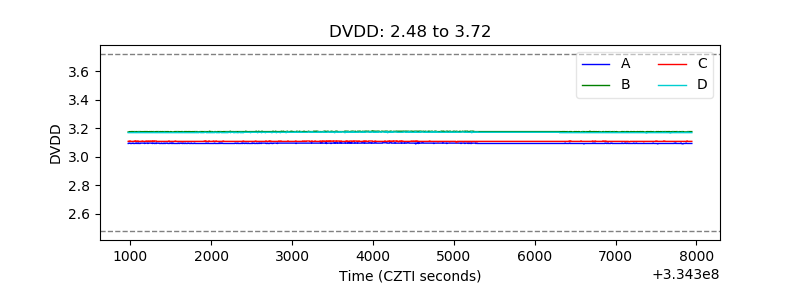 |
| Temperature 1 | 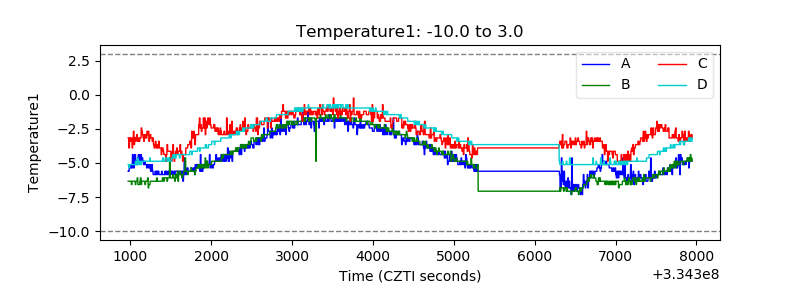 |
| Veto HV Monitor |  |
| Veto LLD | 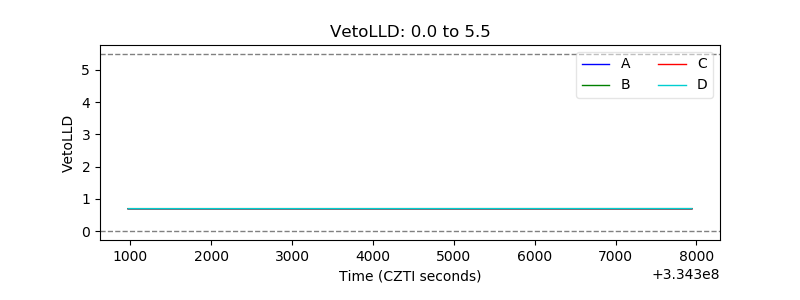 |
| Alpha Counter | 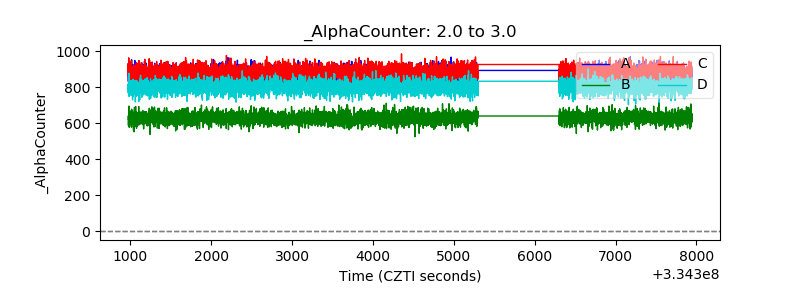 |
| _CPM_Rate | 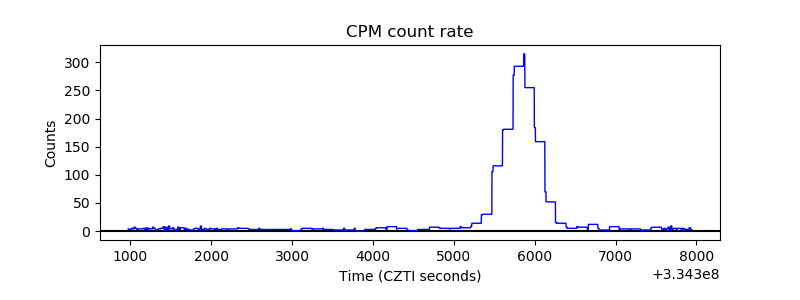 |
| CZT Counter | 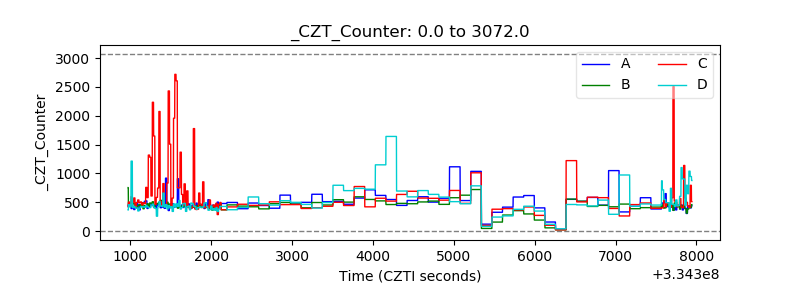 |
| +2.5 Volts monitor |  |
| +5 Volts monitor |  |
| _ROLL_ROT | 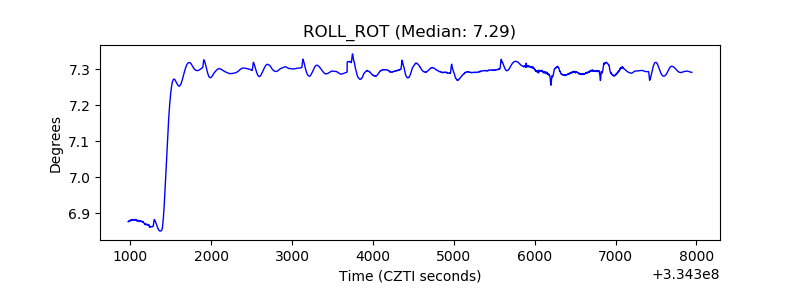 |
| _Roll_DEC | 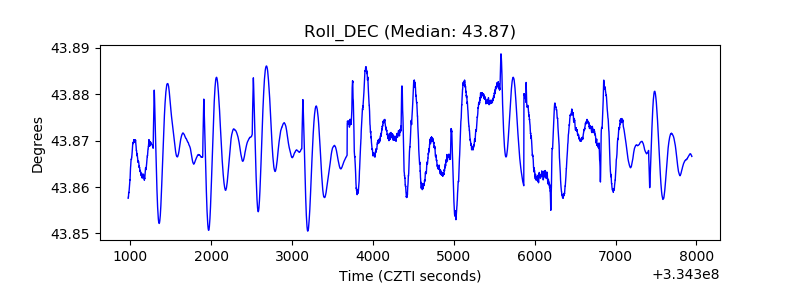 |
| _Roll_RA |  |
| Veto Counter | 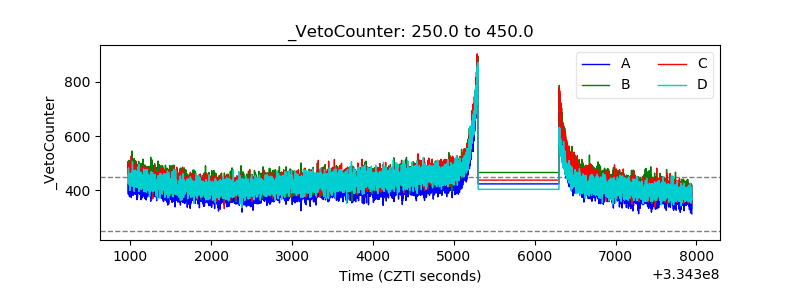 |