| Param | Original file | Final file |
|---|---|---|
| Filename | modeM0/AS1A09_079T03_9000003790_26246cztM0_level2.evt | modeM0/AS1A09_079T03_9000003790_26246cztM0_level2_quad_clean.evt |
| Size (bytes) | 534,205,440 | 94,000,320 |
| Size | 509.5 MB | 89.6 MB |
| Events in quadrant A | 3,332,414 | 597,757 |
| Events in quadrant B | 3,261,840 | 620,803 |
| Events in quadrant C | 3,858,542 | 595,549 |
| Events in quadrant D | 5,266,542 | 560,554 |
| Mode M0 | |||
|---|---|---|---|
| Quadrant | BADHDUFLAG | Total packets | Discarded packets |
| A | 0 | 14302 | 0 |
| B | 0 | 13992 | 0 |
| C | 0 | 15726 | 0 |
| D | 0 | 20282 | 0 |
| Mode M9 | |||
|---|---|---|---|
| Quadrant | BADHDUFLAG | Total packets | Discarded packets |
| A | 0 | 6 | 0 |
| B | 0 | 6 | 0 |
| C | 0 | 6 | 0 |
| D | 0 | 6 | 0 |
| Quadrant | Total seconds | Saturated seconds | Saturation percentage |
|---|---|---|---|
| A | 6768 | 98 | 1.447991% |
| B | 6768 | 93 | 1.374113% |
| C | 6769 | 196 | 2.895553% |
| D | 6769 | 343 | 5.067218% |
Noise dominated data is calculated using 1-second bins in cleaned event files. If a bin has >2000 counts, and if more than 50% of those come from <1% of pixels, then it is considered to be noise-dominated and hence unusable.
| Quadrant | # 1 sec bins | Bins with >0 counts | Bins with >2000 counts | High rate bins dominated by noise | Noise dominated (total time) | Noise dominated (detector-on time) | Marked lightcurve |
|---|---|---|---|---|---|---|---|
| A | 7388 | 6769 | 13 | 13 | 0.18% | 0.19% | 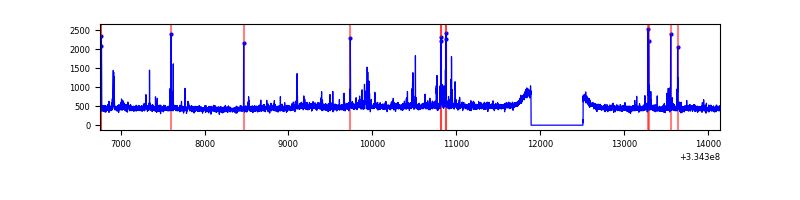 |
| B | 7388 | 6769 | 1 | 1 | 0.01% | 0.01% | 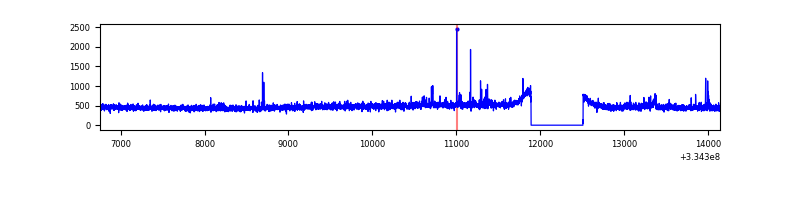 |
| C | 7389 | 6770 | 63 | 63 | 0.85% | 0.93% | 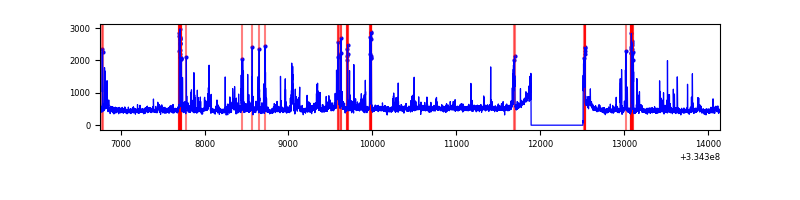 |
| D | 7389 | 6770 | 231 | 231 | 3.13% | 3.41% | 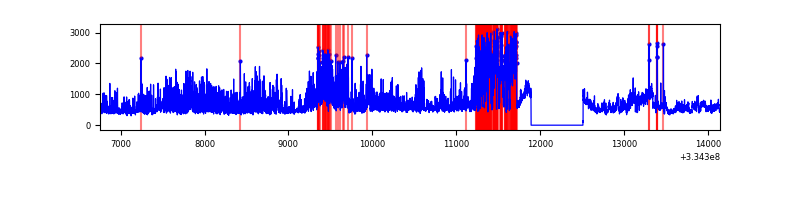 |
Top three noisy pixels from each quadrant. If the there are fewer than three noisy pixels in the level2.evt file, extra rows are filled as -1
| Pixel properties | Quadrant properties | ||||||
|---|---|---|---|---|---|---|---|
| Quadrant | DetID | PixID | Counts | Sigma | Mean | Median | Sigma |
| A | 0 | 13 | 184334 | 1119.99 | 814 | 795 | 163.9 |
| A | 13 | 254 | 10285 | 57.91 | 814 | 795 | 163.9 |
| A | 3 | 1 | 7628 | 41.7 | 814 | 795 | 163.9 |
| B | 7 | 219 | 40296 | 250.81 | 814 | 793 | 157.5 |
| B | 12 | 111 | 19317 | 117.61 | 814 | 793 | 157.5 |
| B | 11 | 111 | 16875 | 102.11 | 814 | 793 | 157.5 |
| C | 3 | 233 | 702866 | 3873.61 | 775 | 779 | 181.2 |
| C | 14 | 238 | 123546 | 677.34 | 775 | 779 | 181.2 |
| C | 2 | 16 | 14209 | 74.1 | 775 | 779 | 181.2 |
| D | 1 | 52 | 2276062 | 12399.27 | 769 | 749 | 183.5 |
| D | 12 | 233 | 51858 | 278.52 | 769 | 749 | 183.5 |
| D | 2 | 234 | 28249 | 149.86 | 769 | 749 | 183.5 |
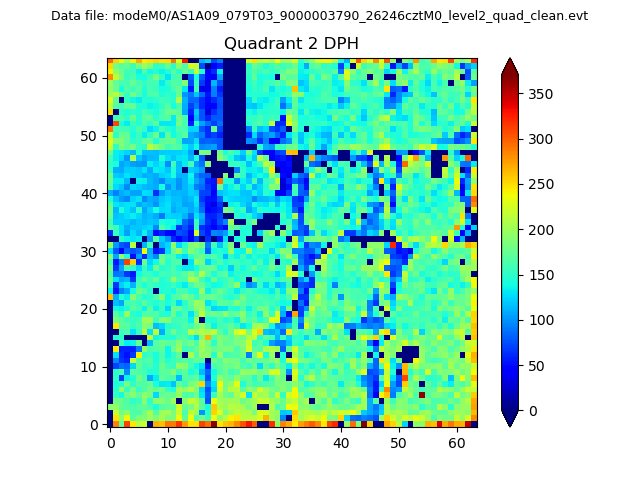
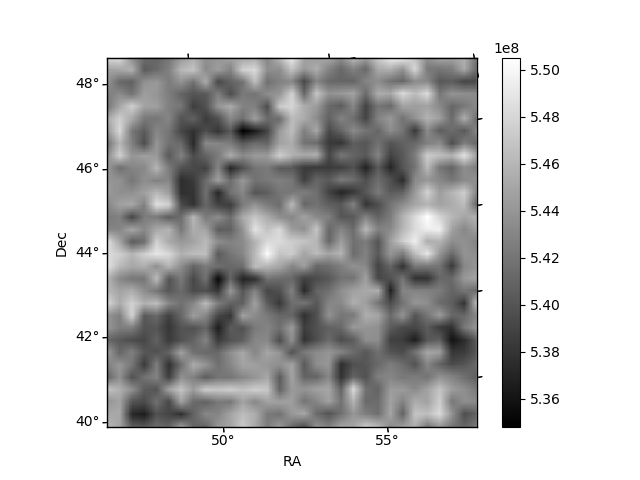
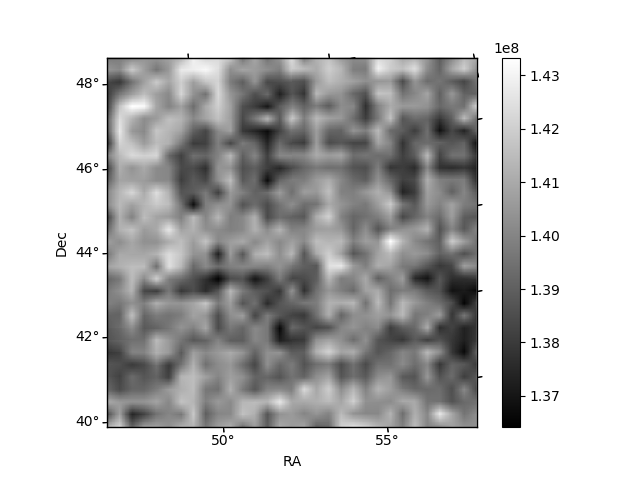
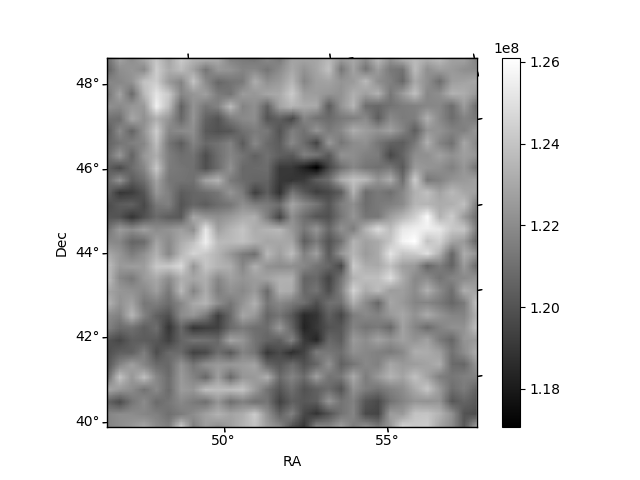
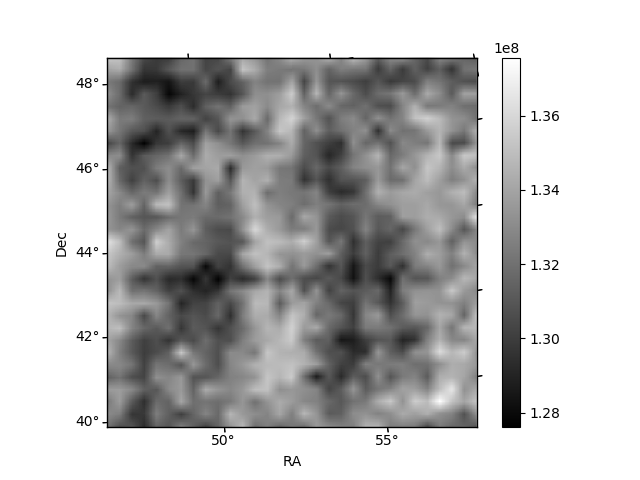
Histogram calculated using DETX and DETY for each event in the final _common_clean file
| Quadrant A | 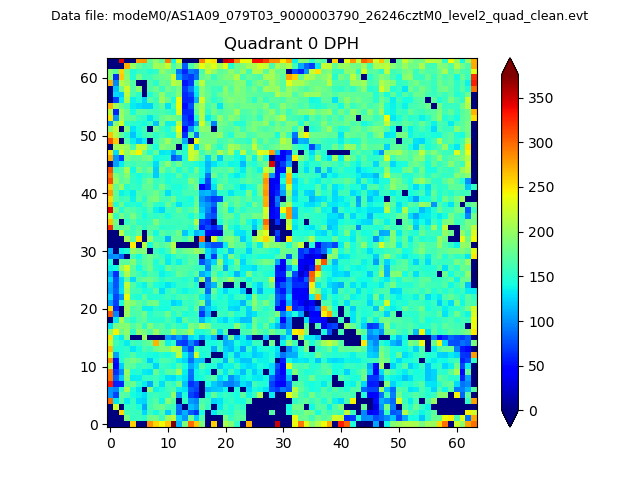 |
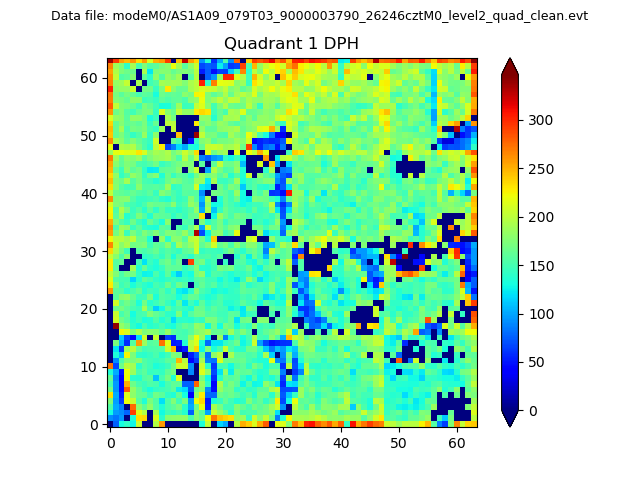 |
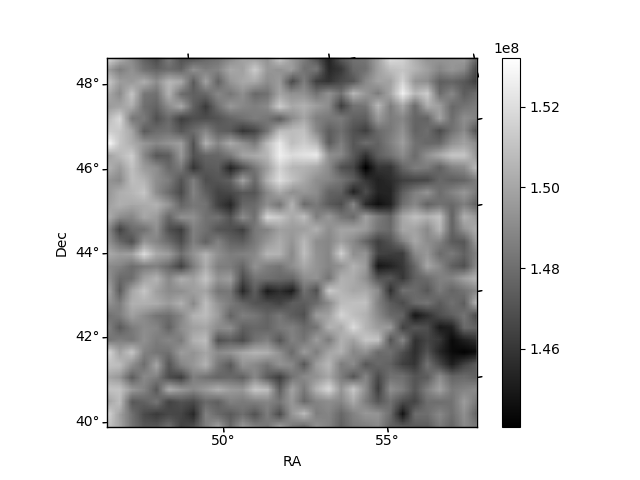
Quadrant B |
|---|---|---|---|
| Quadrant D | 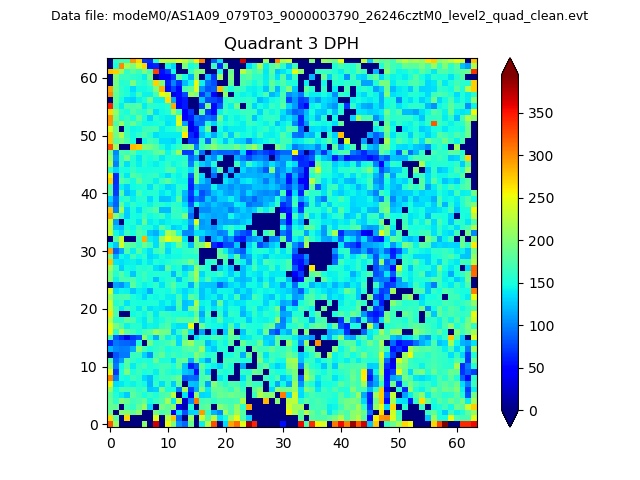 |
 |
Quadrant C |
| Plot type | Count rate plots | Images |
|---|---|---|
| Comparison with Poisson distribution Blue bars denote a histogram of data divided into 1 sec bins. Red curve is a Poisson curve with rate = median count rate of data. |
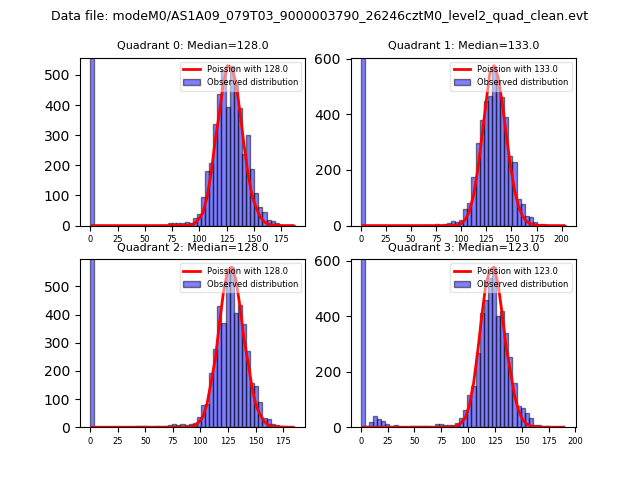 |
 |
| Quadrant-wise count rates Data is divided into 100 sec bins |
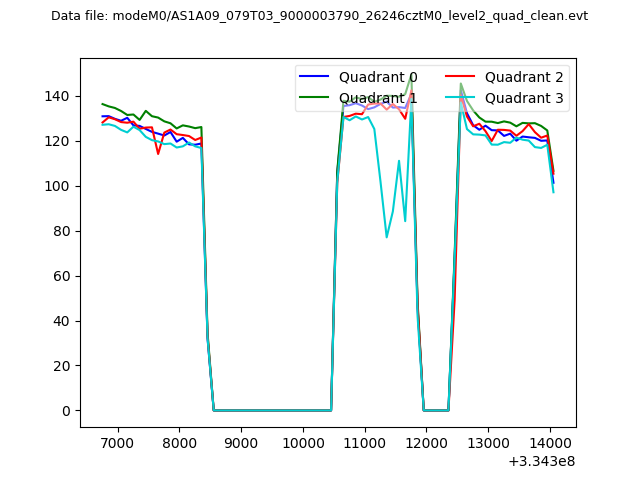 |
|
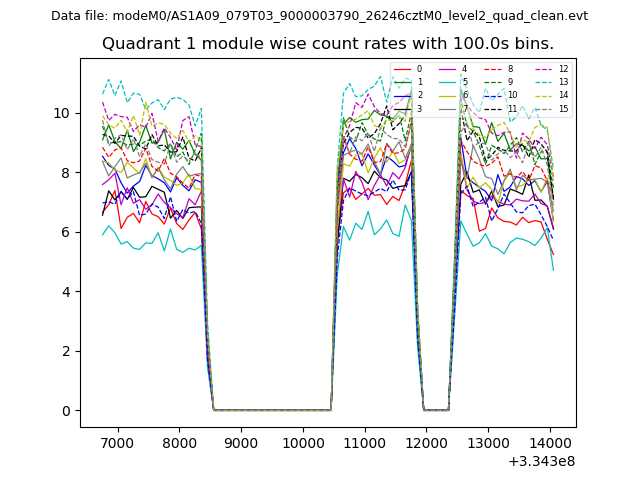
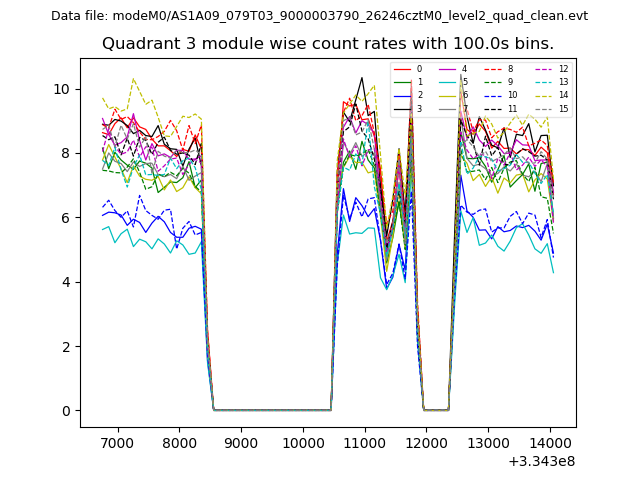
| Module-wise count rates for Quadrant A Data is divided into 100 sec bins |
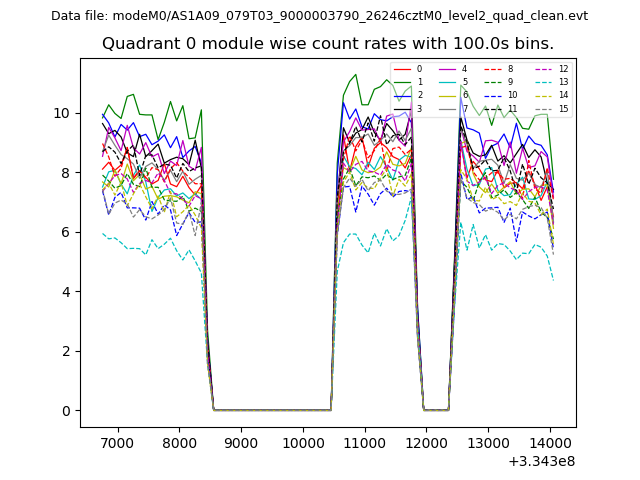 |
 |
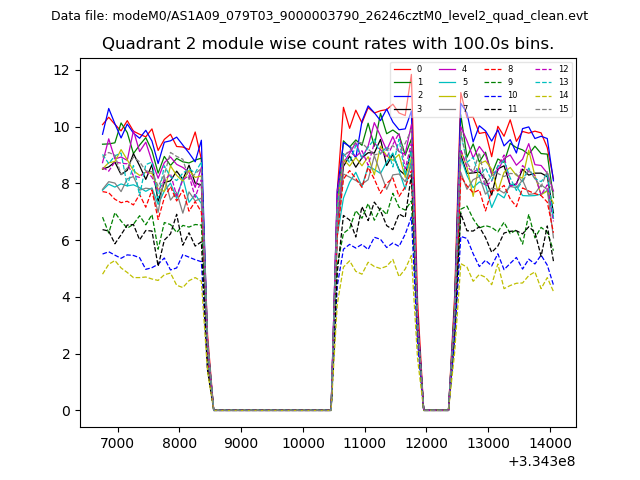
| Module-wise count rates for Quadrant B Data is divided into 100 sec bins |
 |
 |
| Module-wise count rates for Quadrant C Data is divided into 100 sec bins |
 |
 |
| Module-wise count rates for Quadrant D Data is divided into 100 sec bins |
 |
 |
| Parameter | Plot |
|---|---|
| CZT HV Monitor | 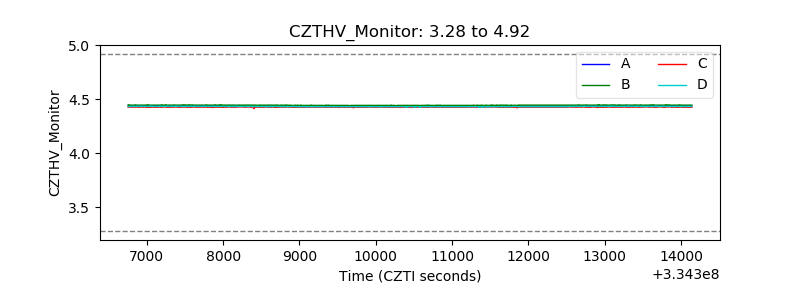 |
| D_VDD | 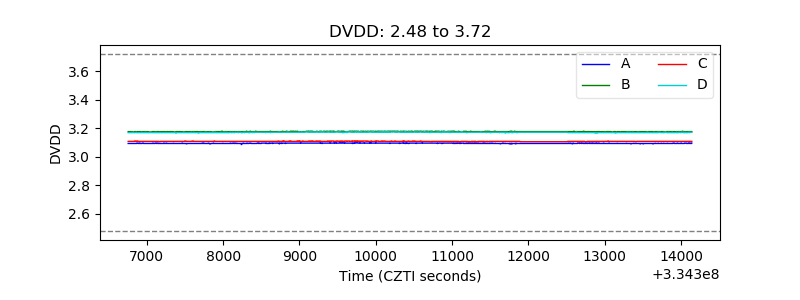 |
| Temperature 1 | 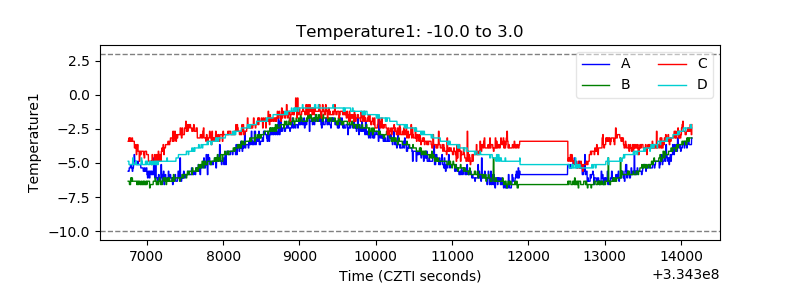 |
| Veto HV Monitor | 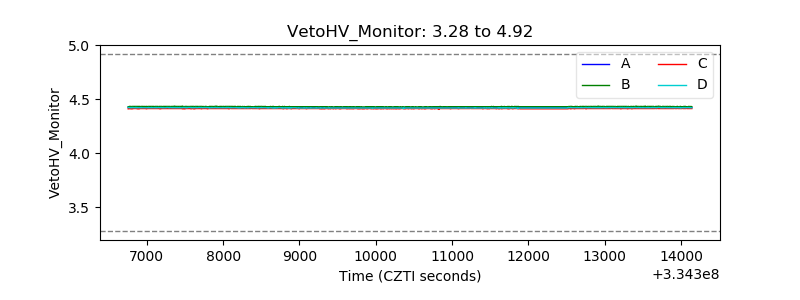 |
| Veto LLD | 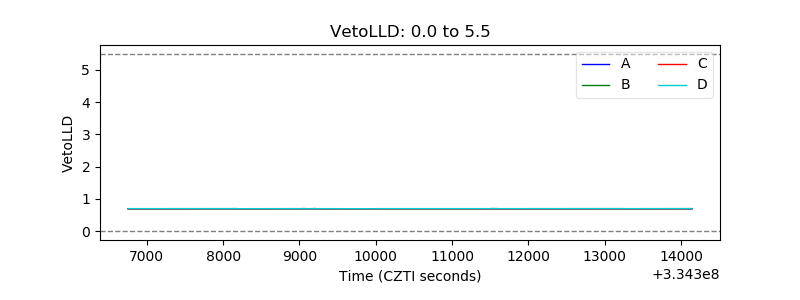 |
| Alpha Counter |  |
| _CPM_Rate |  |
| CZT Counter | 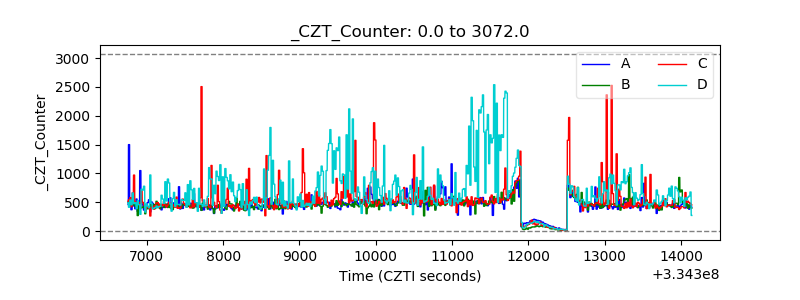 |
| +2.5 Volts monitor |  |
| +5 Volts monitor |  |
| _ROLL_ROT | 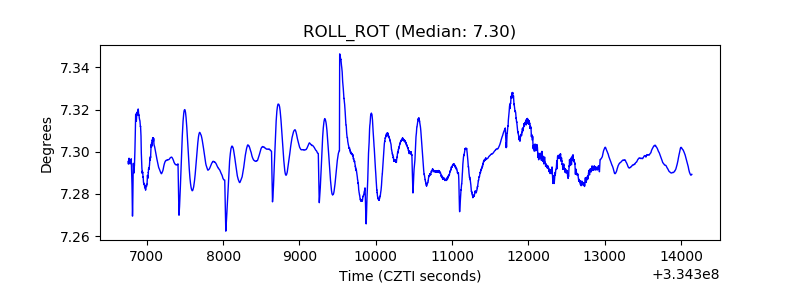 |
| _Roll_DEC | 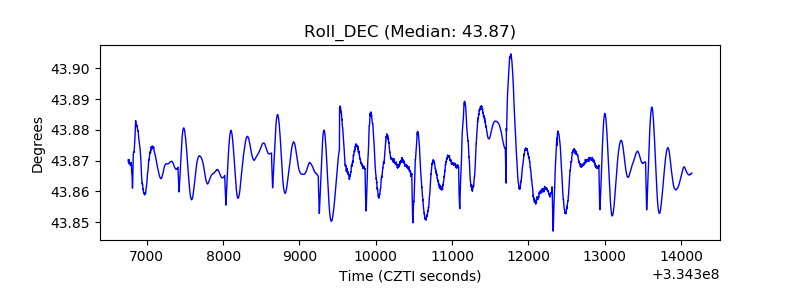 |
| _Roll_RA | 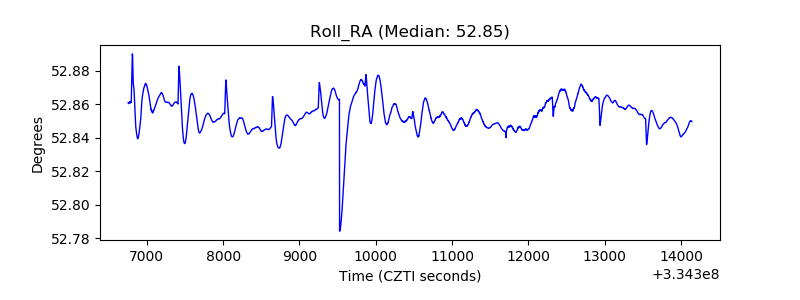 |
| Veto Counter | 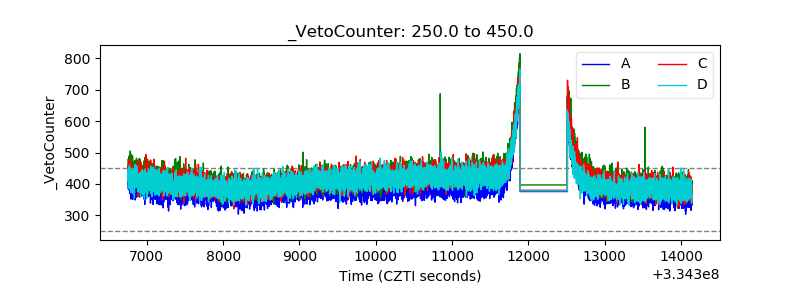 |